
Abstract
Identification of influential nodes in multifaceted and social networks become one of the most significant researches in this booming digital world. Many strategies were proposed to determine the dominance of nodes based on their topographical information in the networks. Traditionally, centrality measurements were used directly on topographical structure of the networks and these measurements consider different characteristics related to structural and functional importance. The nonlinear link between the functional importance of the nodes, which makes the study so complicated and difficult to detect using traditional centrality measures. Inspired by the amazing execution structure of long short-term memory (LSTM), this article proposes the new hybrid boosted ensemble LSTM framework for solving the mentioned problem. This proposed framework adopts the enhanced centrality methods to construct the different feature vectors that can reflect the functional and structural location of the nodes in their networks, then categorizes the nodes in accordance with the measurements, and finally uses the proposed boosted deep learning framework to classify and rank the influential nodes. From the extensive experiments, the proposed framework has shown the best classification accuracy of 95.5% and it outperforms the other machine and deep learning models and even traditional centrality measurements.
Introduction
In recent times, social networks have been rooted in common man's life and it is playing the most crucial role in transforming human life. These networks play an important role in spreading the vital information among the other users in networks.1–3 Individuals who participate in social and complex networks have independent characteristics and importance based on their inputs and involvement. From those, few individuals play a significant role in the success of spread of information.4–6
With this scenario, research of finding the influential points in the social and complex networks has attracted brighter interests because of its features and also its excessive implication in numerous purposes such as (1) in network protection model, the key target is to find the crucial nodes that have control over the other nodes in terms of transmitting fake news, worms, and even transmission of diseases 7 ; (2) in big data analysis, investigators have adopted applicable models to detect important information among the enormous data stored 8 ; (3) in electrical field, researchers use intelligent methods to identify the influential nodes during power transmission 9 ; (4) marketing investors in advertising domain use novel methods to optimize the advertising strategy 10 ; and (5) even in stem cell therapy, cognitive methods were adopted to identify key information in the cells. 11
Various centrality measurements, such as betweenness, 12 degree, 13 closeness, 14 shell types, 15 and cluster rank values, 16 Eigen value, 17 can be used to identify prominent nodes in networks, with nodes with higher centralities being deemed more influential than those with lower centralities. However, in many real-time scenarios, these centrality measures yield only local and global information but not the other relational factors such as neighborhood importance and infection rates (IRs). 17 Hence the traditional centrality measurements suffer from the drawback of finding the complex relationship between the utilitarian significance of the nodes and its features that result in performance degradation and nonflexible behavior in a real-time situation.
The rise of artificial intelligence in terms of machine and deep acquiring models has been used to tackle the mentioned problems. Recently the deep learning models have become more popular due to its flexibility and handling huge volume of data. The significant network-oriented applications of deep neural learning models are listed as: (1) in link prediction mechanism, gated recurrent unit18,19 encoder has been used to learn both spatial and temporal information of the network and encoded long short-term memory (E-LSTM) 20 has been used to enhance the performance in link prediction problems. However, these algorithms are used to predict the connectivity in the networks but do not solve the mentioned problems. Moreover, intelligent modeling of deep learning methods is badly required to uncover the complex relationship between the different characteristics of the nodes that, in turn, effectively classifies the most important influential category of nodes without sacrificing performances.
With this motivation, this research proposes the new deep learning-based framework EC-BED-NETS (enhanced centralities based on boosted ensembled deep learning networks). The proposed algorithm is different from the existing methodologies in the following ways:
This research discusses about the enhanced centrality measurements suitable for designing an intelligent prediction model for influential nodes using deep learning models. The next objective of this research is all about designing the hybrid scalable deep learning models that can efficiently classify the important nodes in the networks. Finding the influential nodes in social media networks is a real challenge among researchers. The proposed deep learning model that is implemented in this research has provided new limelight for the mentioned problem.
The association of the script is given as follows:
Related studies by different authors are discussed in Related Studies section. Details of the proposed methodology, enhanced feature extraction, and data labeling along with the proposed hybrid algorithms are discussed in the Proposed Methodology section. Experimental results, comparative analysis, and validation mechanisms are accessible in Experimental Results section. The article is concluded along with future scope in Discussion and Conclusion section.
Related Studies
Most commonly, real-time applications such as Twitter, social networks, G-maps, and so on are structured as the network graphs (i.e., nodes and links). In such complex networks, endeavor influential nodes become a big challenge nowadays. To address this, researchers are focusing on learning models to predict the most important nodes on each network.
Fan et al. in 2019 proposed a neural network graph framework termed as “DrBC” to perceive the betweenness centrality (BC) among nodes in the network. This traditional method comprises encoders and decoders. Neighborhood encoders are used to capture each node's structural information. The Meridien Lossless Packing (MLP) decoder uses the BC value to determine the relative rank of each node, which is then prioritized during runtime. This learning model includes small network graphs that is directly implemented on real-world network. 21 Ahmad et al. in 2020 developed a new clustering approach for identification of influential nodes on social networks. The proposed method used the k-shell decomposition algorithm to segregate the nodes and forms the clusters. Extended clustering coefficient ranking approach is designed to group local nodes based on its similarity and is correlated together. A node with low-correlation ratio is identified as the most influential node that can spread messages to different locations inside the social network. The proposed model does have a time complexity barrier that is difficult to overcome if the network is too large. 22
Li et al. created a reinforcement learning algorithm such as Quasi-Recurrent Neural Network (Q-RNN) with seed selection approach to detect the most significant node in social networks. Deep learning neural network-based influence maximization (DISCO) includes various states to capture the structural information of nodes. Based on the rewards received on each node, influential nodes have been detected. DISCO can avoid the costly diffusion sampling phase. 23 Devika and Subramaniyaswamy developed a semantic graph with vertices and links. Unsupervised semantic graph-based solutions for singable reflection have an essential point to establish an organisation of words, and then hubs will be positioned based on centrality measures. The proposed method includes feature extraction of Twitter information, keyword extraction algorithm in terms of BC, eigenvector, degree, etc. The extracted features comprise semantic features and node features to notice the top 10 significant nodes in Twitter network, and page ranking algorithm is used to sort the influential nodes at runtime. 24
Mao and Xiao created an essential centrality measure named PARW-Rank which used the basic centrality measures for assessing hub influences and arbitrary walk procedure. The halfway inclination map is built by analyzing the inclination connection between each hub match in an organization for each important degree (partial dependence graph). 25 Nurek and Michalski utilized supervised learning algorithms such as decision trees, support vector machine (SVM), and Random Forest to predict the influential node in social networks. The network features and social information are combined to form structural data. The developed preparation data have been feedforwarded into various machine learning algorithms. 26
Rossi et al. devised a system for visualizing complex social systems and identifying significant hubs in their structure. Creators proposed a most standard algorithm called as K-truss composition strategy that makes a difference in visualizing and analyzing the social systems and discovery of persuasive hubs. 27
Zhao et al. devised a scheme and tested it within the same network. He found out that the typical role of machine learning (ML) classifiers is far superior to traditional centrality techniques in identifying server centers and their capacities, and shows the better centrality procedures. The proposed model is effective in small scale networks and not suitable for large network models. 28
Proposed Methodology
The proposed EC-BED-NETS structure for categorizing the influential nodes is presented in Figure 1. In this article, node and hub have been interchangeably used with similar meaning.
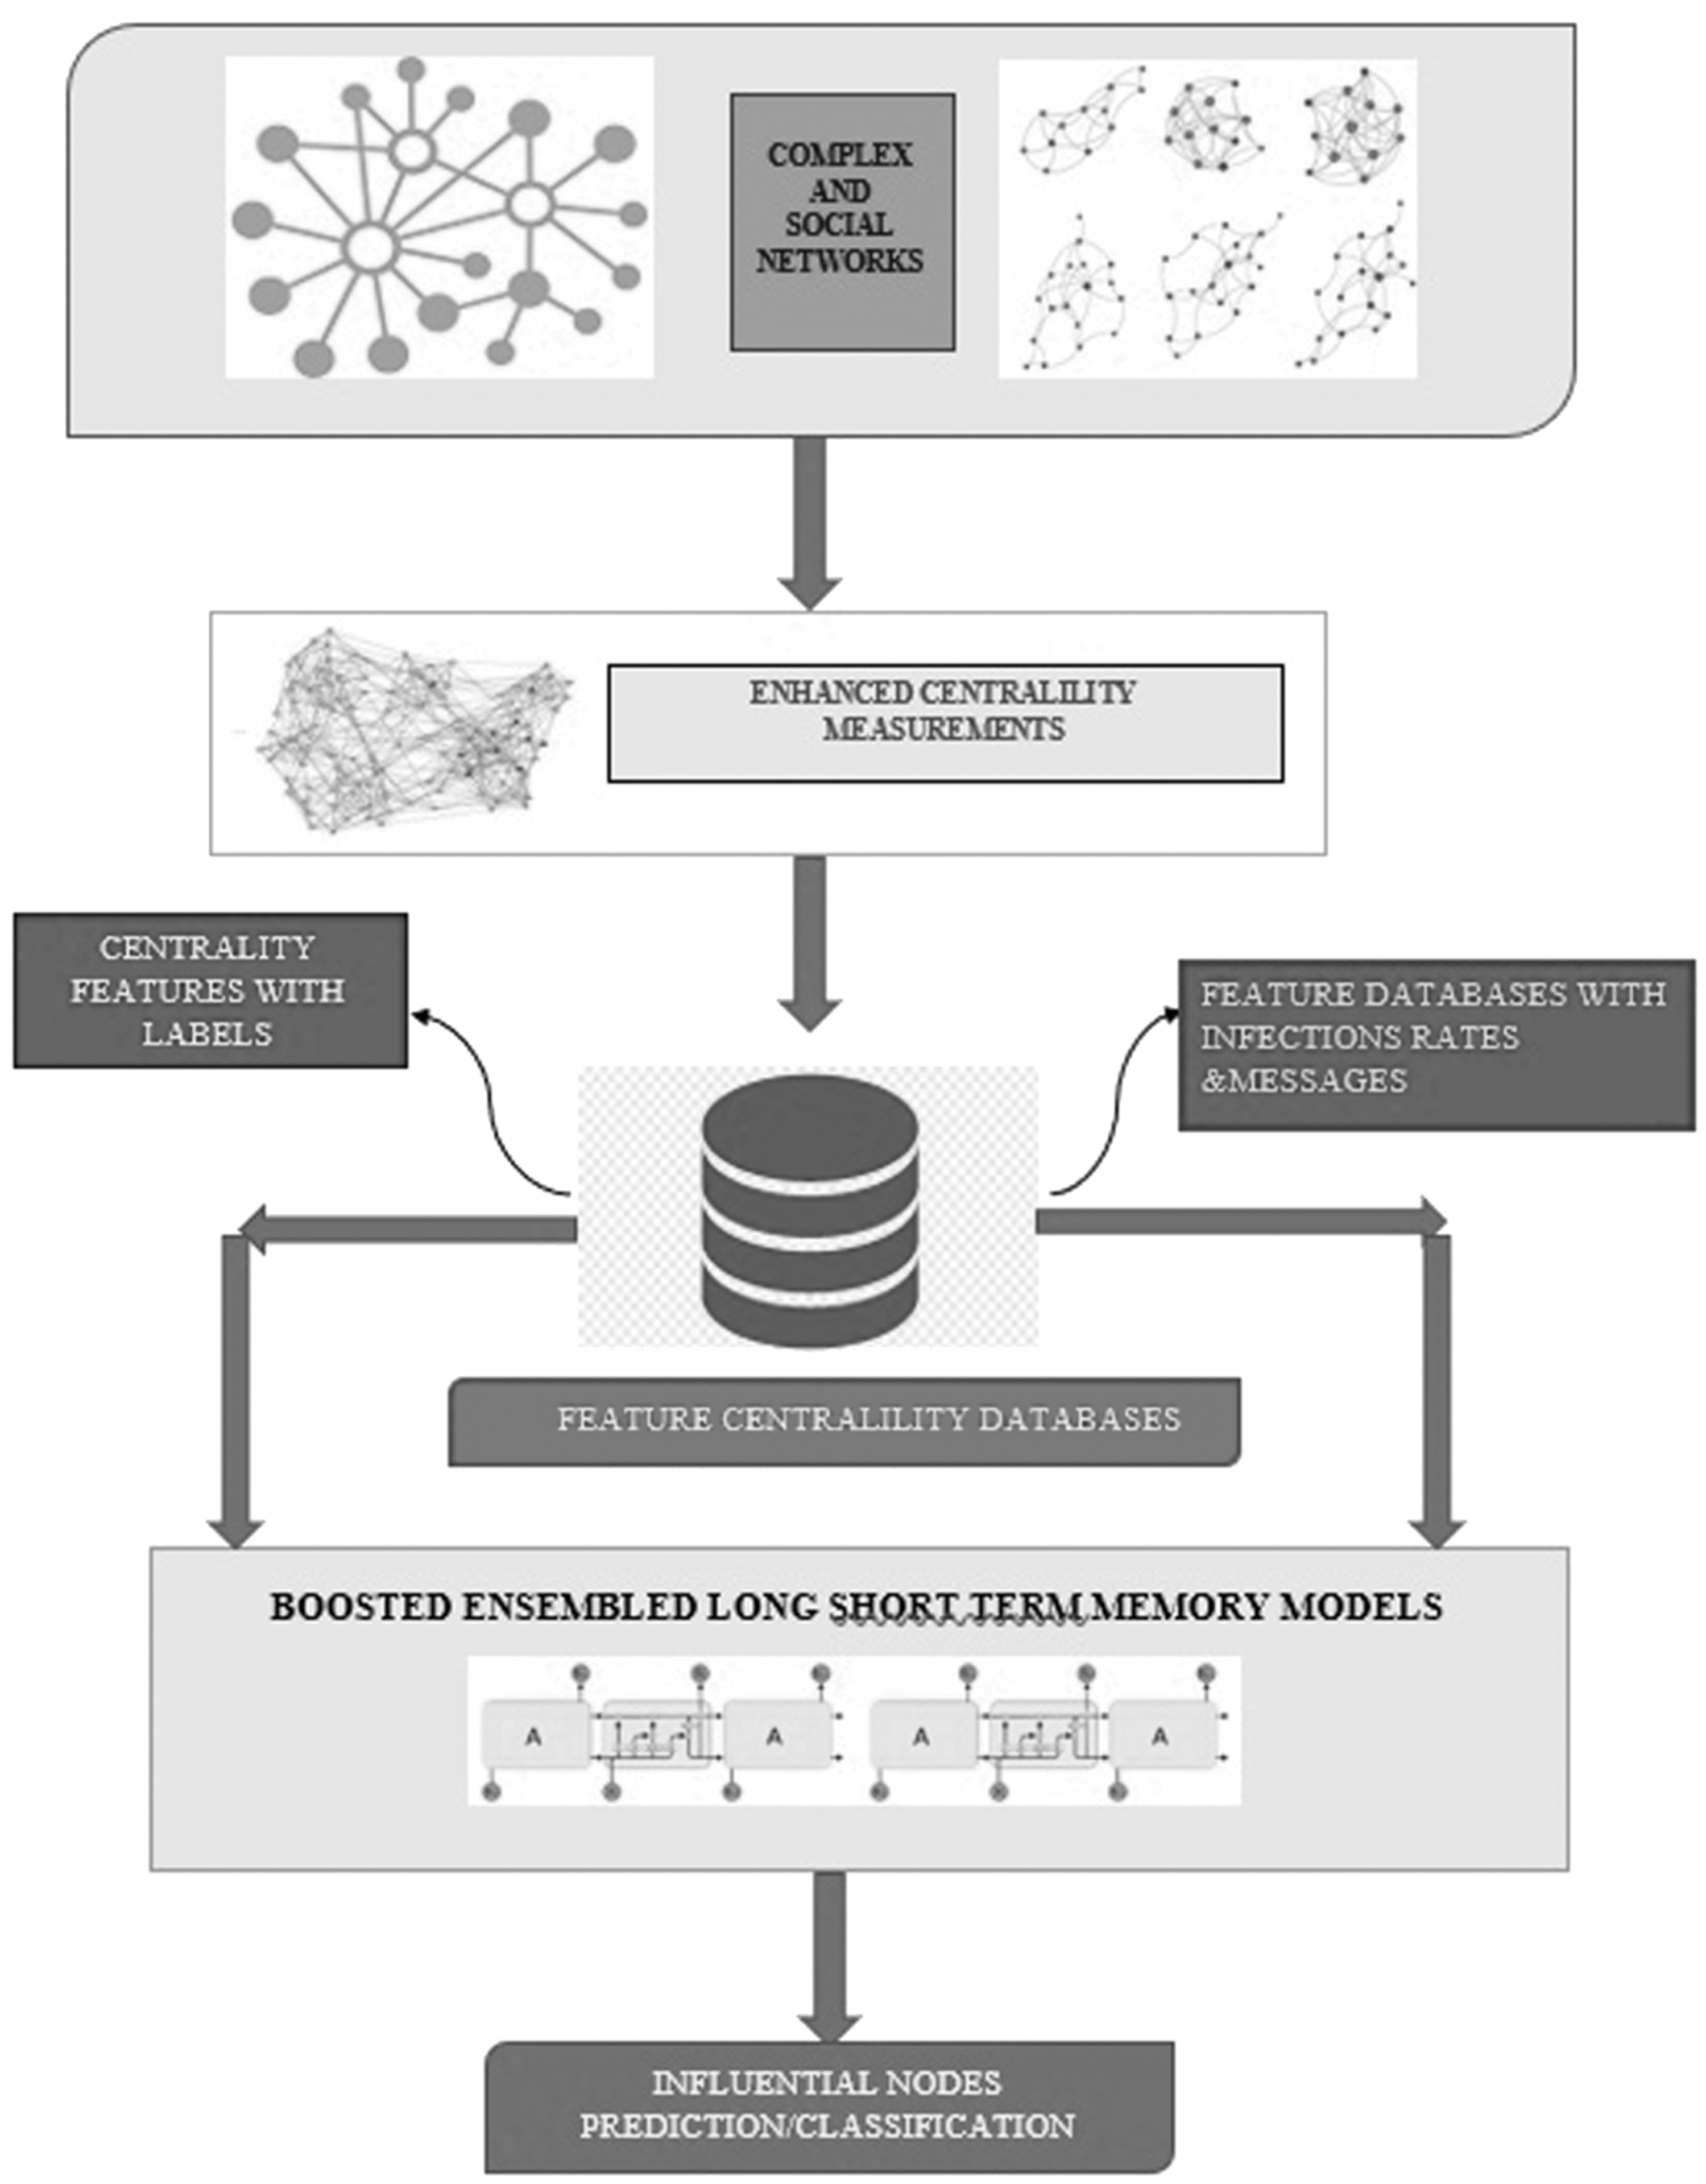
Block diagram for the proposed EC-BED-NETS frameworks for influential node identification. EC-BED-NETS, Enhanced Centralities Based on Boosted Ensembled Deep Learning Networks.
Overview mechanism
Identification of the influential nodes based on the proposed algorithm is shown in Figure 1. The proposed algorithm uses the enhanced centrality features along with the infections as the preparation data sets. This article builds the new feature vectors to each node using the enhanced centrality measures and the IRs. Then, based on the training data sets, the article uses the boosted ensembled deep learning models to learn the cataloging/prediction rules and to categorize the importance of influential nodes in complex and social networks. Relevant discussions are presented as follows.
Data sets
In this study, we analyzed several benchmark network datasets such LFR-1000, 29 LFR-200, 29 Dolphin, 30 Copperfield, 31 Netscience, 32 Euroroad, 33 Chicago, 34 and PGP, 35 as well as social networks like WhatsApp to gather data and build centrality features for improved categorization. Table 1 presents detailed information of the different network scenarios used for data set collection.
Different network scenario benchmarks used for data set collection
Figure 2 shows the different network benchmark scenarios that are used for testing and validation.

Different network scenario used in the proposed framework
Enhanced centrality feature extraction
The main focus of this research is to construct efficient feature databases that can differentiate the normal and influential nodes. In the literature, many centrality measure detection methods have been proposed to represent the importance of the nodes. But this article illustrates the usage of the enhanced number of centrality measurements to make the most accurate classification of the influential nodes.
To represent the structural and functional characteristics of the nodes, the following centralities are measured.
Degree centralities
This centrality signifies the number of relationships connected to the nodes. It has two types: one is indegree centrality and the other is outdegree centrality. The centralities can be determined by the following equations:
Indegree centrality,
where “Pji” is the edge going from Pi node to evaluate node P.
Outdegree centrality,
where “Pij” is the connectivity weight (i.e., edge) from evaluated node Pi to every other node Pj in the network.
Betweenness centralities
This reflects the fraction of all shortest paths passing through the nodes. The mathematical expression for BC is given as follows:
where
Closeness centralities
This represents the distance of nodes in the networks whose mathematical expressions are given as
where N is the number of vertices in the network and d(Py,Pi) is the distance between vertices Py and Pi.
Eigen vector centralities
The eigen vector centrality is used for computing the centralities of other nodes in the network and the expression to determine eigen vector centrality is given as follows:
where
PageRank centralities
It computes the ranking of the nodes based on the centrality of the nodes in networks and the expression to determine it is given as
where
Position centrality
This is considered to be most important measurement that represents the position of the nodes in relevance to the important nodes that are calculated by the PageRank mechanism.
where A = (ai,j) is the adjacency matrix of a graph and R p (P i ) is the page rank of the node, β is a constant.
Clustering coefficient
This parameter reflects the fraction of triangles that exist all over existing triangles in the nodes' neighborhood. The mathematical expression for finding clustering coefficient is determined as
where “MP,i” is the number of neighbors associated with the hub P i . Within the equation, it is connected with the number of conceivable sets of neighbors of hub Pi, that is kPi = (kPi − 1)/2, where kPi is the degree of a hub Pi.
Besides these centralities, this article includes another important parameter called clique that plays an important role in increasing the performance of the classifier. A clique is characterized as a completely associated subgraph that implies that each hub has coordinated links to all other hubs within the clique. Ref. 36 details more about this measure that is included in the proposed network. The method of measuring K-Score and K-Shell is discussed in Ref. 37
Other important measures that are used for classifications are neighborhood variability and time stamp centrality. The neighborhood variability is defined as the difference between the set of neighbors that the specific nodes communicate in different time stamps. The neighborhood variability can be calculated in three important methods such as transmitted neighborhood variability (TNV), received neighborhood variability (RNV), and general neighborhood variability.
TNV considers a set of neighbors to which the given node was sending messages. RNV looks at a set of neighbors from which the given node had been receiving messages. General neighborhood variability uses a set of neighbors with which the node communicates, without distinguishing between sending and receiving messages. The Jaccard coefficient was used for calculating the difference between sets, so the coefficient takes values between 0 and 1, where 0 means totally different sets and 1 means identical sets. The Jaccard coefficient was calculated for a particular time duration of 10 seconds. Furthermore, a neighborhood variability was calculated as an average Jaccard coefficient for each node based on time intervals (10 seconds). This parameter is also used to determine the activeness of the nodes in the networks.
To determine the neighborhood variability, time stamp centrality is considered to be the most important parameter. The time stamp is the time duration taken by the nodes to transmit and receive the messages. The mathematical expression to determine the time stamp is given as follows:
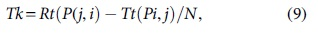
where
Summary of features used for the proposed classification
RNV, received neighborhood variability; TNV, transmitted neighborhood variability.
Data labeling methodology
To make an effective labeling process since these inputs are given as the inputs to the deep learning models, this article uses the advantage of SIR (susceptible infection-recovered models) 38 to analyze the different influential nodes in the networks. The article uses SIR models related to COVID-1939-based widespread models. Normally it splits the networks into three categories such as infectious, recovered, and susceptible. The former nodes can contaminate the neighbors with the IR and also can recover back to normal state with recovery rate. It is a dynamic and random process in which it is used to set the nodes as infections and noninfections. The final outbreak number of infected and recovered hubs and hub with larger outbreak is considered to be more powerful. For different analyses and validation, we have used the IR ranging from 0.1 to 0.8 (even equal to 1).
The main purpose of the research is to identify the influential nodes in the networks using our proposed deep learning models and hence labeling is required to detect the influential hubs. As already mentioned, infected nodes are considered as label 1 and noninfected nodes are named as label 0. Furthermore, this article uses the IR as the important parameter to decide the number of labels.
BED-NETS predictor
In a previous research, 28 many machine learning algorithms were used for an effective classification of influential nodes. As discussed in the Enhanced Centrality Feature Extraction section, a large number of data sets with increasing labels were extracted and will result in overfitting problems during classification that may degrade the performance of the classifiers. Hence this article introduces the new hybrid predictor BED-NETS that is an integration of long short-term memory (LSTM) and boosted machine learning algorithms for better classification of influential nodes. This section discusses about the step-by-step formulation of the proposed classifier.
ADA-boosted algorithm
Freund 39 was first to propose the Ada-boost algorithm that strengthens the weak classifiers. Normally the Ada-boost algorithm strengthens the weak classifiers by updating its weights until classification/prediction accuracy is obtained as maximum. The final model is a strong model when every weak classifier satisfies the performance of it rather than guessing as discussed in Zhang et al. 40 It is not effortlessly overfitted amid preparing, which has been hypothetically clarified and demonstrated in past literary studies. 41 The pseudo code for the Ada-boost algorithm that is used in the proposed network is explained hereunder.
Recurrent neural networks: an overview
As mentioned in Kermack and McKendrick, 37 in artificial neural network (ANN), the unseen layer of each neural network is combined with the unseen layers of other neural networks between the nodes. But according to recurrent neural network (RNN), the same hidden layer nodes are connected. One of the important characteristics of RNN is that it can efficiently learn the time series data because it has the ability to encrypt the earlier data into the process of learning in the existing concealed layer. In RNN methodology, 42 the direct form of graphs can be formed by nodes along with its sequences. Hence dynamic behavior can be exhibited for time of sequences. This uses internal memory (state) for the process of sequences of input. So RNN utilizes past data for the prediction of future values. If the interval time between past data and current data for prediction is large in practical applications, then this methodology is not able to memorize past data significantly, so there still is a vanishing gradient problem, 43 hence the predicted outcomes are not satisfactory in some real-time scenario. To overcome this issue, RNN performance has been enhanced and LSTM network has been introduced.
LSTM: an overview
An LSTM network is the combination of RNN with LSTM units. The LSTM network comprises cell, input, output, and forget gates. Cells are denoted as LSTM recollection blocks to reminisce the values over the time intervals. Let “xt” the unseen layer output is “ht” and its former output is “ht−1,” the cell input state is “Ct,” the cell output state is “Gt” and its former state is “Gt–1,” the three gates' states are
The input gate is given as
The forget gate is given as
Output gate is calculated as
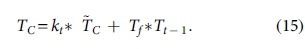
Cell input is given as
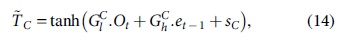
where
Also hidden layer output is calculated and is given as
Numerous LSTM units are concentrated in building the single layer of LSTM. To each unit, the operations are computed in one-time index and the output is handed over to the next LSTM unit. As the data increase, 34 the layers of LSTM also increase, which may degrade the performance of the LSTM network. Hence this article introduces the hybrid boosted LSTM models.
Ensembled boosted LSTM models
Figure 3 shows the ensembled boosted LSTM models used for predicting the influential nodes in the networks. We normally use the Ada-boost to train the LSTM predictors for every iteration of n, and all n-LSTM predictors are combined to form one strong predictor.

Architecture for the proposed LSTM model used for influential node prediction. LSTM, long short-term memory.
The proposed boosted LSTM models works in six major steps. First, LSTM network is trained with the group of input centrality features. The output expression from the LSTM predictor is calculated by Equation (16). The threshold predictor value is set (in accordance with thumb rule) and compared with the output from the LSTM predictor to calculate the error function. The error function can be calculated by the following expression:
If the error value is large, Ada-boost will boost the input weights of the LSTM predictor. At the next iteration, the predicted output will be obtained from boosted weights of LSTM cells. When the error reaches to lesser value after “n” iterations, then all outputs are ensembled to form the new predicted output. Figure 5 shows the pseudo code for complete working of the proposed algorithm.
Experimental Results
To verify the working procedure of the EC-BED-NETS framework, we carried out the experimentation to perceive the exactness of the proposed models with the preparation and testing data from the different benchmark networks (mentioned in Data sets section) along with SIR propagation models. The computer configuration used for conducting the experiments is based on i5 CPU (eighth generation) with 16GB RAM, 2TB hard disk and 8 GB NVIDIA GPU. The hyperparameters used for tuning the proposed algorithms are listed in Table 3.
List of hyperparameters used for training
LSTM, long short-term memory.
The complete model is developed using Keras library that runs on TensorFlow as back end. The performance metrics of the proposed models are calculated by the following mathematical expressions:
As mentioned in table, ∼4567 data were collected from various benchmarks, in which 70% were used for training and 30% were used for testing. The results with various scenarios of IRs are presented in the following section.
Tables 4 to 9 present the performance analysis of the EC-BED-NETS for the various benchmarks and WhatsApp social networks. The accuracy of prediction of the EC-BED-NETS has maintained the accuracy of 0.95 to 0.93 for the various benchmarks with the changes in the IRs and labels. It is found that error of prediction with different rates of infection is low as 0.02, and to prove the efficiency of the proposed algorithm, we have carried out the experimentations with the same network scenario on various existing deep learning algorithms such as E-LSTM, 43 stacked LSTM, 44 and other machine learning algorithms such as Random Forest, Support Vector Machines, and K-Nearest Neighbors (KNN) algorithms.
Performance of the proposed Enhanced Centralities Based on Boosted Ensembled Deep Learning Networks for different benchmarks at infection rate: 0.1
IR, infection rate.
Performance of the proposed Enhanced Centralities Based on Boosted Ensembled Deep Learning Networks for different benchmarks at infection rate: 0.1 @ increase in labels
Performance of the proposed Enhanced Centralities Based on Boosted Ensembled Deep Learning Networks for different benchmarks at infection rate: 0.15 @10 labels
Performance of the proposed Enhanced Centralities Based on Boosted Ensembled Deep Learning Networks for different benchmarks at infection rate: 0.15 @ increase in labels
Performance of the proposed Enhanced Centralities Based on Boosted Ensembled Deep Learning Networks for different benchmarks at infection rate: 0.2 @10 labels
Performance of the proposed Enhanced Centralities Based on Boosted Ensembled Deep Learning Networks for different benchmarks at infection rate: 0.2 @20 labels
Figures 4 to 6 show the comparative analysis between the performance of the proposed EC-BED-NETS and the other learning models. In all the three analyses, the proposed algorithms have maintained the accuracy of 0.95 to 0.94 with increasing IRs, and it clearly shows that the boosting ensemble characteristics implemented in LSTM have proved to be more advantageous, whereas the other existing models have decaying performance such as E-LSTM as 0.9 to 0.8, stacked LSTM as 0.85 to 0.8, SVM with 0.85 to 0.79, KNN with 0.75 to 0.68, and RF as 0.65 to 0.58. Moreover, to authenticate the performance of the proposed technique, we compared the proposed model with other learning models in the integration of more labels and IRs.

Comparative accuracy analysis of different learning models to determine the influential nodes at the IR of 0.1. IR, infection rate.

Comparative accuracy analysis of different learning models to determine the influential nodes at the IR of 0.2.
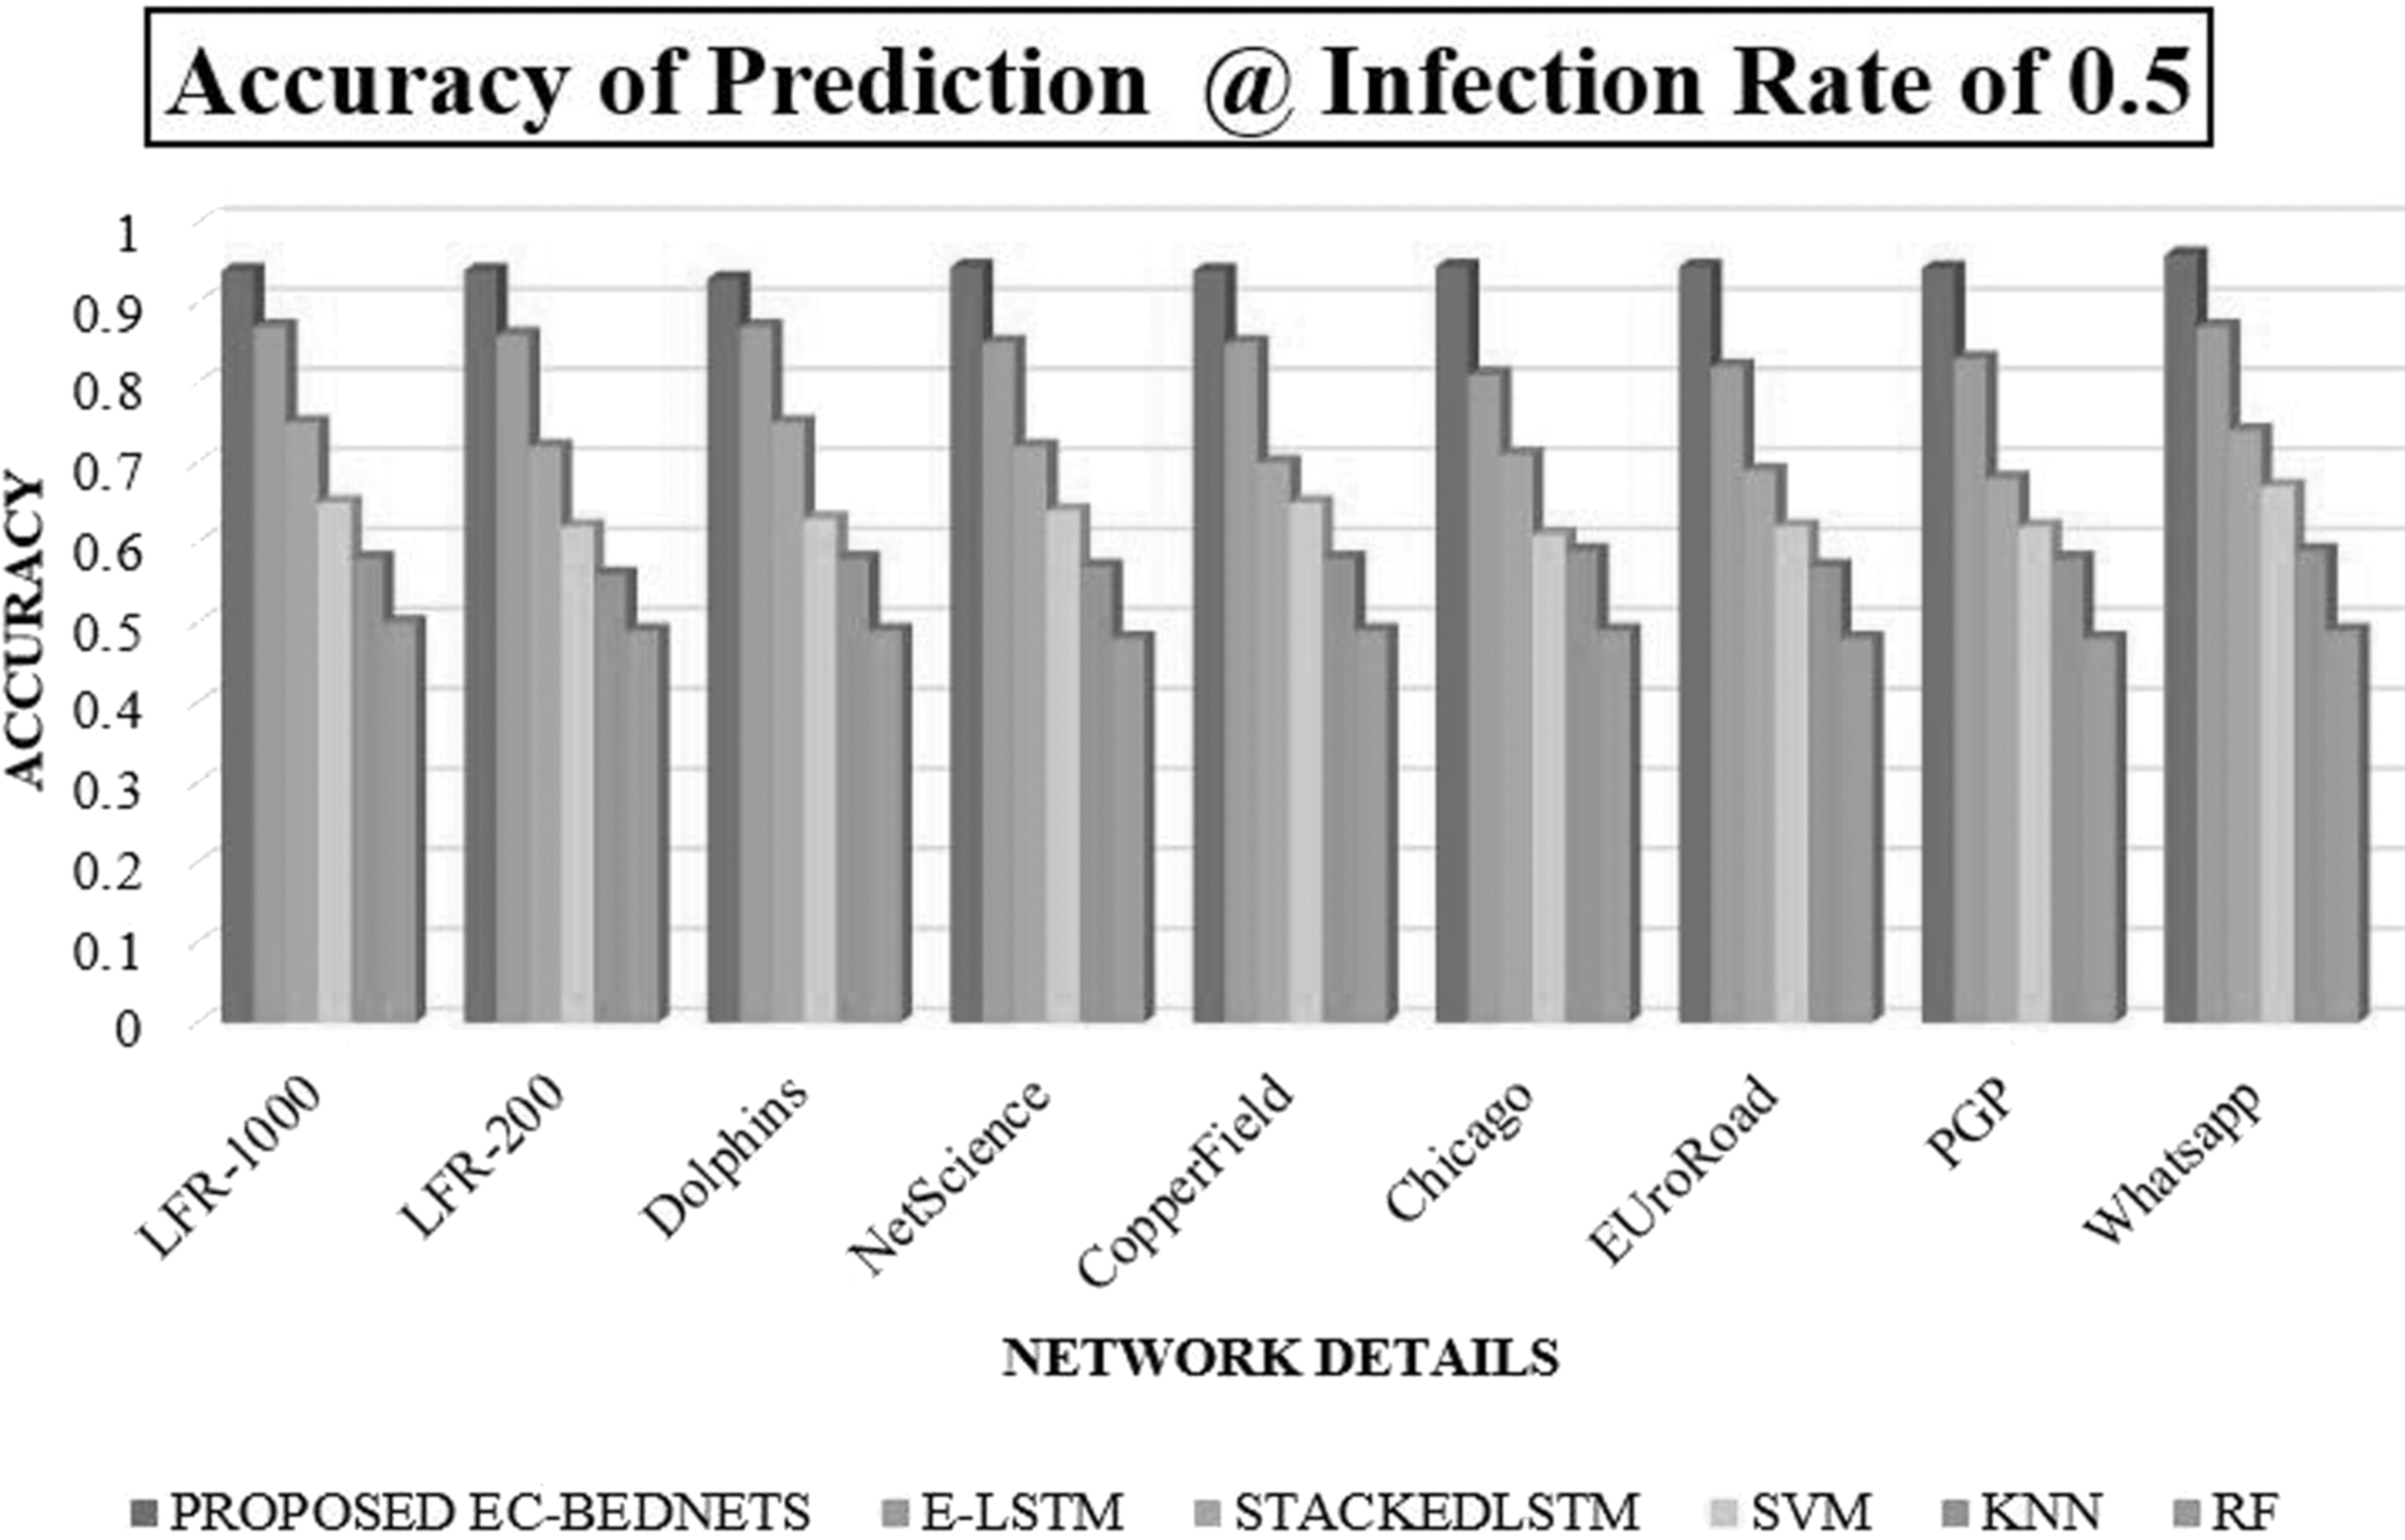
Comparative accuracy analysis of different learning models to determine the influential nodes at the IR of 0.5.
Figure 7 shows the validation analysis of the different learning models with different benchmarks at a high IR >0.5 but equal to 1 (random value is set to 0.8). For validation, we have used the networks with larger edges and social network. For the networks, the accuracy of predicting the influential nodes was maintained from 0.95 to 0.94, whereas the other algorithms have higher rate of differences in the higher order IR and random increase in the labels. The following observation can be made from the mentioned figures: (1) When the labels have least number with high IR (0.8), the proposed algorithms and other learning models exhibit the characteristics with less variations such as the proposed algorithms with 0.95, E-LSTM with 0.88, stacked LSTM with 0.85, and other machine learning models ranging from 0.80 to 0.75. But as the labels increase, the proposed framework exhibits lesser deviations (0.95–0.94), whereas the other algorithms exhibit large deviations. (2) Inclusion of enhanced centrality and boosted structure in the deep learning models has shown greater performances in predicting the influential nodes in all scenarios of testing and validation.
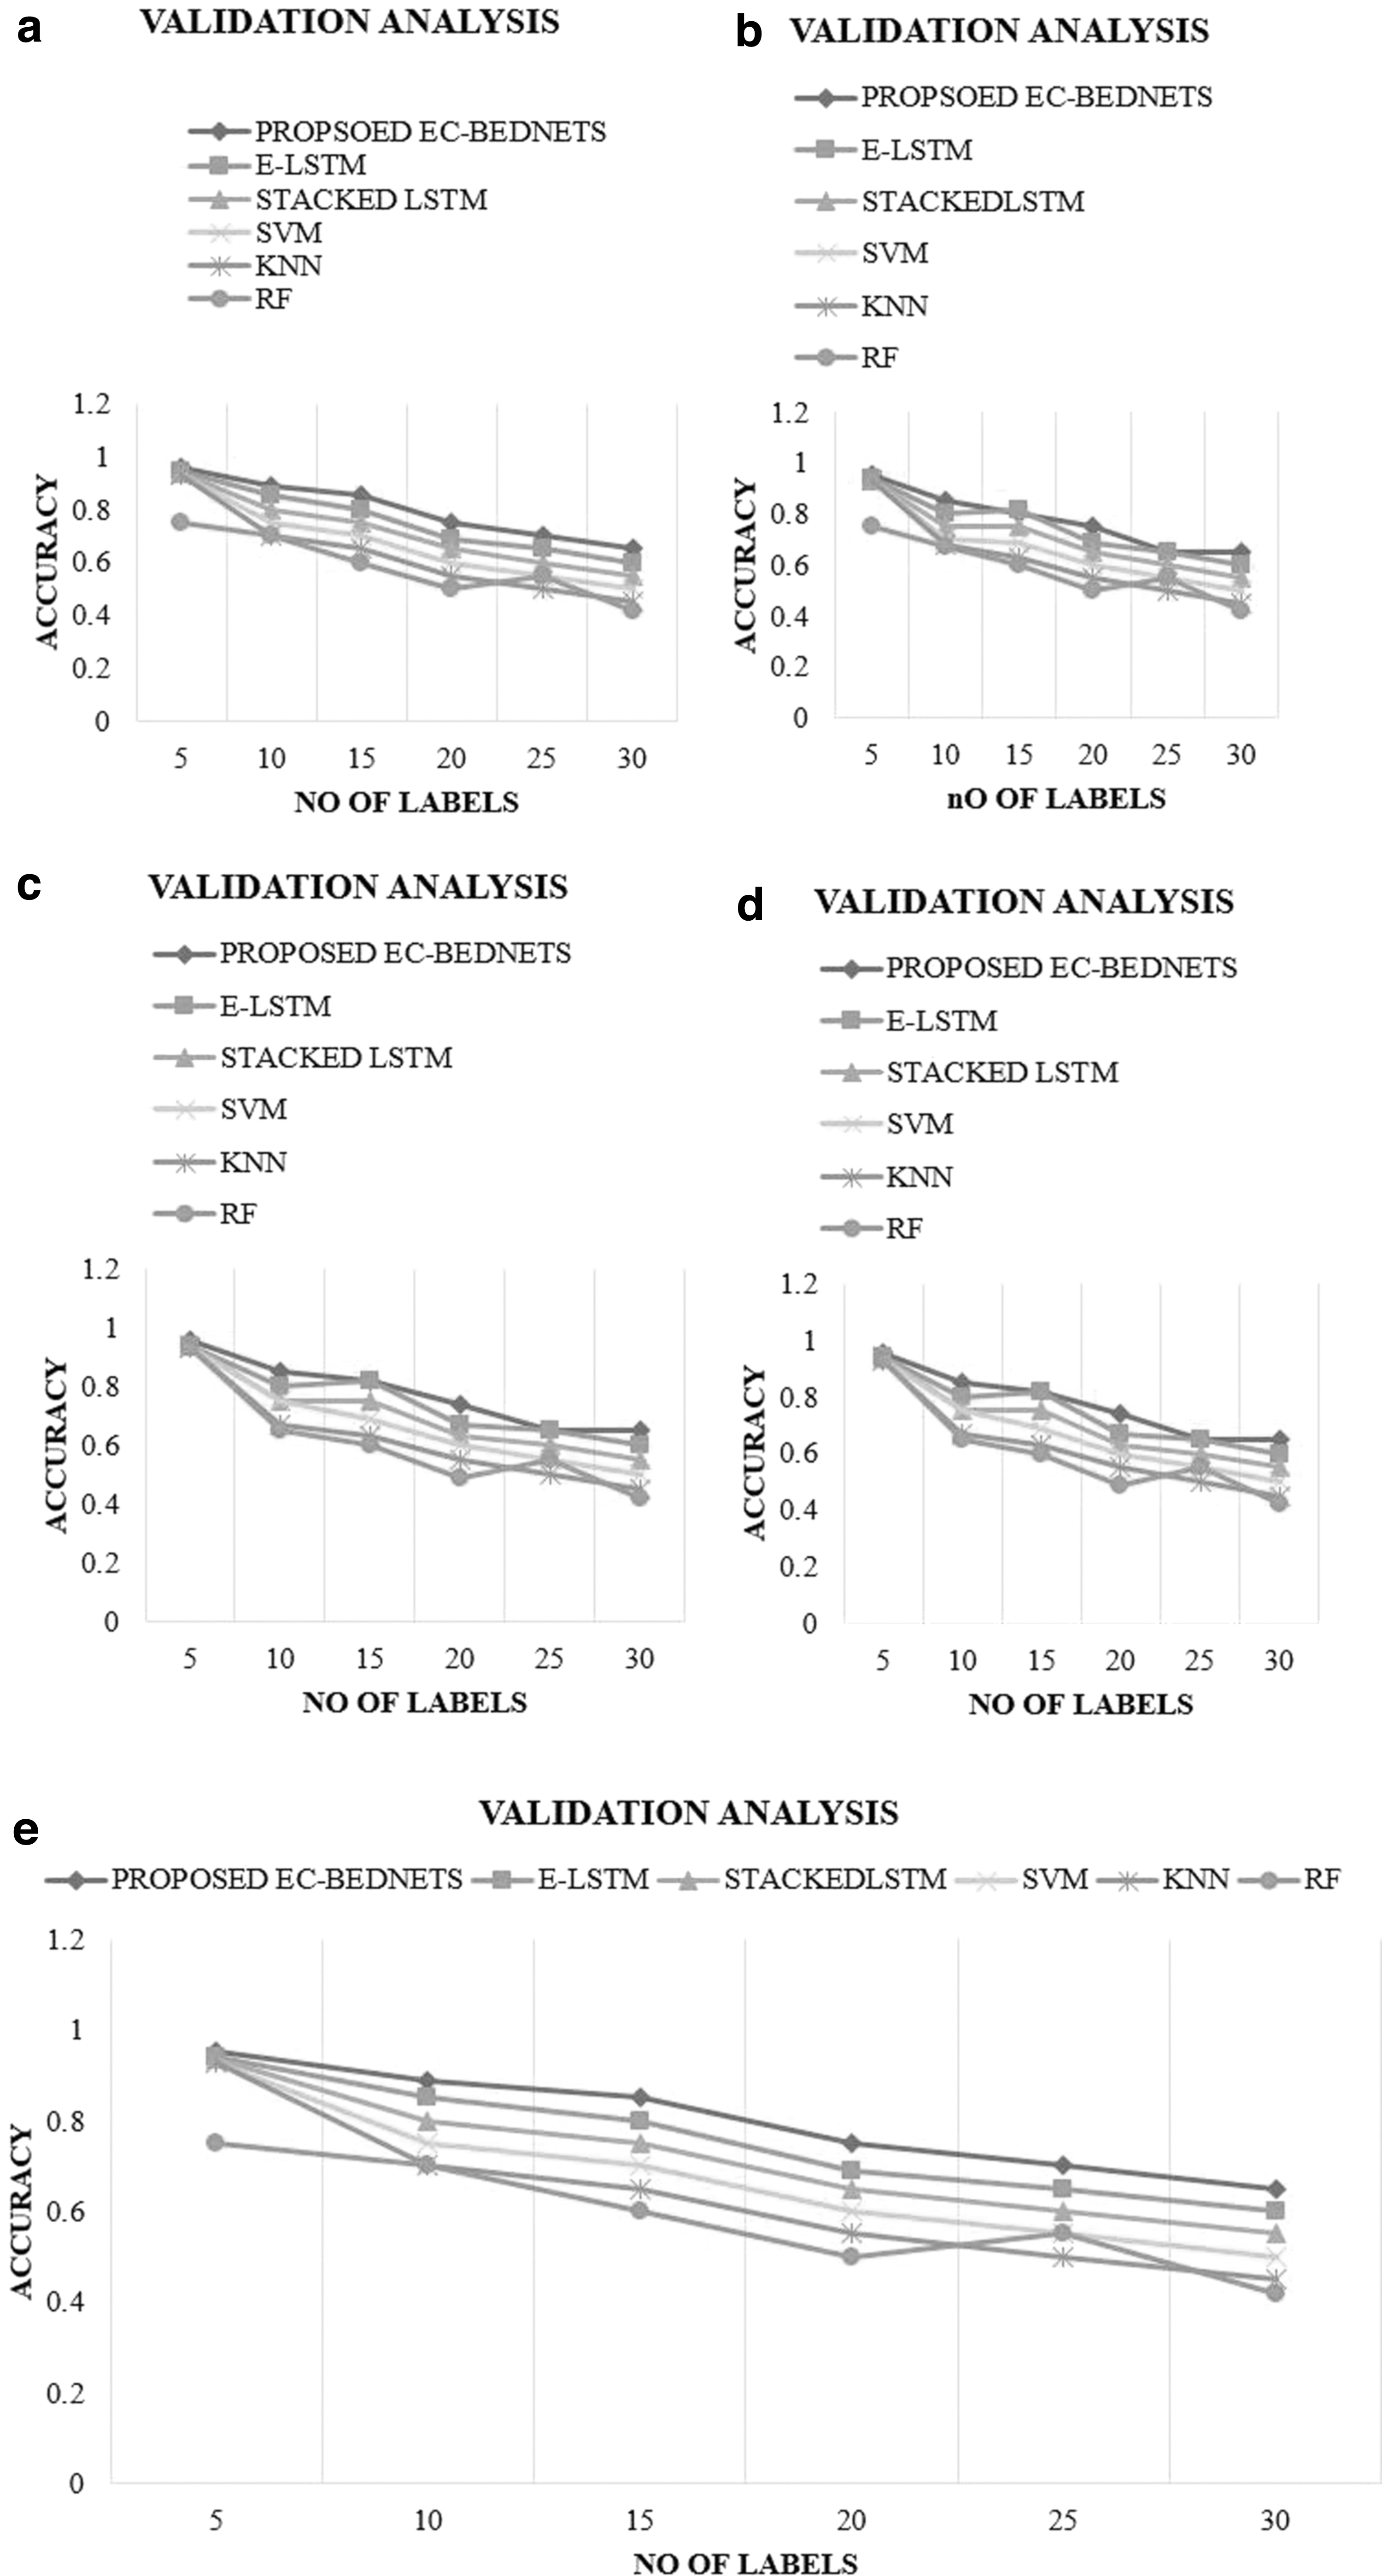
Validation comparison between the different learning models to determine the influential nodes
Thus the proposed EC-BED-NETS frameworks have exhibited better performance in all small scale networks, large scale networks, and even in social networks.
Discussion and Conclusion
To identify the influential hubs in complex networks, traditional algorithms and conventional ML techniques suffer from limitation of performance, scalability, and flexibility in various real-time propagation scenarios. To overcome the mentioned limitation, this article discusses about the unique methodology using hybrid deep learning models. The proposed EC-BED-NETS framework has incorporated several reliant features such as enhanced centrality feature extraction and hybrid ensemble boosted LSTM networks, and uses the SIR propagation model (COVID-19) to differentiate the influential and noninfluential nodes. To assess the importance of our proposed system, this article performed the arrangement of tests in nine genuine world scenarios. The experiment results demonstrate that the performance of the proposed framework has outperformed that of other machine learning and deep learning models in recognizing the influential nodes in complex and social networks. The average prediction of 95.5% is maintained in all real-time scenarios and proves that the proposed framework is the best solution to recognize the infectious nodes in the networks. The prediction of the number of influential nodes is a complex problem, but it has been significantly solved by the proposed EC-BED-NETS framework. But in future usage of bio-inspired optimization algorithms, the performance of the proposed model is still to be improved, and testing in various real-time propagation scenarios will also increase the reliability of the proposed algorithms.
Footnotes
Author Disclosure Statement
No competing financial interests exist.
Funding Information
No funding agency is involved in our research.