
Abstract
Drought is the primary and dominant natural cause of stress on vegetation, and thus, it needs our full attention. Current understanding of drought across extensive spatial measures, around the world, is considerably limited. As case studies to evaluate the feasibility of utilizing space-based solar-induced chlorophyll fluorescence (SIF) across extensive spatial measures, here, we have used data from 2007 to 2017 in Heilongjiang and Jiangsu provinces of China. The onset of the 2015 drought was accompanied by a substantial response of SIF from vegetation in both the provinces; these data were associated with changes in soil moisture, standardized precipitation evapotranspiration index, and emissivity. Our findings suggest that SIF can effectively provide the spatial and temporal progress of drought, as inferred through substantial associations with SIF normalized by absorbed photosynthetically active radiation (related to Φ
Introduction
Drought (water deficit) is a dominant natural stress on vegetation activity and thus requires our attention;1,2 also see Pareek et al. 3 Extreme drought can substantially affect water storage, farming cultivation, ecological land systems, and later cause harmful effects on the evolution of economy and civilization. 4 Specifically, when there is global warming and an expanding demand for water through human activities, drought becomes a serious problem. 5 Conceptually, efficient drought tracking across extensive spatial measures is necessary to solve the problems caused by drought.
Drought is associated with either below-average rainfall or above-average air warming, which remains constant for weeks, years, or even several decades; this has significant consequences for vegetation growth. The prevalence and time span of drought have been increasing over time due to climate change.6–8 Several drought periods are known to have existed within various regions throughout the world, in particular, in north China from 2013 to 2014, 9 in Europe during 2018, 10 in North America from 2011 to 2012, 11 and in temperate areas in Southeast Asia and the Amazon from 2015 to 2016.12,13
The occurrence of intense drought has increased substantially throughout previous decades and had a significant effect on the ecological systems, for example, in southern China.14,15 The major drought after the fall of 2018 resulted in a financial loss of more than 8 billion US dollars in southwestern China. 16 Furthermore, the 2017 drought in Italy caused increased air warming compared with the long-term mean, breaking all previous records. 17
Vegetation attributes, obtained through various remote sensing approaches, have been measured to explore the effects of drought on vegetation. Vegetation indices (VIs), such as leaf area index (LAI), and normalized difference vegetation index (NDVI) obtained from the Moderate Resolution Imaging Spectroradiometer (MODIS) 18 have been used to measure the greenness of crops. Below-normal crop greenness was observed during the 2000–2016 drought period, as measured through NDVI, 19 although there has been a difference of opinion on the crop greenness abnormalities during the 2016 drought period. 20 Analysis of these sensor perceptions is problematic as they are severely induced through sun-sensor geometric variations and atmospheric impacts.21–23
The NDVI employs visible and near-infrared reflections on two edges, referred to as red edges; furthermore, they are responsive to the measure of the so-called green bioenergy over a space-based pixel. 24 These indicators and their related attributes have been extensively employed to explore physiological changes in vegetation.25–27
Space-based assessment of solar-induced chlorophyll fluorescence (SIF) has been available for several years for tracking vegetation worldwide.28–32 SIF is currently being obtained through various space-based devices, such as Global Ozone Monitoring Instrument-2 (GOME-2), 33 Greenhouse gases Observing SATellite,34,35 and the Orbiting Carbon Observatory-2 (OCO-2). 36 These devices have their foundation in several ground-based and satellite analyzing systems.37,38
SIF measurement is based on the fact that a small amount of absorbed energy is released as fluorescence; this fluorescence has two emission peaks at about 685 and 740 nm, 24 recognized as the red and far-red emission bands. For background on all aspects of chlorophyll fluorescence, see chapters in Papageorgiou and Govindjee 39 and Govindjee et al. 40
In any environment, a significant portion of the absorbed photosynthetically active radiation (APAR) is used by the photochemical pathway leading to photosynthesis; the actual values depend on various conditions, including temperature. SIF measurements are sensitive to the fraction of APAR (fPAR). SIF captures photosynthesis changes caused by drought; furthermore, published data show that SIF was more sensitive to plant physiological variations.41,42 The space-based SIF information is highly useful in assessing photosynthesis on local as well as on a worldwide scale. 43 SIF has been utilized for agriculture fidelity over different crop canopies to observe changes in photosynthesis-related process throughout the day. 44
Furthermore, space-based NDVI can be employed to analyze the association among gross primary productivity (GPP) for exploring the consistency of vegetation.45,46 Gonsamo et al. 47 compared space-based NDVI information over tower-estimated CO2 flux details with FLUXNET. Few years later, Jeong et al. 48 found that the NDVI-derived drought period was longer in duration than flux metrics, indicating an inconsistency in seasonal pattern among vegetation functionality. This inconsistency may be the result of variations in the measurements among space-based and tower metrics 49 ; thus, alternative ways and means are essential to solve these concerns.
Typically, almost 1% of the solar energy acquired through vegetation is retransmitted through chlorophyll as fluorescence (see chapters in Papageorgiou and Govindjee 39 and Govindjee et al. 40 ). Phenology-based studies on leaf canopies show a clear association between SIF and photosynthesis.50,51 Both SIF and GPP are associated with the light absorption process of photosynthesis, 52 and space-based SIF is considered to be the direct reflection of photosynthetic action. Consequently, we must attempt to associate information from space-based SIF data with GPP for validating the seasonal changes in vegetation at the study areas.
The rate of losses in vegetation productivity by drought has been increasing during the past 30 years; furthermore, more than 30 drought cases have been observed once every 2 years during the past 60 years in Heilongjiang province of China. 53 Concurrently, drought rates also showed a rising trend throughout this province. Similarly, there are records of drought events in 13 areas in Jiangsu province of China. It is important to note that, in this province, the water deficit has been above 60%. 54 During June 2011, the affected regions of crops were 401 thousand hectares in Jiangsu, and the direct economic loss was of 1.35 billion Yuan (www.stats.gov.cn).
Furthermore, increases in the frequency and intensity of drought in Heilongjiang and Jiangsu might damage vegetation yield and thus the entire agricultural sector. The spatial and temporal attributes of the agricultural drought hazard in both the provinces were assessed. In our study, we have detected drought conditions over both the provinces during the summer months for 11 years from 2007 to 2017 through measurements of soil moisture (SM), standardized precipitation evapotranspiration index (SPEI), and emissivity (which provides information on the atmospheric column water vapor and lower boundary air surface temperature).
In addition, we have analyzed the impact of drought on vegetation growth through LAI, SIF, SIF normalized by APAR (
Data and Methods
Study area
Heilongjiang province is located between 121°130′–135°05′E in longitude and 43°22′–53°24′N in latitude (Fig. 1a). This northern province of China has an area of 454,000 km2 and a population of more than 38.17 million people. The yearly temperature in Heilongjiang has been between −4 and 4°C, and the annual precipitation has averaged over 500–600 mm. In this province, the mountainous regions account for 59% of the land. Referred to as the “Great northern granary,” Heilongjiang province produced more than 43.5 million tons of grain in 2009 from 2.85 million ha of agricultural land. The entire province is situated in the mid-temperate climate zone and is prone to drought.

Distribution of dominant vegetation types in Heilongjiang province
Jiangsu province is located in the eastern part of China within the longitudes 116°18′–121°57′ E and the latitudes 30°45′–35°20′ N covering an area of around 100,000 km2 (Fig. 1b). Water bodies, grasslands and hills, and mountains, respectively, make up 16.8%, 68.0%, and 14.3% of the entire territorial province. The typical yearly precipitation ranges between 550 and 1450 mm, which is highest in the summers. Its population of 78.5 million inhabitants makes Jiangsu province the most densely populated territory in China (www.stats.gov.cn). The most severe drought recorded in the past 50 years was in 2011. 55 This damaging effect led to an increased interest in the tracking and evaluation of the ecosystem resulting from drought activity.
Data
Moisture calculation in soil and SPEI
To assess the impact of distinct drought events on vegetation development in Heilongjiang and Jiangsu, SM at 0.25° soil information ESA CCI SM v04.4 was used in our study. To detect the effects of drought patterns on vegetation development, SM resources were assessed during 2007–2017. SM data indicate precipitation irregularities, and we used them to represent the spatial anomalies of drought in both Heilongjiang and Jiangsu provinces.
Vicente-Serrano et al. 56 had already considered SPEI for comparing evapotranspiration variables with temperature. SPEI has numerous advantages in drought detection, and thus, it was used in our present study. The monthly SPEI information was acquired at a spatial resolution of 1° × 1° by using an SPEI global drought monitor. To fit and equalize the spatial resolution of additional information, all the data were incorporated into the latitudinal dimension of 0.5° × 0.5°. Furthermore, SPEI was used in Heilongjiang and Jiangsu provinces for assessing the past scarcity of water and severity and their associations to the drought.
Data products of MODIS
We utilized MODIS data products, which included emissivity, GPP, fPAR, surface reflectance, LAI, and NDVI (https://lpdaac.usgs.gov). The MOD17A2H (V6) GPP, an 8-day composite of scales through a 500-meter (m) pixel size, was used to explore the water cycle processes of the vegetation. Furthermore, the MOD21A2 (V6) of MODIS, an 8-day composite data set, was used to acquire emissivity from the MODIS thermal infrared bands through the optimal water vapor scaling atmospheric correction pattern. Reflectance-grounded vegetation directories, including LAI and NDVI, were employed to assess the response of drought during vegetation growth. The MCD15A2H (V6) of MODIS, Level 4 of the composite data set, was used to derive LAI. The 500-meter pixel size LAI data set was utilized to acquire the one-sided green leaf area per unit ground area in broadleaf canopies during the period from 2007 through 2017. The NDVI-MODIS product was used from MOD13A3 (V6) to understand the drought-related vegetation growth conditions.
GOME-2 solar-induced chlorophyll fluorescence
In this study, we have utilized information (Level 3, V28) (https://avdc.gsfc.nasa.gov), provided through the GOME-2. MetOp-A/B was associated through GOME-2 programs that have an equator passage spell at 09:30 a.m. In the spectral range of 600–800 nm, GOME-2 provided radiance of about 740 nm and was used for SIF through the principal component analysis method, as performed by Joiner et al.
57
and Frankenberg and Berry
58
More than 50% was lost when going through a cloud segment, as shown by Köhler et al.
59
SIF responses were combined with data from monthly resources at 0.5° × 0.5° and a minimum of five SIF retrievals in 30 days were obtained. Here, we investigated this robust association between SIF and VIs through the vegetation composition. We characterize this as shown below
60
:
where
Results
Interannual anomalies in SM, SPEI, and emissivity
We initially considered the interannual anomalies of the SM, SPEI, and emissivity within Heilongjiang and Jiangsu provinces for the summer periods during 2007–2017, as shown in Figure 2. In both Heilongjiang and Jiangsu, SM, SPEI, and emissivity indicate significant interannual dissimilarities. In June, for all the years (2007–2017) examined, SM remained higher than the mean in Heilongjiang than in Jiangsu. In comparison to SM and emissivity, negative SPEI anomalies were noted in 2007, 2008, 2010, and 2013 for Heilongjiang province, and in 2010, 2012, 2013, 2014, 2015, and 2017 for Jiangsu province. In July 2011, the mean values of SPEI and emissivity remained lower in Heilongjiang than in Jiangsu. All these three (SM, SPEI, and emissivity) parameters show a drought-associated reduction in 2015 compared with those during 2007–2017 in both the provinces during the vegetation growth. Consequently, we focused on the drought case in the summer 2015 for further analysis.
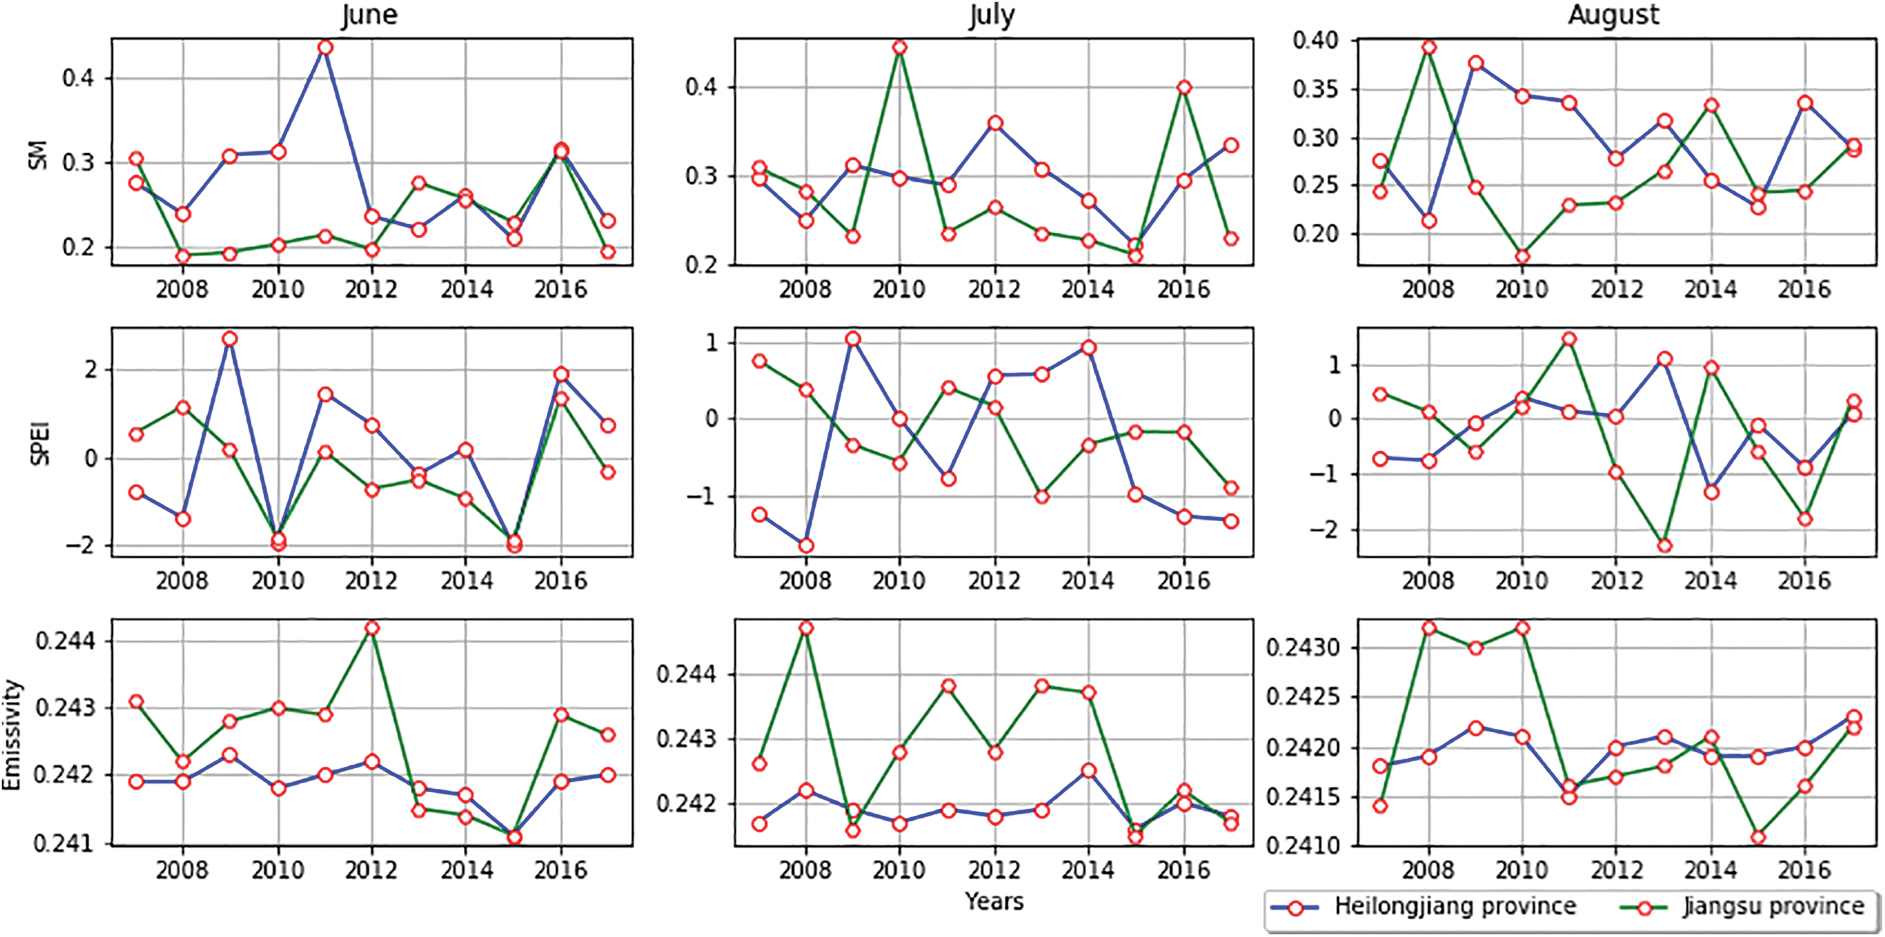
Interannual changes of SM, SPEI, and emissivity for the summer (June–August) periods during 2007–2017 in Heilongjiang and Jiangsu. SM, soil moisture; SPEI, standardized precipitation evapotranspiration index. Color images are available online.
Spatial distributions of SM, SPEI, and emissivity during 2015 drought in Heilongjiang
The monthly spatial allocation of the SM, SPEI, and emissivity in Heilongjiang was acquired, in 2015, from June to August (Fig. 3). Generally, the spatial allocation of the SM fluctuated with increases and decreases in the monthly SPEI. SM in the northern region of Heilongjiang province, during the month of June, had severely decreased since there was no precipitation for 2 months before it. This change is indicated much more clearly in SM mapping during July and August, as the measures change from −0.05 to 0.02
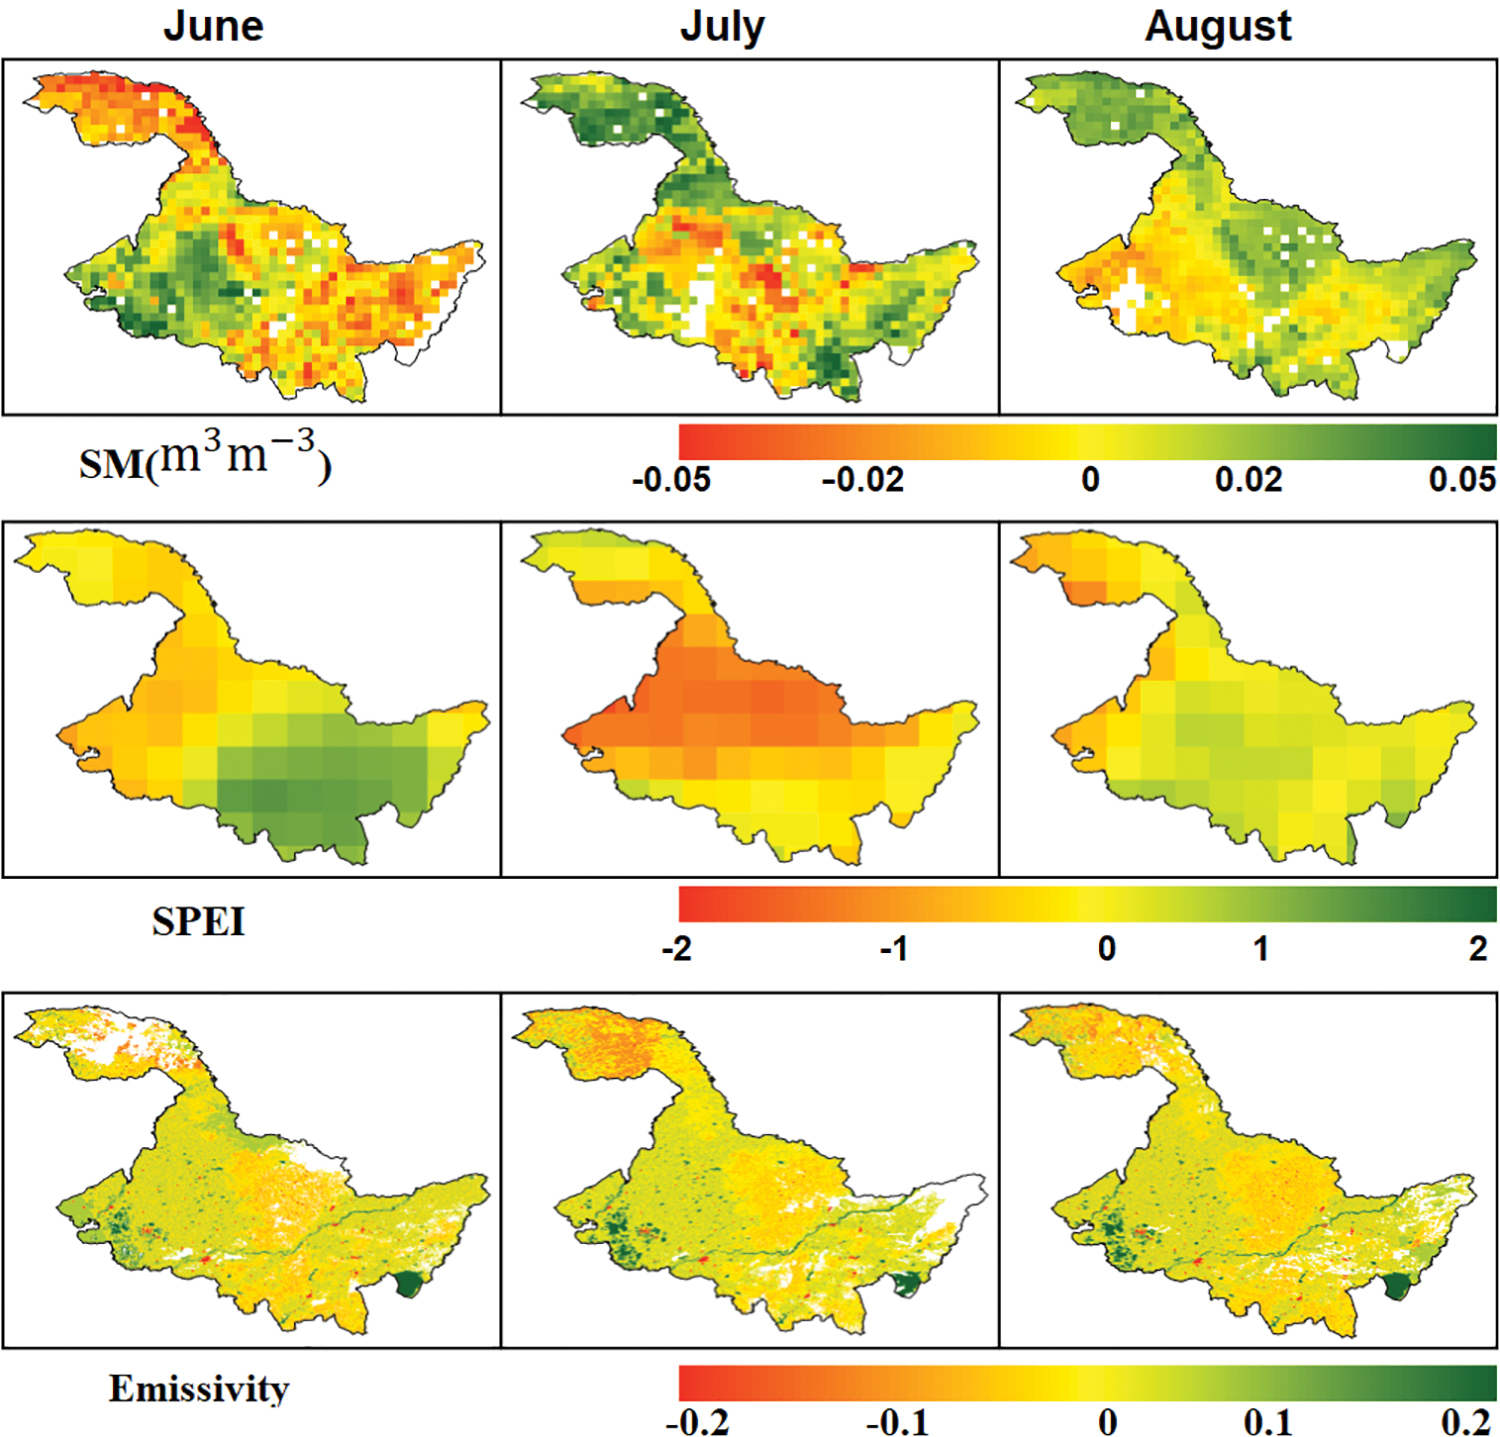
The spatial distribution of the anomalies in SM, SPEI, and emissivity in Heilongjiang during the 2015 summer (June–August) period. Color images are available online.
The response of the SPEI transit over the zero-scale range reflected a dry-wet state during August in Heilongjiang. Additionally, the occurrence of the drought was higher in the central regions of the province during July. The spatial SPEI increased slightly in June but declined in July. The observed emissivity during the summer drought decreased as the time scale increased. The frequency of emissivity in June and August was within 15%–25%, and the frequency in July in the eastern part of Heilongjiang was less compared with that in the northern region of this province.
Spatial distributions of SM, SPEI, and emissivity during 2015 drought in Jiangsu
The spatial distributions of the SM, SPEI, and emissivity in Jiangsu, acquired from June to August 2015, are shown in Figure 4. The SM anomaly indicates less variation with less amplitude in the summer months, where the average SM anomaly was 0.02
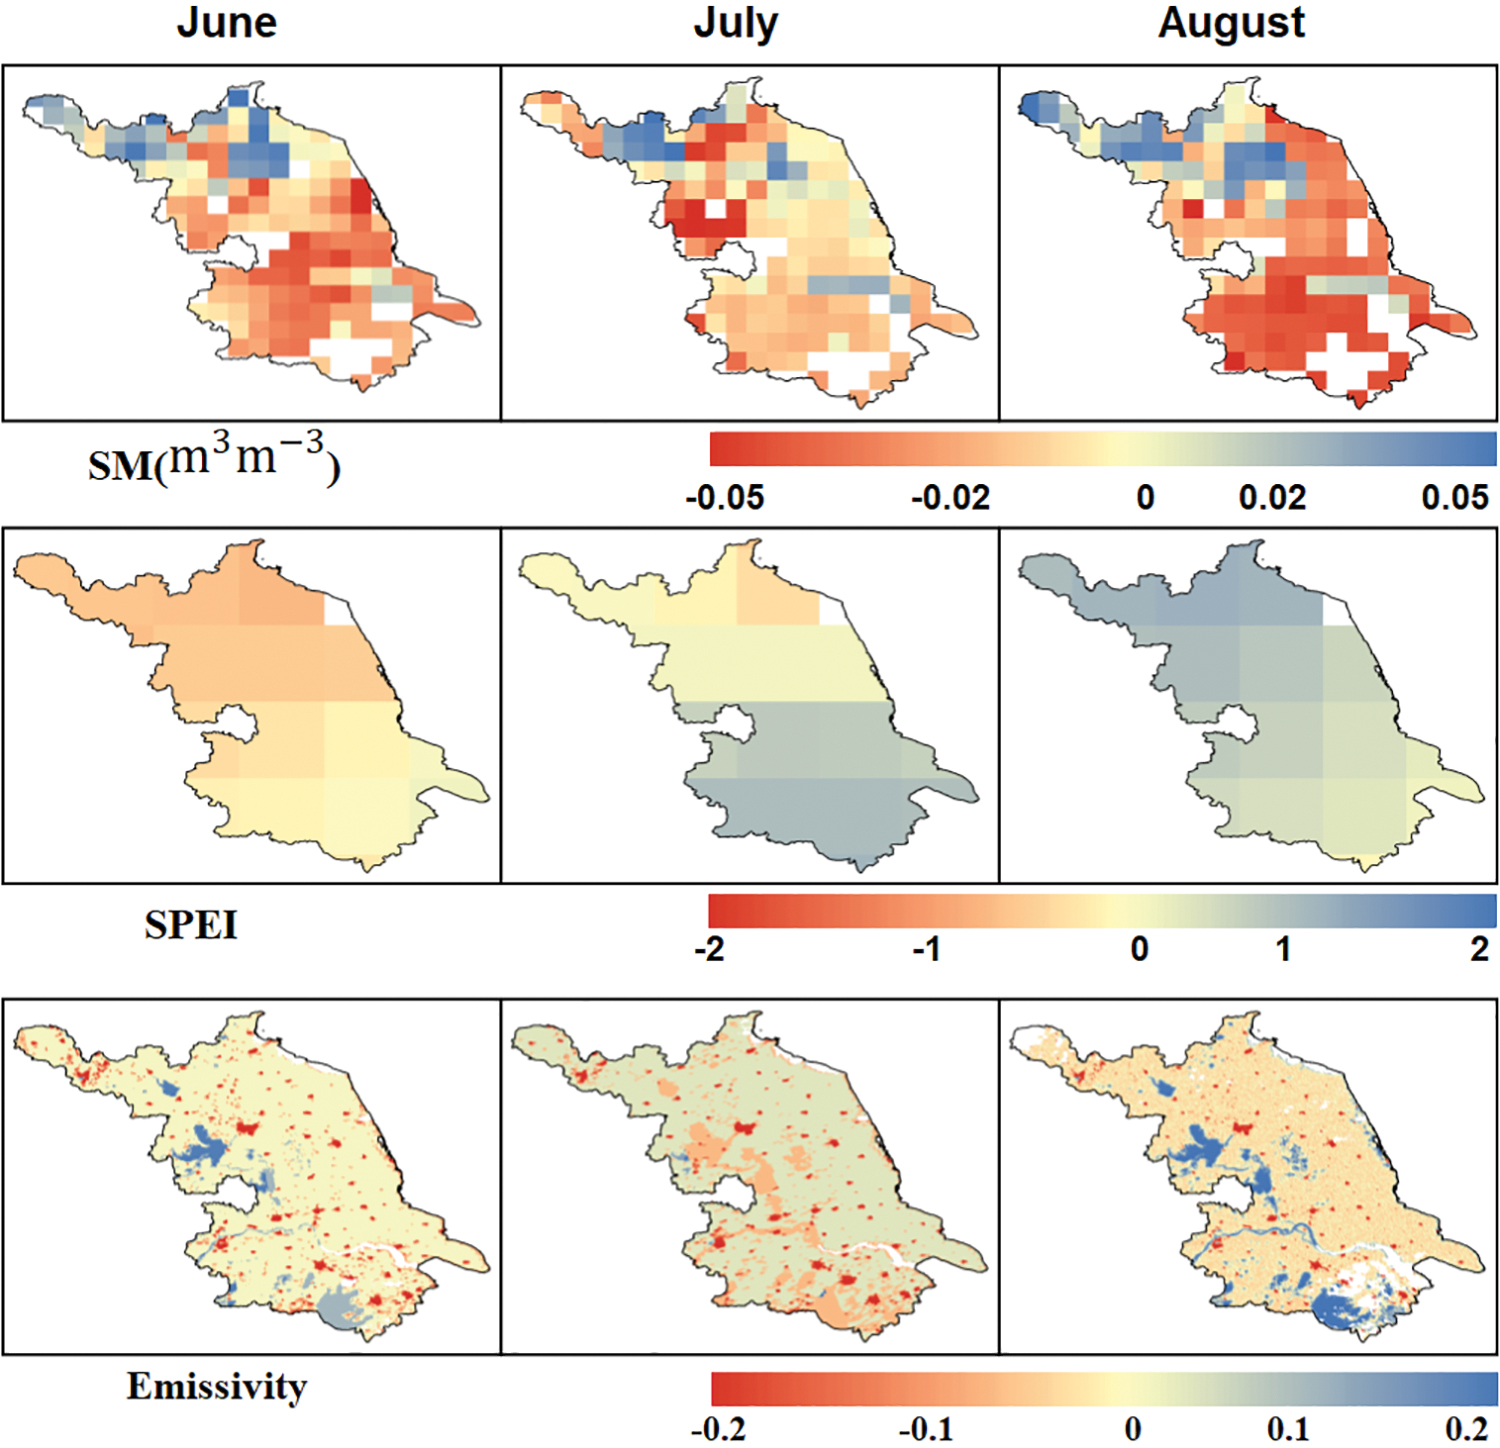
The spatial distribution of the anomalies of SM, SPEI, and emissivity in Jiangsu during the 2015 summer (June–August) period. Color images are available online.
The majority of the province during June showed low SPEI (e.g., between −1 and 1 [80%] in the north and northwest areas of Jiangsu). For the central regions of the province and some regions in the south, SPEI ranged between 1 and 2 during July. There were some regions with SPEI exceeding 1 throughout August, compared with that in June. Especially, emissivity data for July showed negative anomalies when adequate solar radiation was present, and SM changed indicating significant stress in vegetation growth. In August, there was a lower correlation than in June, which further indicates that a summer drought had occurred in Jiangsu province.
Interannual anomalies in LAI, SIF,
,
, and NDVI
The interannual anomalies of LAI, SIF,
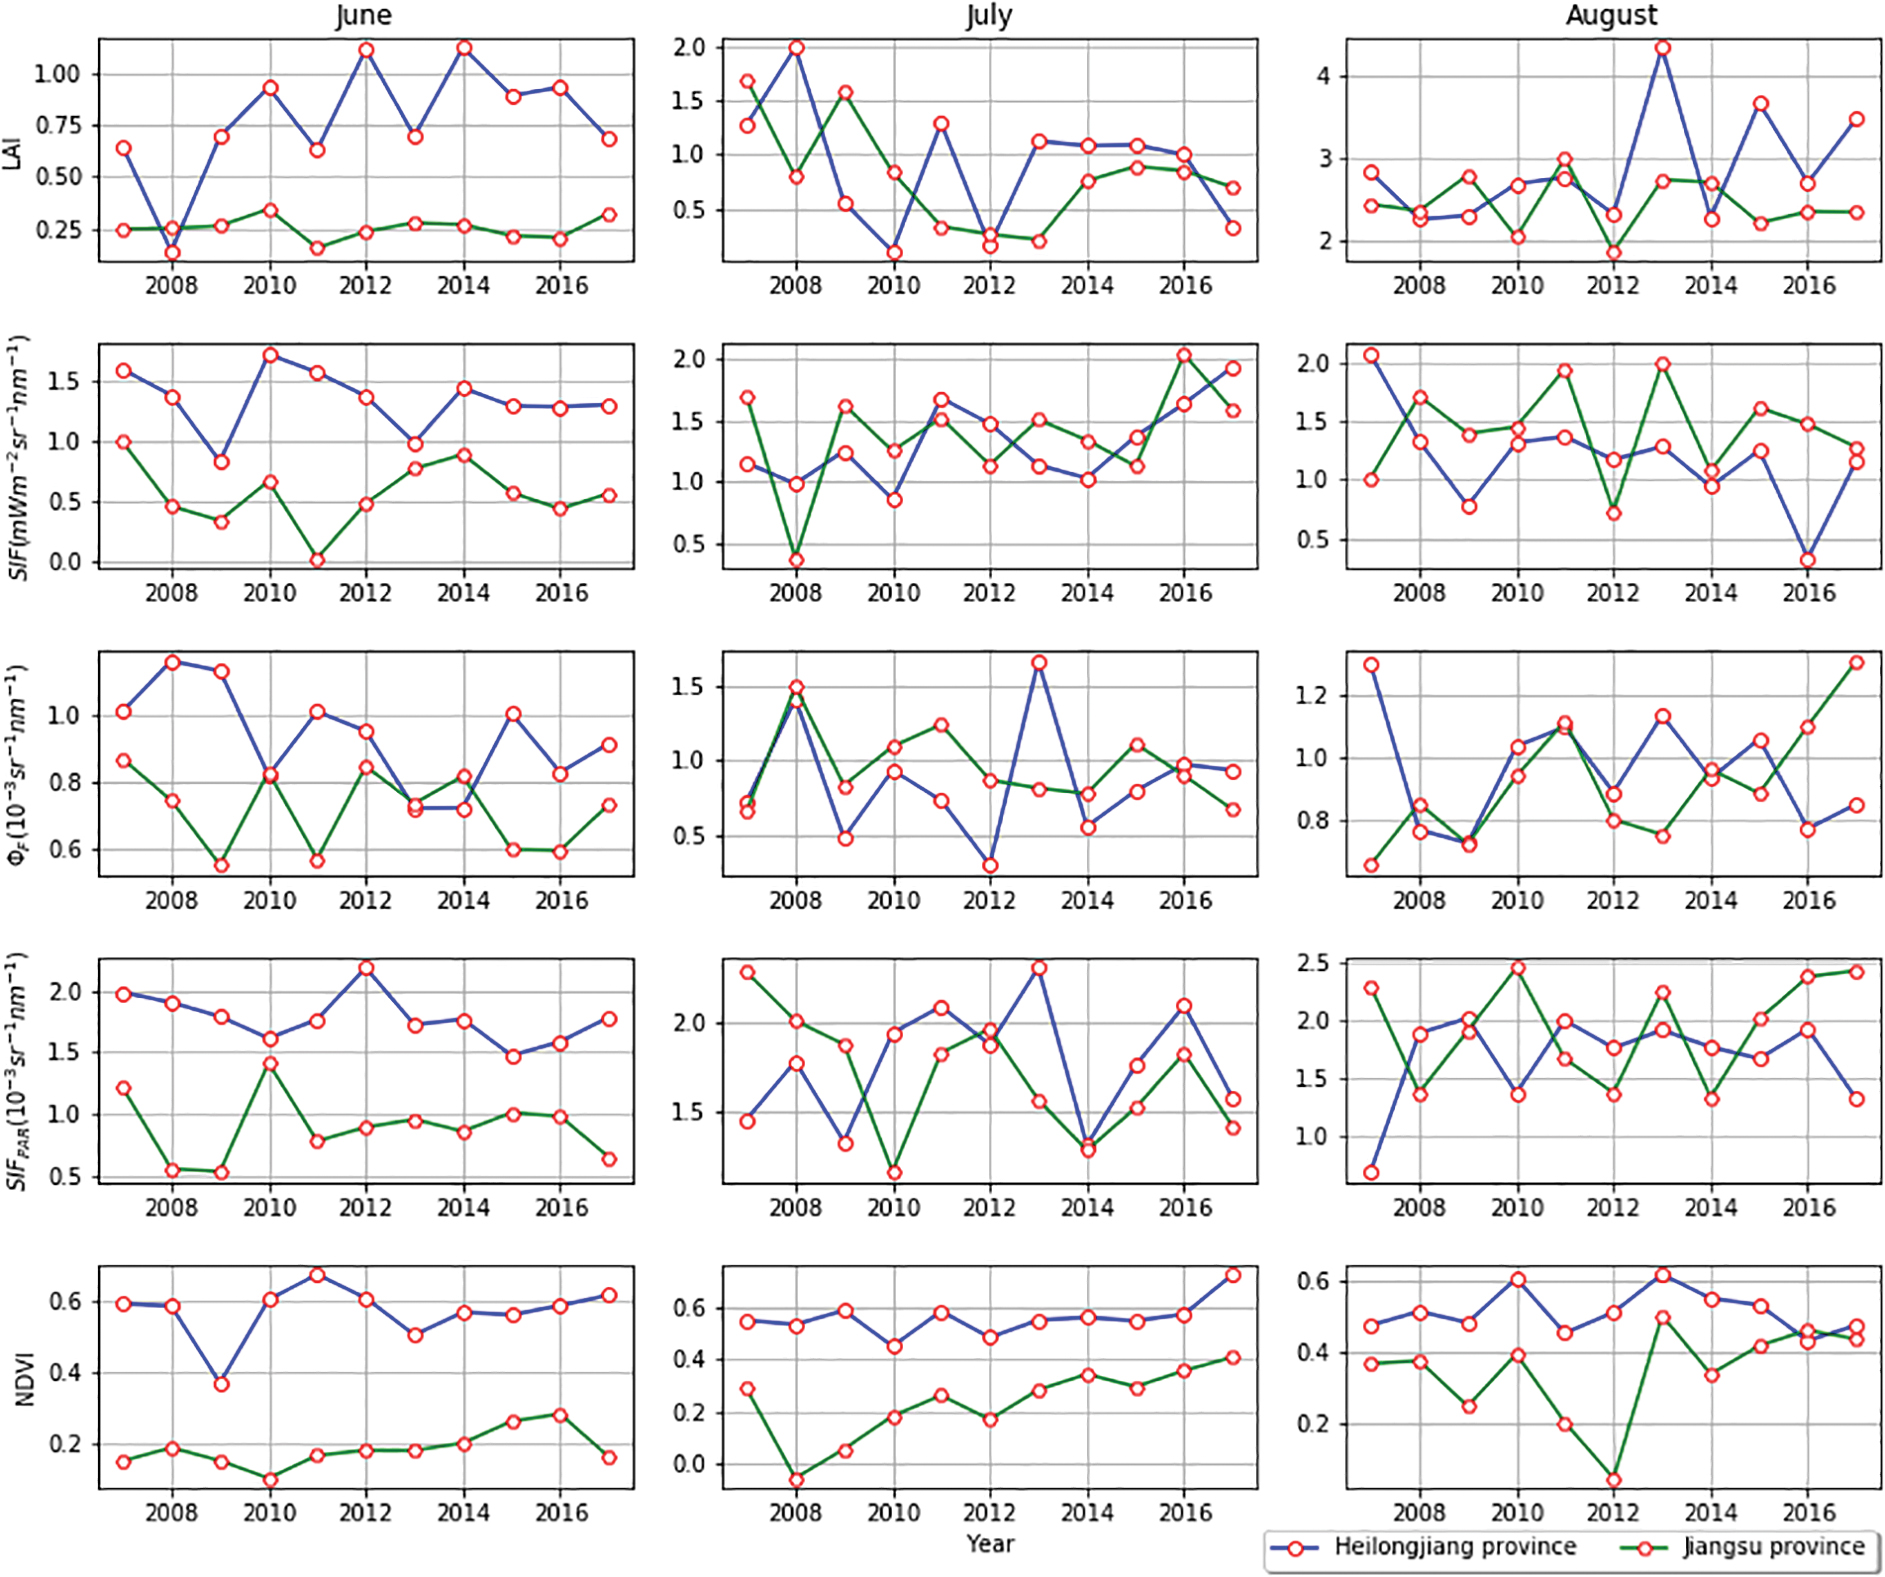
Interannual changes of LAI, SIF,
While drought expanded through the province, LAI and NDVI showed a moderately poor response to drought in July. However, SIF,
Spatial distributions of LAI, SIF,
,
, and NDVI during 2015 drought in Heilongjiang
The spatial distribution of LAI, SIF,
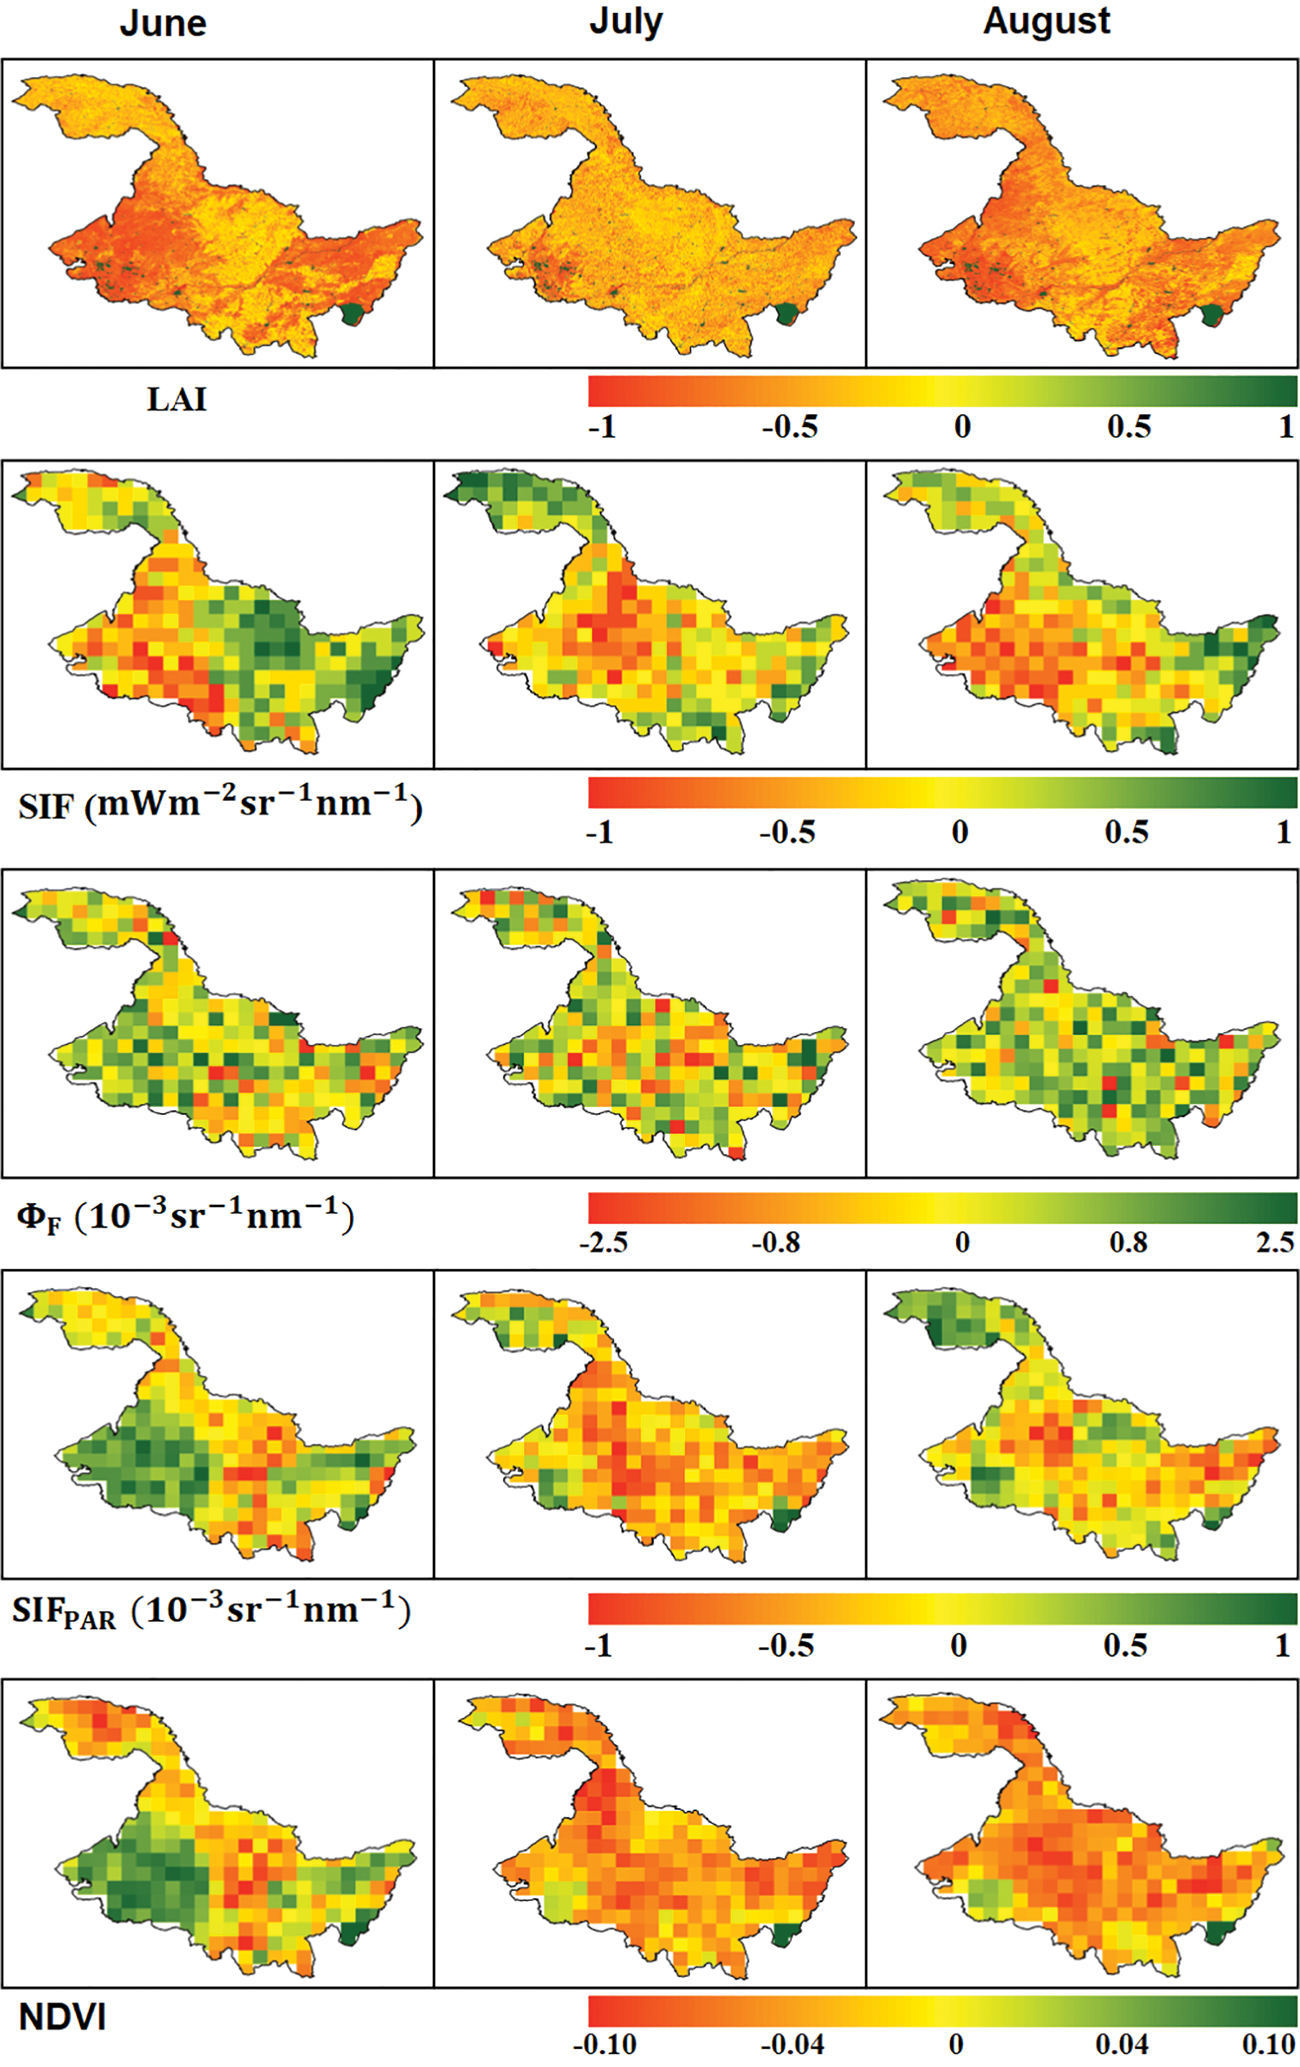
The spatial distribution of the anomalies of LAI, SIF,
The major part of the province shows positive anomalies of LAI and NDVI in June at the onset of the drought. However, 60%–70% of this province had positive SIF,
In contrast, only 32% and 9% of the province showed slight and severe LAI loss. The greater part of Heilongjiang experienced drought, as indicated through data on LAI,
Spatial distribution of LAI, SIF,
,
, and NDVI during 2015 drought in Jiangsu
The spatial distribution of LAI, SIF,
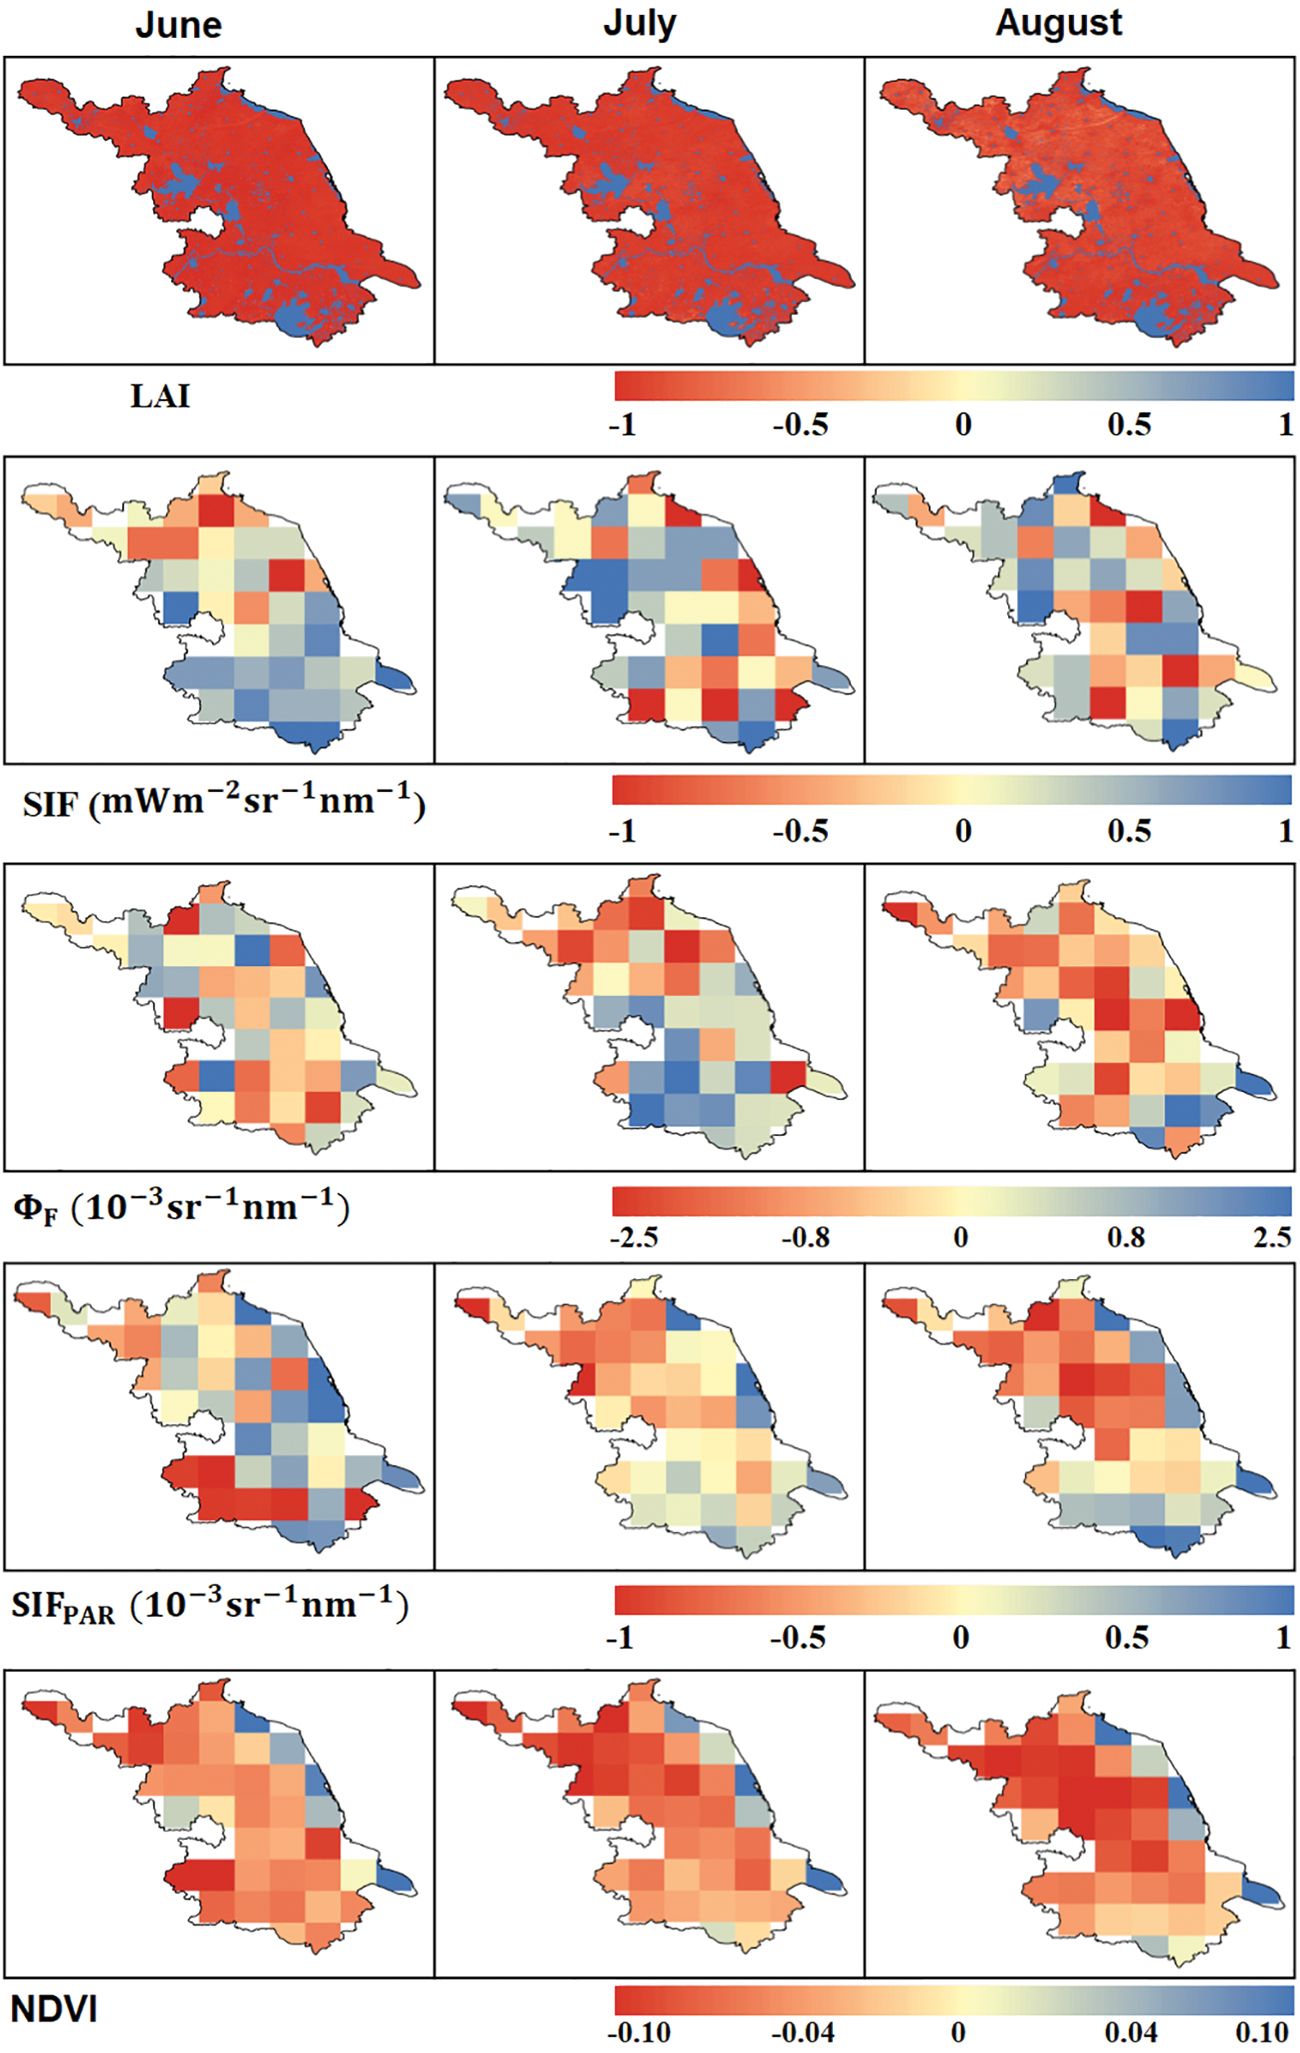
The spatial distribution of the anomalies of LAI, SIF,
The mean of
However, most of Jiangsu province exhibited negative NDVI anomalies in July. As the drought extended, around 75% of Jiangsu province was affected, as identified through changes in SIF,
Correlation of SM, SPEI, and emissivity with LAI, SIF,
,
, and NDVI
Figure 8 shows the correlation of SM, SPEI, and emissivity with LAI, SIF,
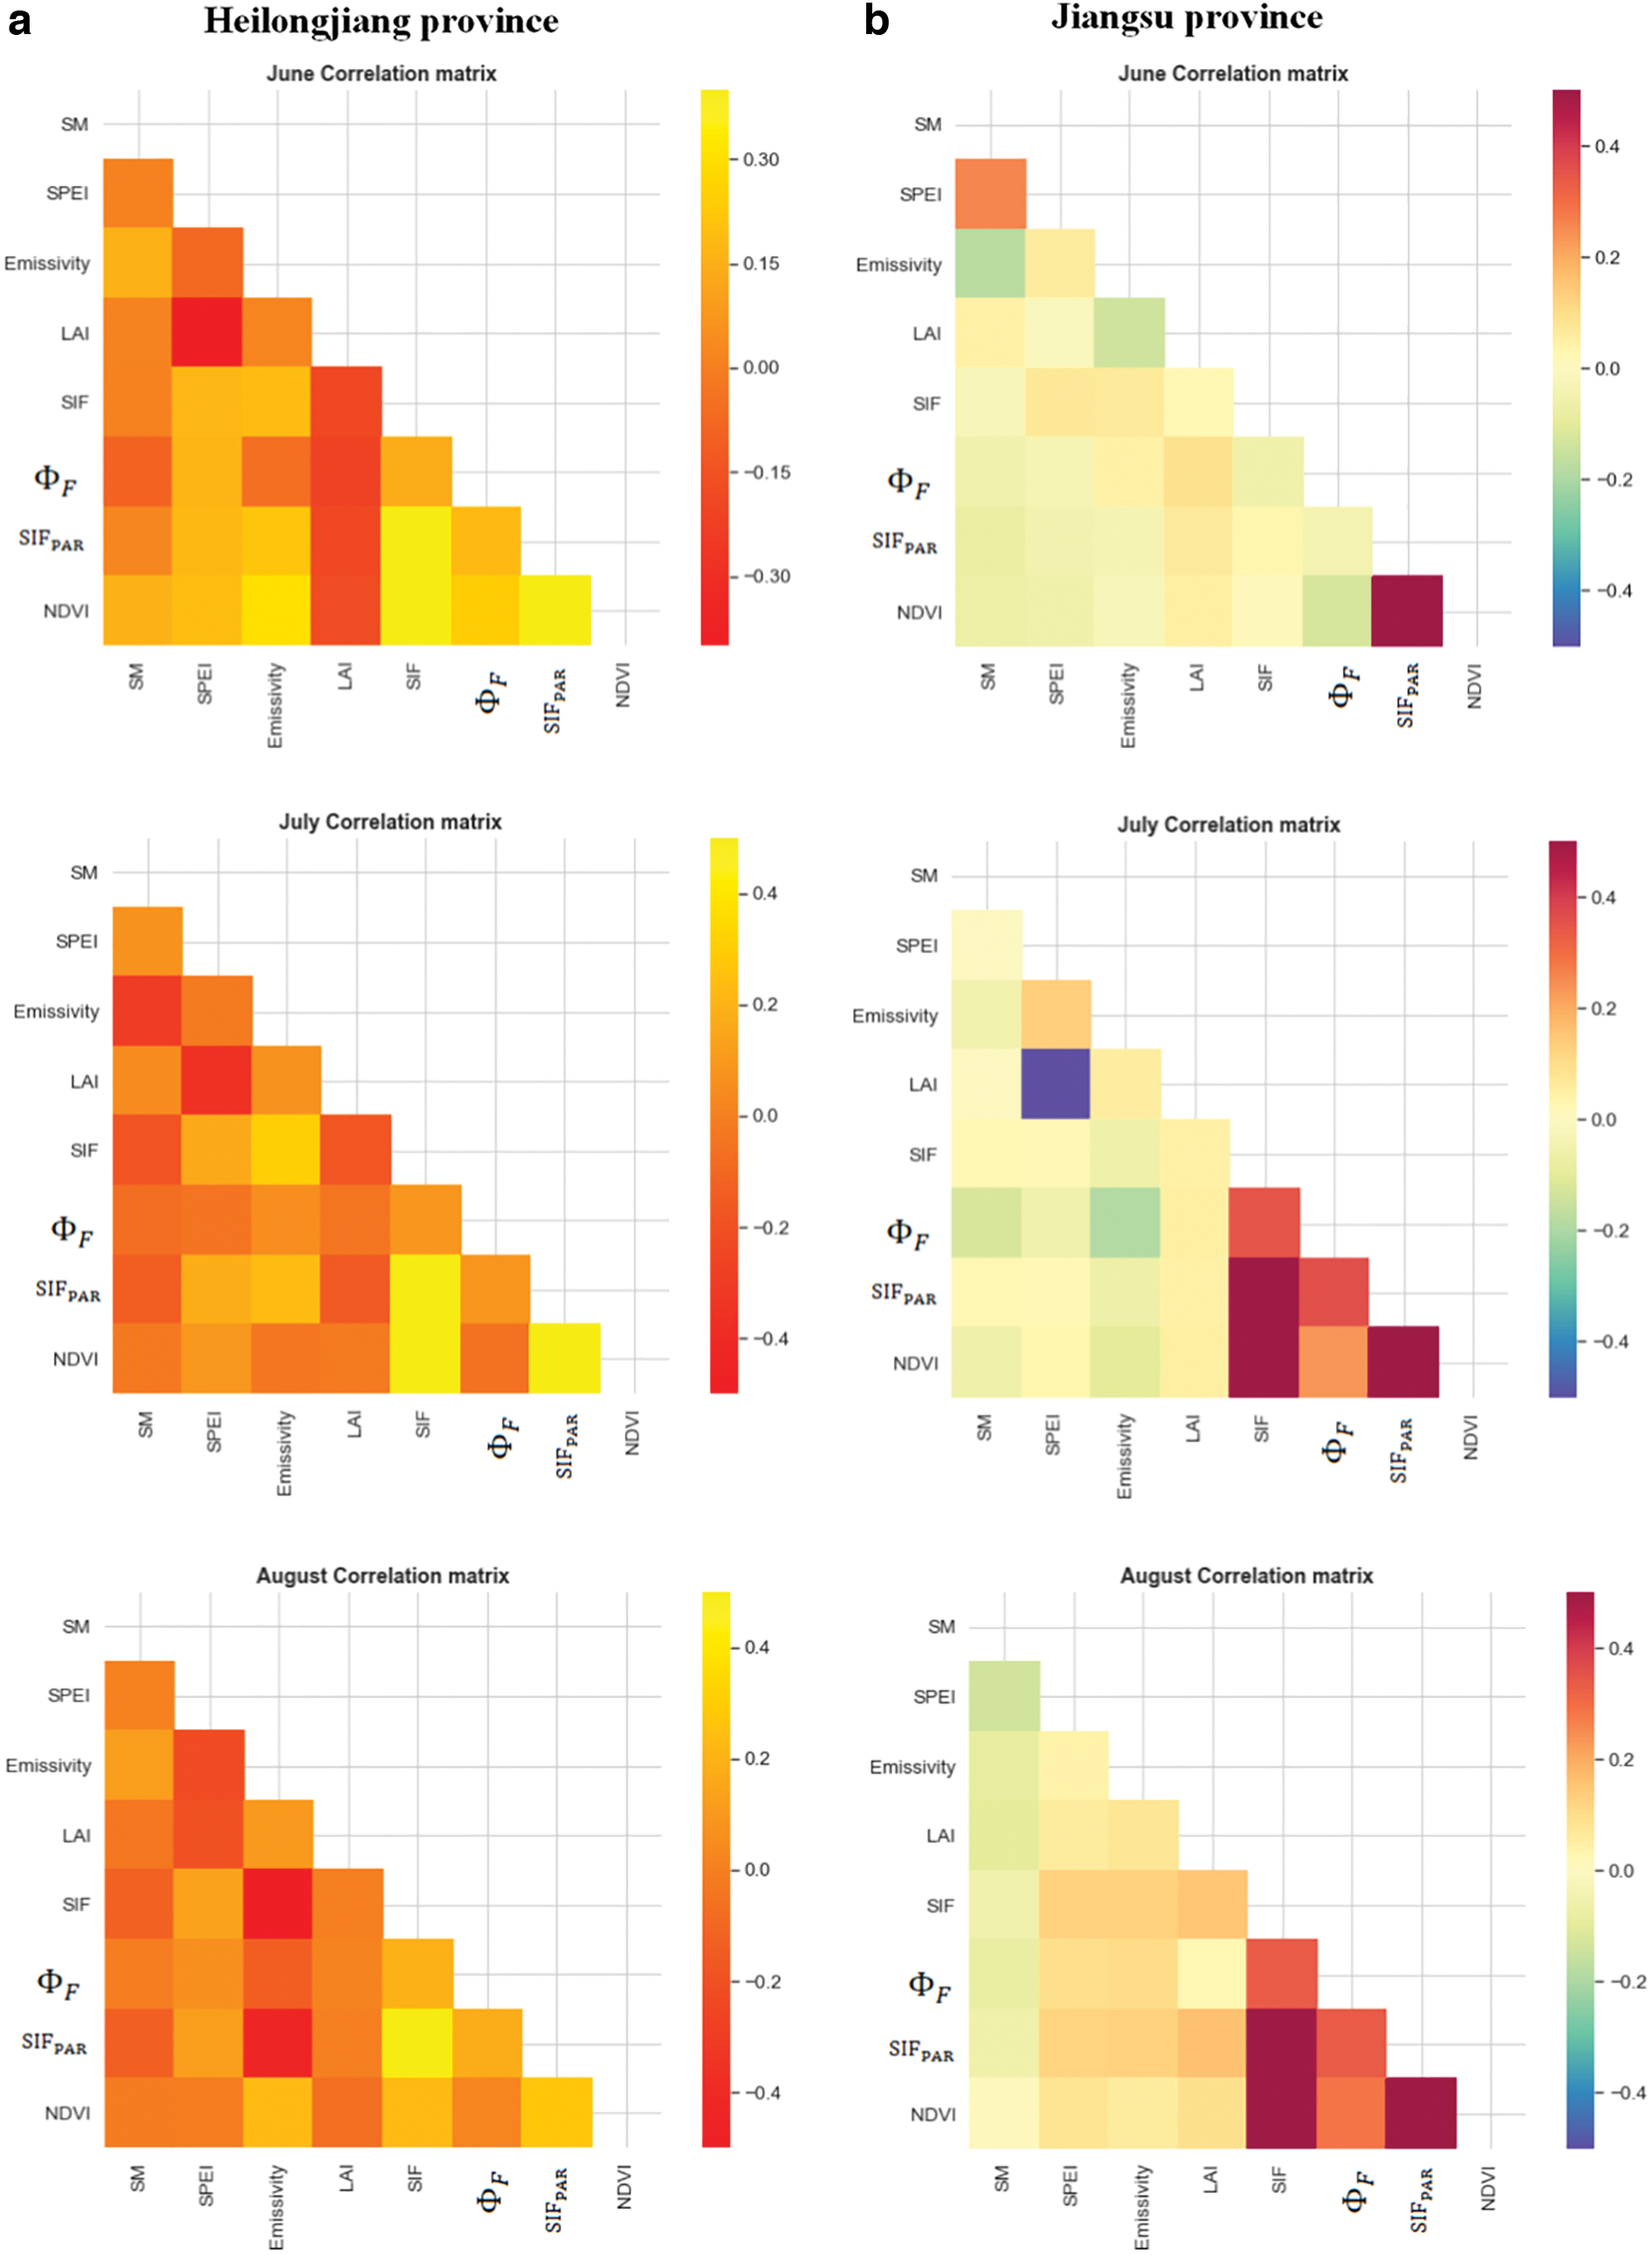
Correlation of SM, SPEI, and emissivity with LAI, SIF,
Furthermore, emissivity showed low correlation with LAI during the June–August drought, which was most likely based on the dissimilarity of emissivity with SIF,
In contrast, SM indicated a lower correlation between LAI and NDVI, which showed that SM was a significant parameter in detecting anomalies in SIF,
Relationship between SM, SPEI, and emissivity to SIF in the summer months of 2015
Figure 9 shows correlation of SIF with SM, SPEI, and emissivity from data in the summer months of 2015. The observed evaluation indicates that for SM measures lower than 0.2
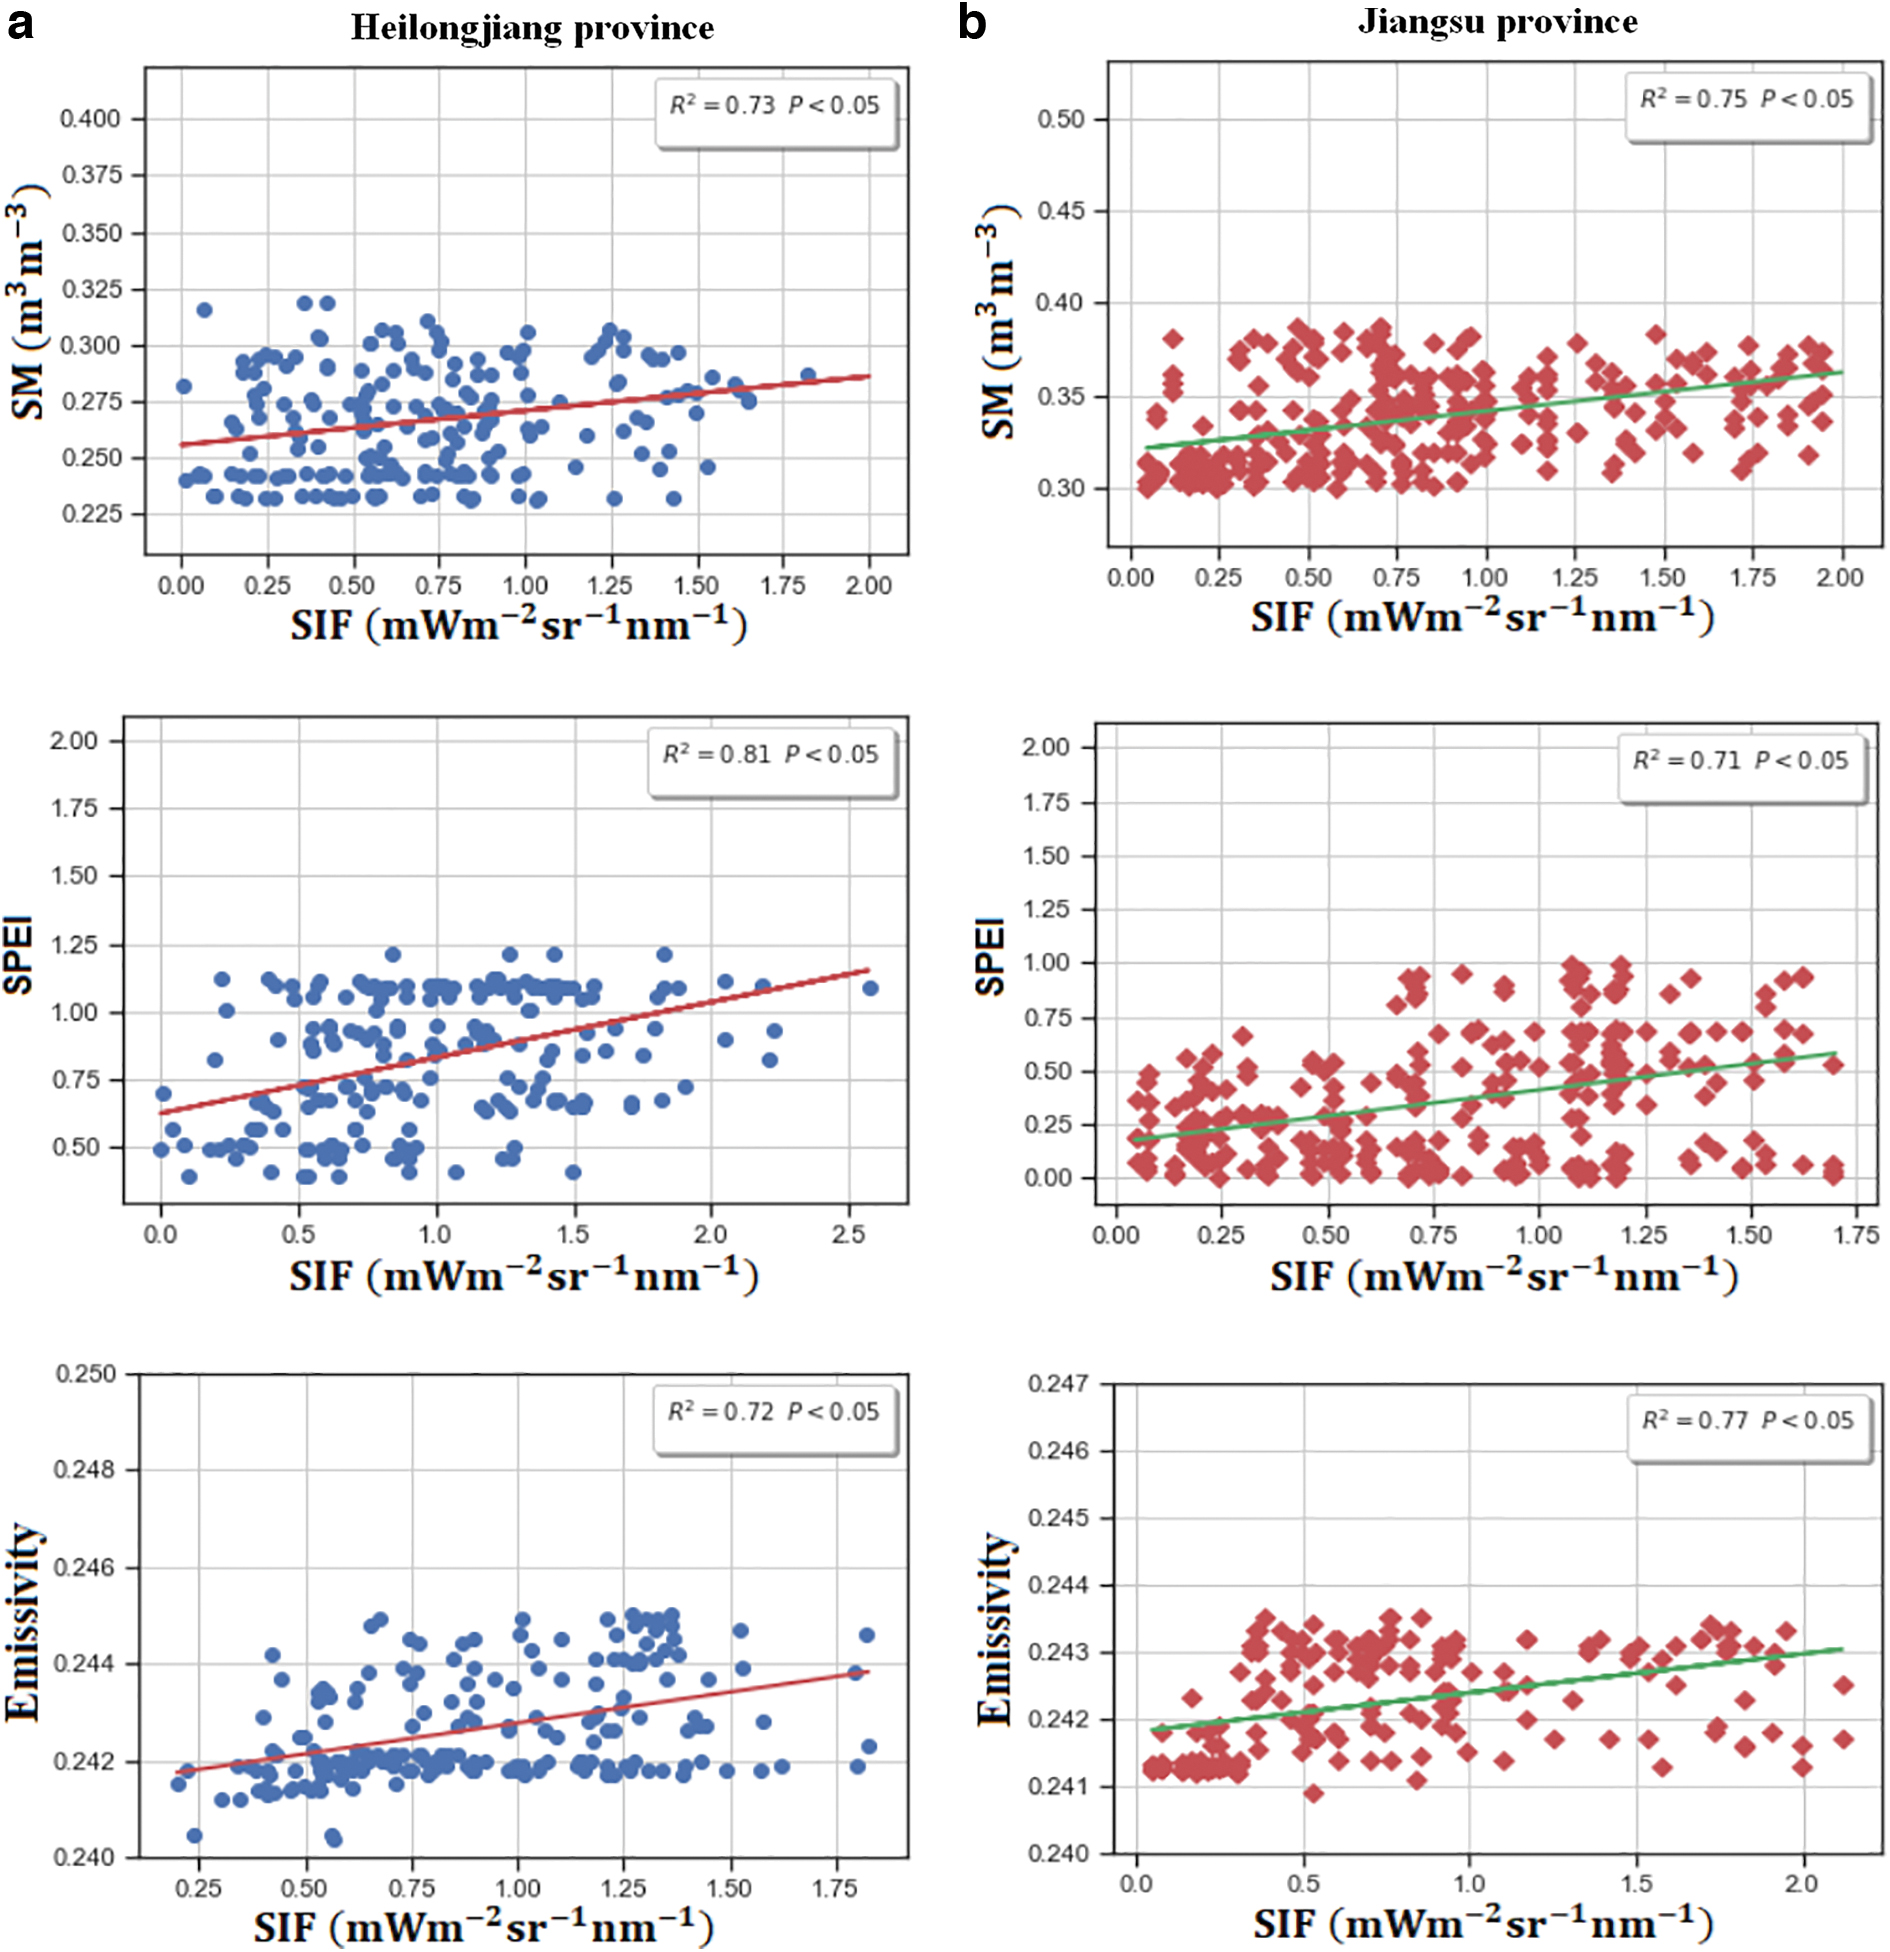
Scatter plots of SM, SPEI, and emissivity to SIF in Heilongjiang
For the SPEI, SIF increased substantially and showed positive correlation in Heilongjiang (R 2 = 0.81, p < 0.05) and Jiangsu (R 2 = 0.71, p < 0.05). This information may be (and has been) used through high-intensity farming methods in major parts of both the provinces studied in this article; this is true for substantial cultivation and higher vegetation yield changes, which restore high photosynthetic yield for larger SM.
Moreover, there are clear associations between SIF and emissivity. The positive correlation of SIF for a change in emissivity is greater across the measures in both Heilongjiang (R 2 = 0.72, p < 0.05) and Jiangsu (R 2 = 0.77, p < 0.05). The SIF-SPEI correlation has been shown to be significantly stronger compared with the measures of SM and emissivity in Heilongjiang, whereas SIF-emissivity correlation has been shown to be stronger compared with SM and SPEI in Jiangsu, specifically during the drought period (Fig. 9b).
Relationship between GPP and SIF
Figure 10 shows scatter maps of GPP with SIF during the summer of 2015 in both Heilongjiang and Jiangsu. Significant linear correlations were found between GPP and annual mean SIF in Heilongjiang (R 2 = 0.85) and Jiangsu (R 2 = 0.75). In 2015, GPP-negative anomalies onset was in June for Heilongjiang, whereas SIF anomalies were significant in July for both the provinces. The SIF-GPP relationship had a relatively stronger correlation in Heilongjiang province compared with Jiangsu province. High GPP values were found in some agricultural regions in the summers. SIF remained clearly associated with GPP, demonstrating that SIF has a high potential in detecting increases in photosynthesis, which is a benefit in assessing vegetation growth during drought across the extensive spatial measure.

Scatter plots of GPP and SIF in Heilongjiang province
Discussion
An appropriate and precise evaluation of drought stress is needed for tracking threats to terrestrial environment. To advance the level of our understanding regarding measures of drought, the temporal and spatial changes in SIF over the drought periods in Heilongjiang and Jiangsu provinces were evaluated. Our findings show that both LAI and NDVI exhibit a weaker response than SIF,
Through correlation analysis, we have found that SIF,
The analysis of summer drought using SIF across extensive spatial measures during 2007–2017 has provided us key insight and understanding on the relationship of SIF to the evaluation of drought. The findings of our study indicate that SIF response is quicker in providing information on the onset of drought in both Heilongjiang and Jiangsu provinces (Fig. 5). This finding was additionally exploited through the association of SM, SPEI, emissivity with LAI, SIF,
The variations in the delayed response of LAI and NDVI to SM, SPEI, and emissivity are related to the variations of vegetation demands, such as that of chlorophyll, and its development frequency, and are affected by weather conditions weeks before the measurements. In this context, Yoshida et al.
24
have indicated that SIF and NDVI within mixed forest environments show slight decreases under drought. This signifies that vegetation patterns can also have impact on signals of SIF and NDVI to drought. In conclusion, our study has shown that SIF,
The scatter plots of GPP and SIF in 2015 are nearly identical (Fig. 10) and show substantial positive correlation in both the provinces examined. This association indicates that GPP is consistent with SIF data in Heilongjiang (R 2 = 0.85, p < 0.001) and Jiangsu (R 2 = 0.75, p < 0.001) and is much more precise than in the existing studies from North America. 62 Few regions, specifically in Jiangsu province, compared with Heilongjiang province, had higher SIF measures that were not included in the mapping of GPP. The predominant cause for this poor correlation is that extreme photosynthesis typically occurs within the most appropriate climate state, which may not be reflected in climate data.
Moreover, both provinces studied here have typically sustained regular cloud cover that might have constrained the computation of VIs. However, the SIF data are still noisy, and there are lesser number of measurements in a small number of areas within both the provinces. It is essential that subsequent future research employs SIF and reflectance information at higher spatial and temporal resolution for improved global phenological understanding.
Conclusions
We have explored the response of SIF over the 2015 drought event in Heilongjiang and Jiangsu provinces of China. For both the provinces, space-based SIF,
We have observed that LAI and NDVI had more distinct delayed responses than SIF,
Footnotes
Acknowledgment
We are highly thankful to Dr. Nancy Kiang, NASA (National Aeronautics and Space Administration), USA, for reading our article and for her suggestions.
Author Disclosure Statement
No competing financial interests exist.
Funding Information
This research was financially supported by the National Natural Science Foundation of China (nos.: 31771680 and 51961125102), the 111 Project (B12018), and Postdoctoral research fund (1255210162190560) from the Jiangnan University.