
Abstract
Geological hazards (geohazards) are geological processes or phenomena formed under external-induced factors causing losses to human life and property. Geohazards are sudden, cause great harm, and have broad ranges of influence, which bring considerable challenges to geohazard prevention. Monitoring and early warning are the most common strategies to prevent geohazards. With the development of the internet of things (IoT), IoT-based monitoring devices provide rich and fine data, making geohazard monitoring and early warning more accurate and effective. IoT-based monitoring data can be transmitted to a cloud center for processing to provide credible data references for geohazard early warning. However, the massive numbers of IoT devices occupy most resources of the cloud center, which increases the data processing delay. Moreover, limited bandwidth restricts the transmission of large amounts of geohazard monitoring data. Thus, in some cases, cloud computing is not able to meet the real-time requirements of geohazard early warning. Edge computing technology processes data closer to the data source than to the cloud center, which provides the opportunity for the rapid processing of monitoring data. This article presents the general paradigm of edge-based IoT data mining for geohazard prevention, especially monitoring and early warning. The paradigm mainly includes data acquisition, data mining and analysis, and data interpretation. Moreover, a real case is used to illustrate the details of the presented general paradigm. Finally, this article discusses several key problems for the general paradigm of edge-based IoT data mining for geohazard prevention.
Introduction
Geological hazards (geohazards) are geological phenomena formed under the influence of external factors damaging human life, property, and the environment.1,2 Generally, geohazards include landslide, debris flow, rock collapse, surface subsidence, surface cracks, and surface collapse. Geohazards are characterized as group-occurring; have certain susceptibility, suddenness, and high risks; and are challenging to forecast. Geohazards cause significant casualties and property losses, which create considerable challenges for geohazard prevention. For example, in 2006, a landslide in the Philippines destroyed a village and killed >1100 people. 3 In 2008, the Wenchuan earthquake severely damaged >100,000 km2 and killed 69,227 people. 4
Monitoring and early warning are essential strategies in geohazard prevention.5–7 Monitoring and early warning aim to collect geohazard-related data to predict the development trend of the monitored target and provide geohazard early warning information. However, the strong suddenness and hostile monitoring environment of geohazards make monitoring and early warning challenging. Traditional manual measurement and prevention cannot satisfy the current needs of geohazard monitoring and early warning.
The rapid development of internet of things (IoT) technology8,9 makes geohazard monitoring and early warning more accurate and effective. An IoT-based geohazard early warning platform includes three layers, that is, the perception layer, the transmission layer, and the application layer.10,11 IoT-based monitoring devices can collect the changing indicators related to geohazards, such as displacement, rainfall, and water level. Then, the geohazard monitoring data are transmitted to the application layer through wired or wireless transmission. Finally, the application layer conducts geohazard data processing and sends the results to the command center, thus providing adequate data support for early geohazard warning. Generally, the application layer is usually established based on cloud computing. Cloud computing plays a key role in geohazard monitoring and early warning because of its huge computing capabilities.
The explosive growth of IoT monitoring data increases a load of cloud computing, causing inevitable time delay. 12 Moreover, geohazard monitoring data usually have the characteristics of big data. 13 The data types are progressively abundant, and the amount of data is also increasing. The limitations of the network bandwidth and high load of the cloud center enhance the time delay of cloud computing in geohazard early warning. However, geohazard early warning requires the rapid processing of monitoring data, which leads to the lack of reliability of cloud computing when a higher delay exists. In addition, in some cases where the monitoring environment is particularly bad, it is challenging to transmit the monitoring data to the cloud center due to the difficulties in the installation and high cost of transfer devices such as base stations. Thus, choosing a more proper data processing strategy to cope with the suddenness and great harm of geohazards is a challenge.
Edge computing can effectively reduce the delay by addressing tasks near the data source. 14 The monitoring data based on the IoT devices do not have to be transmitted to the cloud center, which reduces the time delay of data processing and provides more time for geohazard early warning. Compared with cloud computing, edge computing has advantages of lower delay, higher security, stronger scalability, location awareness, lower costs, and lower traffic.15,16 Therefore, edge computing has excellent potential in geohazard monitoring and early warning.
However, edge computing has not been widely introduced into the application scenario of geohazard prevention, although it has achieved many successes in intelligent medicine,17,18 automatic driving,19,20 smart homes, 21 industrial IoT, 22 and other scenarios.23,24
To fill the above gap, this article introduces edge computing to the field of geohazard monitoring and early warning. Our contributions can be concluded as follows. (1) A general paradigm of edge-based IoT data mining for geohazard prevention is presented. It especially focuses on geohazard monitoring and early warning, including data acquisition, data mining and analysis, and data interpretation. (2) A real case of surface deformation induced by coal mining is used to illustrate the details of the presented general paradigm. (3) Challenges and potential future work in edge-based geohazard prevention are summarized.
The article organizes as follows. The Background section provides a brief presentation of geohazard prevention and edge computing. The Method: Mining and Analysis of Edge-Based IoT Data for Geohazard Prevention section presents the general paradigm of data mining and analysis in geohazard monitoring and early warning. The Application: A Practical Case section uses a practical case to illustrate the details of the presented general paradigm. The Discussion section discusses the challenges and potential future work in edge-based geohazard prevention. The Conclusion section summarized this article.
Background
Geohazard prevention
Geohazard prevention25,26 uses practical geological engineering strategies to change the occurrence process of geohazards such as landslide and surface subsidence. Roughly, geohazard prevention strategies can be divided into the following two situations. First, practical geological engineering strategies are used to control geohazards. For example, the use of an anchor bar to reinforce the landslide. Second, IoT-based devices are used to conduct geohazard monitoring and early warning.27,28 By monitoring the changes in the monitoring body and external-induced factors, IoT-based devices make an alarm before or when the geohazards occur and inform the residents in the dangerous areas to evacuate in time through various means of communication.
Edge computing
Edge computing is an emerging computing mode that extends cloud computing to the network edge through edge devices. Edge computing and cloud computing are not independent; they are closely related to each other. The edge computing architecture includes the terminal layer, edge layer, and cloud layer29,30 (Fig. 1).
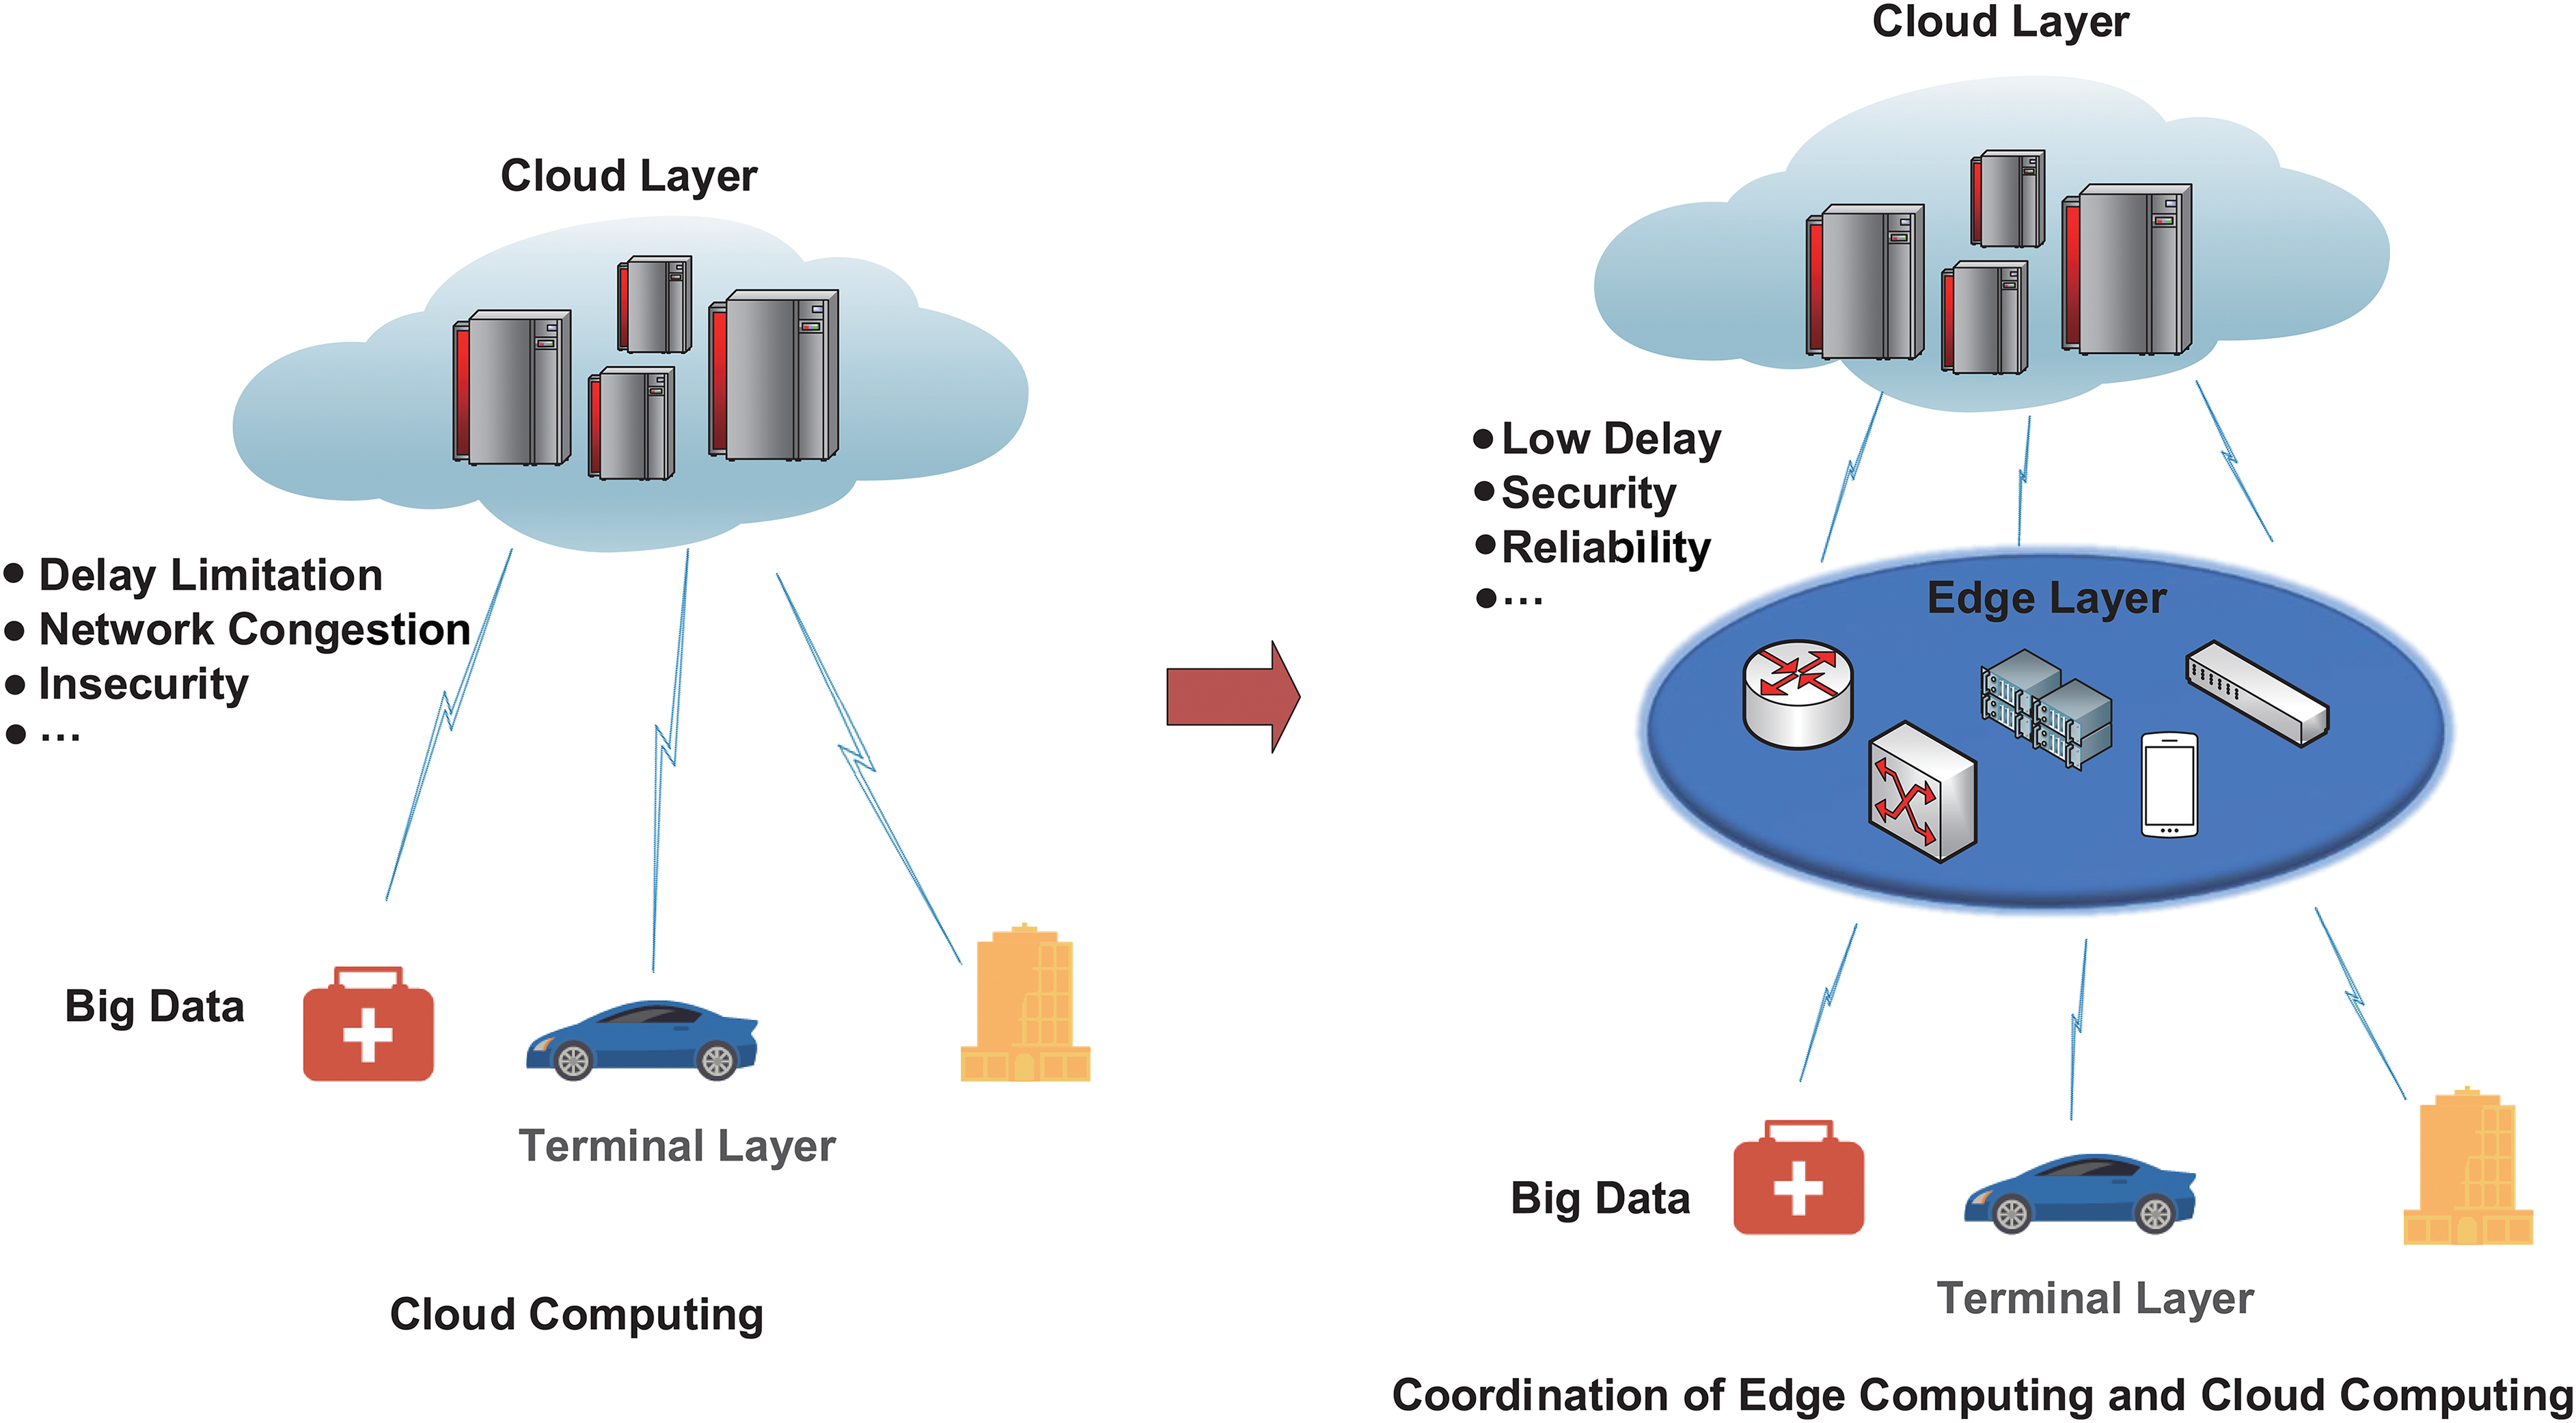
An illustration of edge computing. Color images are available online.
Terminal layer
The terminal layer is composed of various IoT devices, such as sensors and card readers. The terminal devices aim to collect the original data and transmit them to the upper layer for computing and storage.
Edge layer
The edge layer is composed of many edge nodes, such as routers, mobile phones, and gateways. Edge nodes can compute and store the data uploaded by the terminal devices. Because edge nodes are close to users, they can serve delay-sensitive scenarios to satisfy the real-time needs of users. Edge nodes can also preprocess the collected data and then transmit the preprocessed data to the cloud layer, thus enhancing the efficiency of the cloud center.
Cloud layer
The cloud layer can provide huge computing power and storage capacity, which can enable it to execute complicated computing tasks. The cloud layer and edge layer are not independent; the cloud layer can effectively schedule edge nodes from a global perspective, maximizing the computing power of edge computing.
Method: Mining and Analysis of Edge-Based IoT Data for Geohazard Prevention
Overview
This article presents the general paradigm of edge-based IoT data mining for geohazard prevention, especially focusing on monitoring and early warning. Geohazard monitoring and early warning are conducted according to the IoT monitoring data. The process can be divided into three phases: (1) data acquisition, in which various targeted monitoring sensors based on IoT technology can continuously monitor the status of hidden danger points, providing extremely rich and fine data for geohazard early warning; (2) data transmission, in which monitoring data are transmitted to the computing center through wired or wireless technology; and (3) data application, including data mining and analysis and data interpretation, which can be conducted in the cloud center or edge computing devices.
The mining and analysis of geohazard monitoring data are the core of geohazard early warning. Cloud computing or edge computing can comprehensively analyze the monitoring data to predict the state of the monitored target and effectively prevent geohazards.11,31
It can be seen from the above process that the locations of monitoring data mining and analysis are different for cloud computing and edge computing. Edge computing executes the process as close as possible to the location of the collected data, which will reduce data processing time and is very consistent with the geohazard prevention scenario with high requirements for low delay.
In the following subsections, the three main phases of edge-based IoT data mining for geohazard prevention, including data acquisition, data mining and analysis, and data interpretation, are presented.
Phase 1: data acquisition
IoT technology can provide adequate monitoring data for geohazard prevention, even if there are some challenges, including the wide range of monitoring areas, harsh monitoring environment, long monitoring time, and various induced factors.
IoT-based sensors work well in geohazard data acquisition. Sensors can continuously monitor the hidden danger points and realize automatic monitoring. Moreover, the monitoring frequency can be set remotely according to the needs of the hidden danger points and to overcome the disadvantages of the harsh environment and long monitoring time. Simultaneously, there are several kinds of geohazard monitoring devices, such as rainfall gauges, displacement meters, stress meters, inclinometers, and video systems. Different monitoring devices can be selected according to different needs, overcoming the problems caused by many induced factors. In addition, multiple sensors can form a sensor network, such as cellular IoT (Fig. 2). 32 Sensor networks can meet large-scale and long-term geohazard data monitoring requirements because of their broad coverage, low power consumption, and low costs.33–36 A sensor network based on the IoT provides a data basis for collecting data for edge computing.
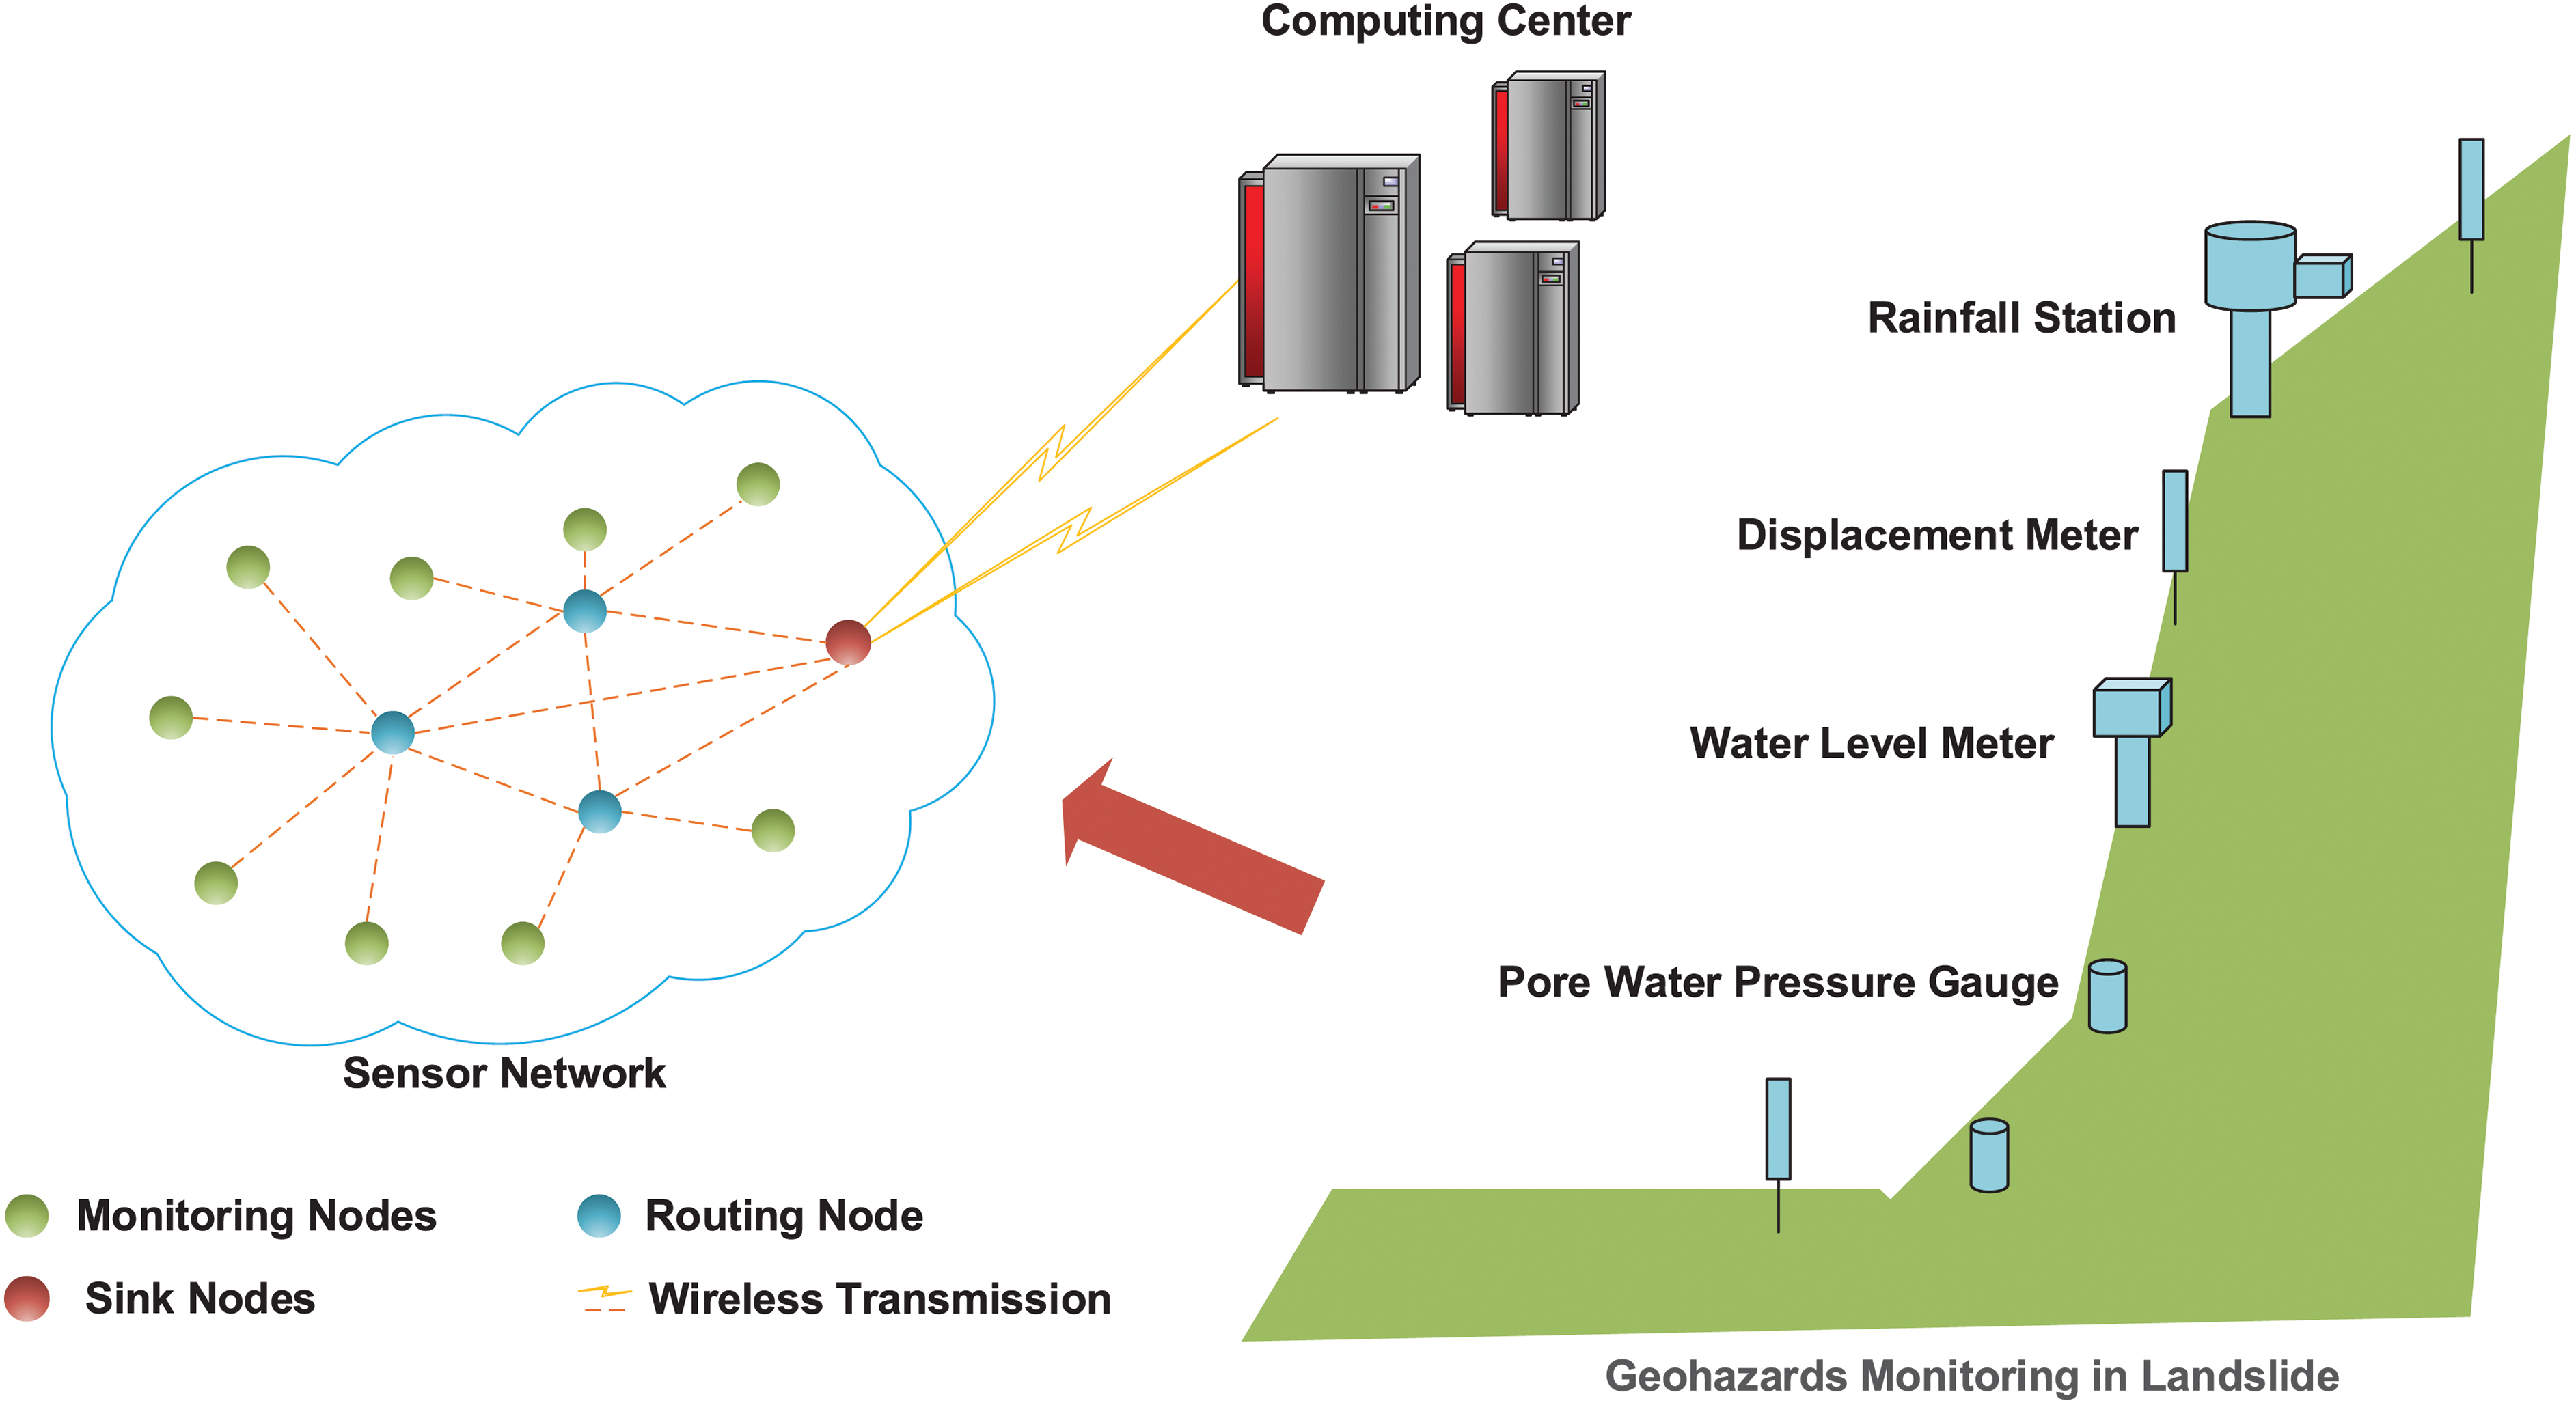
An illustration of a sensor network for monitoring landslide. Color images are available online.
Phase 2: data mining and analysis
The mining and analysis of geohazard monitoring data can determine the probability of geohazards by continuously collecting the data for the same area at different times. Adequate monitoring data and effective data models are the cores of data mining and analysis. The data preprocessing and data modeling processes are presented in the following paragraphs.
Data preprocessing
Data preprocessing is an essential step in geohazard monitoring data mining and analysis. Monitoring data have the characteristics of large amounts, multiple types, and great value. However, due to the harsh environment of geohazard monitoring, the original data collected by monitoring devices are dirty, incomplete, redundant, and fuzzy, which can hardly meet the requirements of the data mining algorithm directly. Thus, it is challenging to obtain clean, accurate, and concise data. 37
For geohazard monitoring data, this article summarizes four common preprocessing methods, including data cleaning, data integration, data selection, and data conversion.38,39
Data cleaning
Device failures and human factors may introduce noise to or cause the loss of geohazard monitoring data, affecting the quality of data sources. The processing method for incorrect data depends on the specific situation. When there is a considerable amount of missing data, the data can be removed; otherwise, it is easy to introduce inaccurate data, which would produce wrong results in the mining task. When there is a small amount of missing data, regression and interpolation methods 40 can be used to fill in the missing data. For noisy data, binning, clustering, and regressions can be used. 41
Data integration
The data types and structures derived from geohazards are various and complicated. Moreover, the data formats of monitoring devices are different. To better conduct data mining and analysis, different monitoring data need to be integrated. 42
Data selection
There are many induced factors of geohazards, and the monitoring process of geohazards is long term and uninterrupted; thus, considerable amounts of multiple types of data will be accumulated. To ensure accuracy and low delay, valuable data from data sources must be selected for mining. For example, most landslides in mountainous areas are caused by heavy rainfall or continuous rainfall. Therefore, rainfall and water level changes need to be used as input data of the prediction model.
Data transformation
The selected geohazard monitoring data can be transmitted into a form that can be mined. The values and dimensions of many indicators are different due to many geohazard monitoring factors. It is essential to conduct the data transformation, such as normalization and discretization. 39
Data modeling
Data models are used to mine the existing monitoring data and provide a reference for geohazard early warning. For the geohazard monitoring data, four typical data models43,44 are introduced, including classification regression models, association rules models, clustering models, and time-series models.
Classification regression models
Classification regression models apply classification and regression to predict problems. Classification mainly constructs a classification model that inputs training data attribute values and outputs predefined categories. Regression mainly establishes a continuous function model to predict the values of dependent variables corresponding to the given independent variables. Typical algorithms include regression analysis, 45 decision tree, 46 naive Bayes, 47 support vector machine, 48 and artificial neural network. 49
Association rules models
Association rules models find the associations or relationships hidden between data items. That is, the appearance of other data items can be deduced according to the appearance of one data item. Typical algorithms include the Apriori algorithm 50 and the Éclat algorithm. 51
Clustering models
Clustering models provide unsupervised learning algorithms that divide data into several groups according to their distance or similarity without a given classification. Typical algorithms include the K-means 52 and spectral clustering. 53
Time-series models
The primary purpose of a time-series model is to predict future changes based on the existing time-series data. Typical algorithms include the long short-term memory (LSTM) model 54 and the autoregressive integrated moving average (ARIMA) model. 55
Phase 3: data interpretation for geohazard early warning
In this section, we show how the combination of monitoring data and data mining algorithms can be used to realize the geohazard early warning through specific examples.
Geohazard susceptibility evaluation
Geohazard susceptibility indicates the probability of geohazard events occurring in a specific area according to the local monitoring data. Monitoring data, analyzing data, and conducting susceptibility evaluation in a specific area are the initial methods to address geohazards in advance. Based on different monitoring data and mining algorithms, this article divides geohazard susceptibility evaluation into two types of methods:
Supervised methods: Supervised methods often incorporate previous geohazard monitoring data and the state of geohazard points and are used to train a prediction model. When new monitoring data are input, the model can predict the stable state of the geohazard monitoring points.
56
In this article, we take landslide as an example. There are many induced factors of landslide such as the slope, lithology, and other static indicators; and many dynamic indicators such as the groundwater level and rainfall. This article uses the naive Bayes model and decision tree model to illustrate the modeling process.
Naive Bayes model
The basic principle of the naive Bayes model is to determine the probability of landslide stability according to the current monitoring data. The inputs are the induced factors and labels of historical landslides. For example, several induced factors, such as slope, rainfall, and displacement, can be used as the input data. The labels of historical landslides include stability, instability, and intermediate state. Generous input data can be trained to obtain a new landslide classifier. When facing the new landslide monitoring data, the landslide classifier is used to predict the probability of landslide stability under the condition that the monitoring data occur. The stability corresponding to the maximum probability is the prediction state of the landslide.
Decision tree model
Figure 3a clearly shows the classification process of the decision tree. 57 Each landslide to be classified receives the corresponding category after applying the decision tree classifier. The decision tree classifier is trained based on training data, and the order of each decision node is determined by the information gain criterion or Gini index criterion to improve the prediction accuracy. The classifier can be used to classify new landslides.
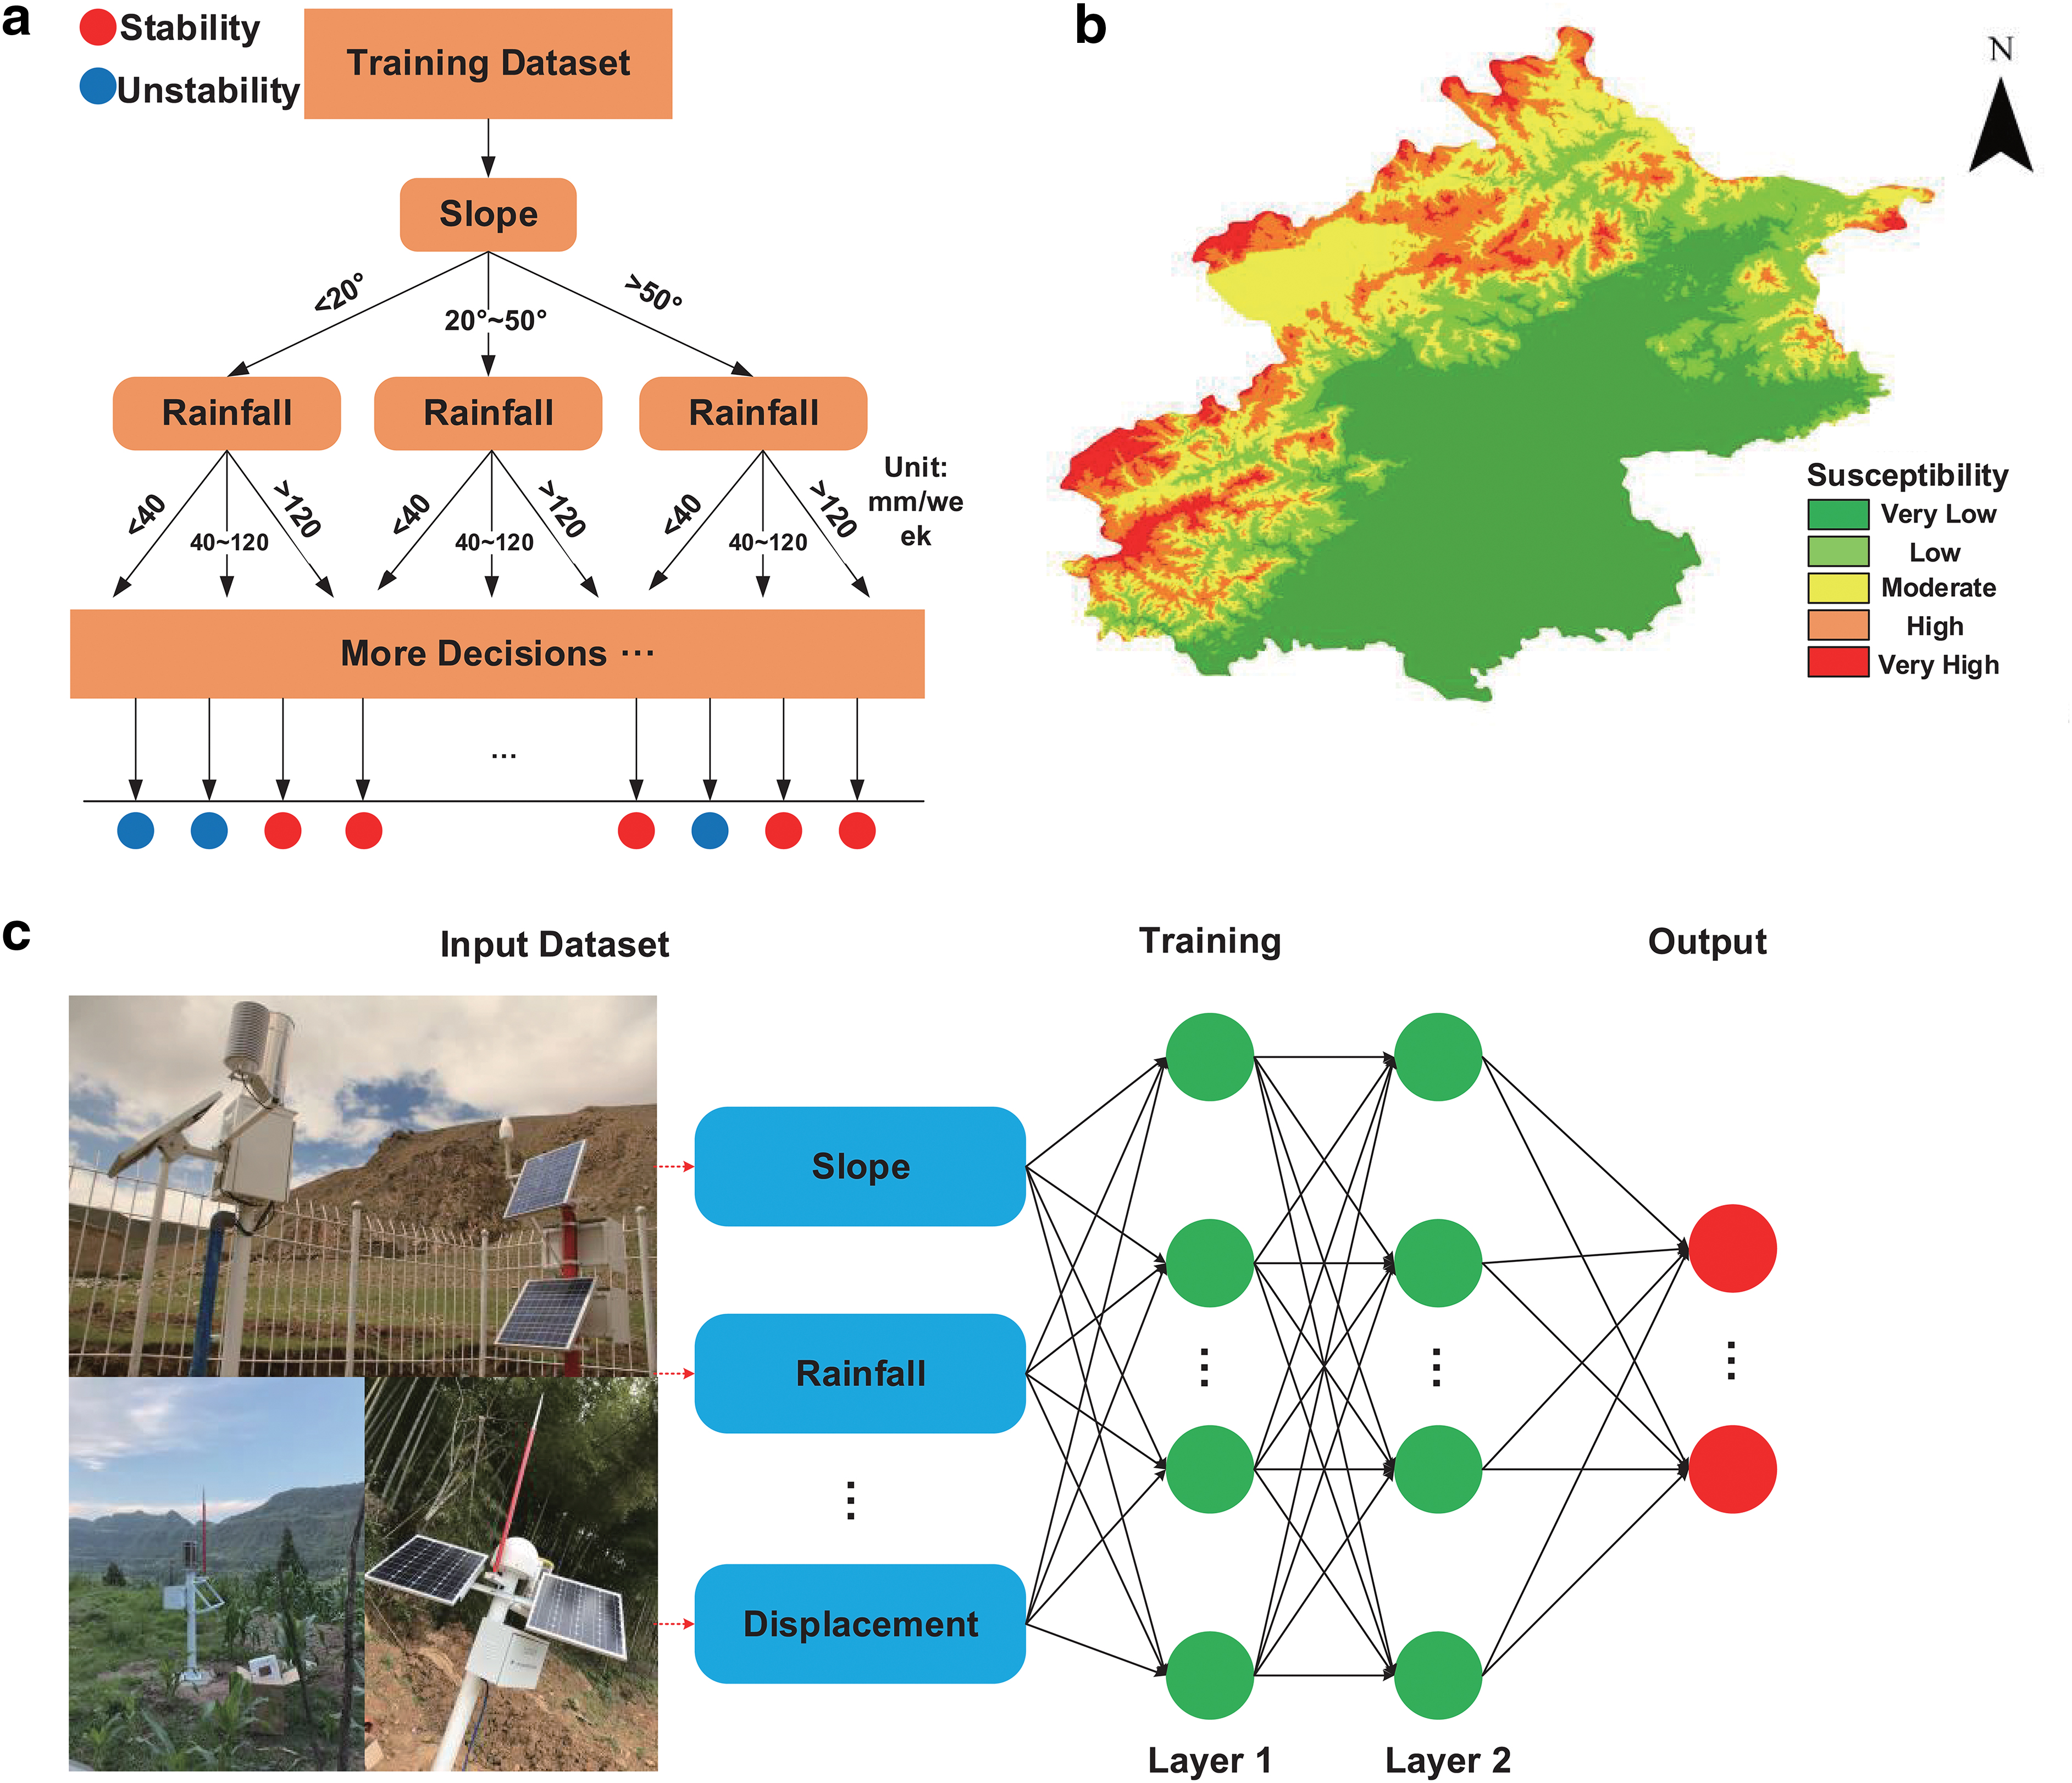
Data interpretation for geohazard early warning.
Unsupervised methods: unsupervised methods are usually utilized for the regional division of geohazards. A fundamental problem is determining which areas are prone to geohazards when researchers investigate geohazards in an area.58,59 The clustering model is usually used to overcome this problem. Regional monitoring data, such as data on the topography, lithology, rainfall, groundwater level, and the historical experience, can be used to divide the survey region into several risk levels, including very low, low, moderate, high, and very high (Fig. 3b). The risk level established by the clustering model provides a reference for later geohazard investigations and prevention.
Geohazard real-time prediction
The geological conditions of the geohazard points determine the probability of geohazards, but most of the geohazards are induced by other factors, such as the rainfall and groundwater level. When the rainfall, groundwater level, and other induced factors reach a certain threshold, this will lead to the occurrence of geohazards. To better control geohazards, single variables, such as rainfall, 60 groundwater level, and displacement, 61 must be predicted. Moreover, the development of geohazards needs to be dynamically predicted in real time using a variety of factors (Fig 3c).62,63
Application: A Practical Case
Underground mining can cause surface cracks, surface subsidence, and surface collapse. These issues occur because underground mining destroys the original stress balance state, causing the rock strata to deform and destroy. The movement of the internal rock mass extends to the surface and eventually leads to surface deformation. The surface deformation will affect the safety of underground mining and destroy the surface buildings. 64
To prevent surface deformation, one of the important strategies is to conduct early warning based on monitoring data. Generally, the mine disaster is sudden and will cause a great risk of casualties. The faster warning gives workers more time to evacuate from the mine. As discussed above, edge computing has a lower delay when compared with cloud computing. Thus, the combination of edge computing and underground mining is meaningful. The Yangjiacun coal mine is used to illustrate the procedures of the general paradigm presented in the Method: Mining and Analysis of Edge-Based IoT Data for Geohazard Prevention section. The following includes a brief introduction to the study area, data acquisition, mining and analysis of monitoring data, and data interpretation for the early warning of surface deformation.
Brief introduction to the study area of the practical case
The Yangjiacun coal mine is located in the Dongsheng coalfield, Ordos City, China. The mine was built with recoverable reserves of 441.82 million tons (mt) and a design production capacity of 5.0 mt per year. The mine started mining in May 2011 and ended mining on December 31, 2015. The monitoring area is located in the central and western part of the Yangjiacun coal mine, 400 m away from the Ordos prison in the south. The Yangjiacun coal mine is located in a mountainous area with sparse vegetation and strong terrain cutting. The mining of the coal mine had resulted in subsidence basins, cracks, and collapse pits in the monitoring area (Fig. 4b).

Illustrations of study area.
Data acquisition
Multiple monitoring points need to be arranged to record the subsidence value in the monitoring area considering the large monitoring scope. To make the monitoring data representative, 4 observation lines and 146 monitoring points are arranged in the working face (Fig. 4a.) We selected 38 monitoring points, including A1–A18 and R1–R20, to analyze the law of surface deformation. These monitoring data began being recorded on May 8, 2011, and stopped being recorded on February 12, 2012. Routine monitoring was conducted once a week, and a total of 41 regular monitoring times were conducted. The data show that 38 monitoring points have finally reached a stable state.
GPS receivers were used to monitor the subsidence. The advantage of edge computing is that the monitoring data do not have to be transmitted to the cloud layer for processing, which provides more response time for the emergency response of the surface collapse.
Mining and analysis of monitoring data for prevention
The idea of monitoring data mining and analysis is to find a law from the existing data and then predict future settlement development. Monitoring data mining and analysis aim to obtain the subsidence law and prediction model to provide a reference for the prevention of surface subsidence caused by subsequent mining.
Analysis of subsidence characteristics
The cumulative subsidence of monitoring points was surveyed to determine the degree of subsidence in the monitoring area (Fig. 5). For A1–A18, there are five monitoring points with accumulated subsidence greater than 1000 mm. The trend indicates that the closer to the central line of the monitoring area a point is, the greater the subsidence, and the maximum cumulative subsidence is close to 2500 mm. For R1–R20, there are 16 monitoring points with accumulated subsidence greater than 1000 mm, and 15 of them are greater than 3000 mm, which shows that the degree of subsidence on the central line of the monitoring area is relatively high.

Final subsidence of the monitoring points.
Figure 6 presents the subsidence curve of each monitoring point, and the results indicate that during the first 30 monitoring periods, the surface was in a state of subsidence; and after the first 30 monitoring periods, the surface has reached a stable state. Moreover, the surface subsidence caused by coal mining has a certain regularity, which can be divided into three stages: subsidence development, subsidence sufficient, and subsidence attenuation.
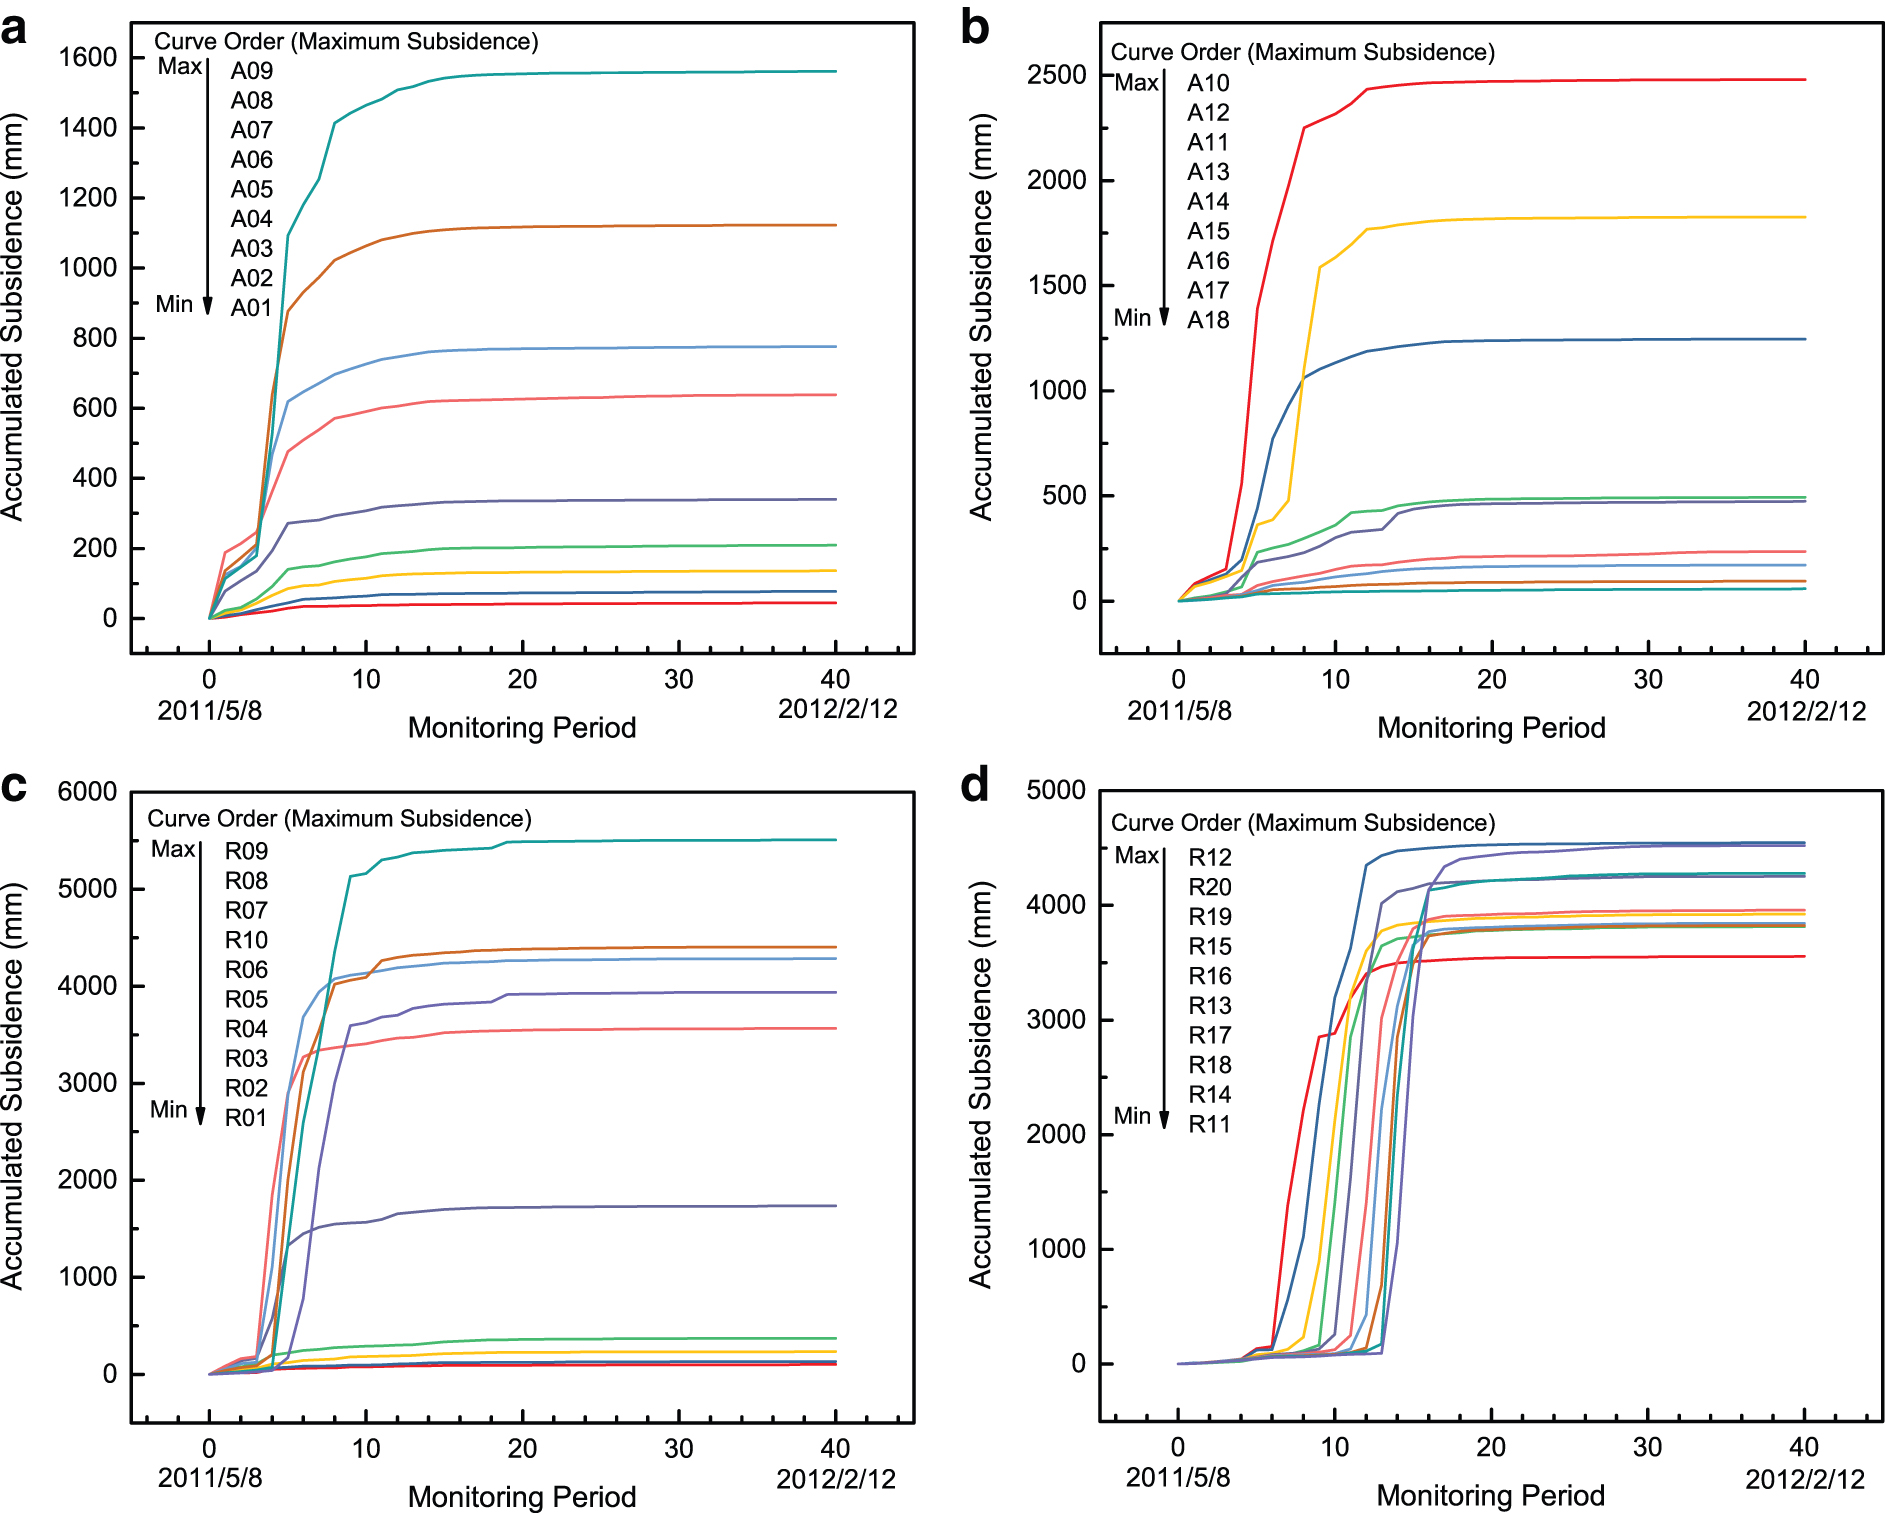
Subsidence law of monitoring points.
Mining and analysis of subsidence data
Effective data models need to be determined to predict the subsequent mining subsidence based on the subsidence law. The cumulative subsidence induced by coal mining can be regarded as an unstable time-series. It is considered that the cumulative subsidence includes the trend items and periodic items based on the additive model of time-series. 65
The surface subsidence induced by coal mining is related to the mining frequency and mining mode; thus, the seasonal factor is not considered. The additive model can be expressed as follows:
where yt is the cumulative subsidence, Tt is the trend items, and Ct is the periodic items. The cumulative subsidence is caused by the interaction of geological conditions and induced factors. The trend items are affected by the geological conditions of the rock stratum, which show monotonic growth. The subsidence affected by external factors presents fluctuating changes, and the time-series presents the characteristics of regularity and laddering.
In this article, four monitoring points, including A05, A10, R10, and R20, are selected to conduct the time-series prediction.
Prediction of trend items
The trend items reflect the inevitable result of the evolution of the surface subsidence, which is subject to its internal conditions. In this article, the trend terms are extracted by the simple moving average method,
66
and the details are as follows. Suppose the observation value of the time-series is Xt, where
where
Prediction of periodic items
According to the additive model of the time-series, the periodic items can be obtained by removing the trend items from the accumulated subsidence. The periodic item displacement is related to the periodic disturbance of underground mining. However, due to the large differences in the periodic items in each monitoring period, we have processed the periodic items for better visualization (Fig. 8).
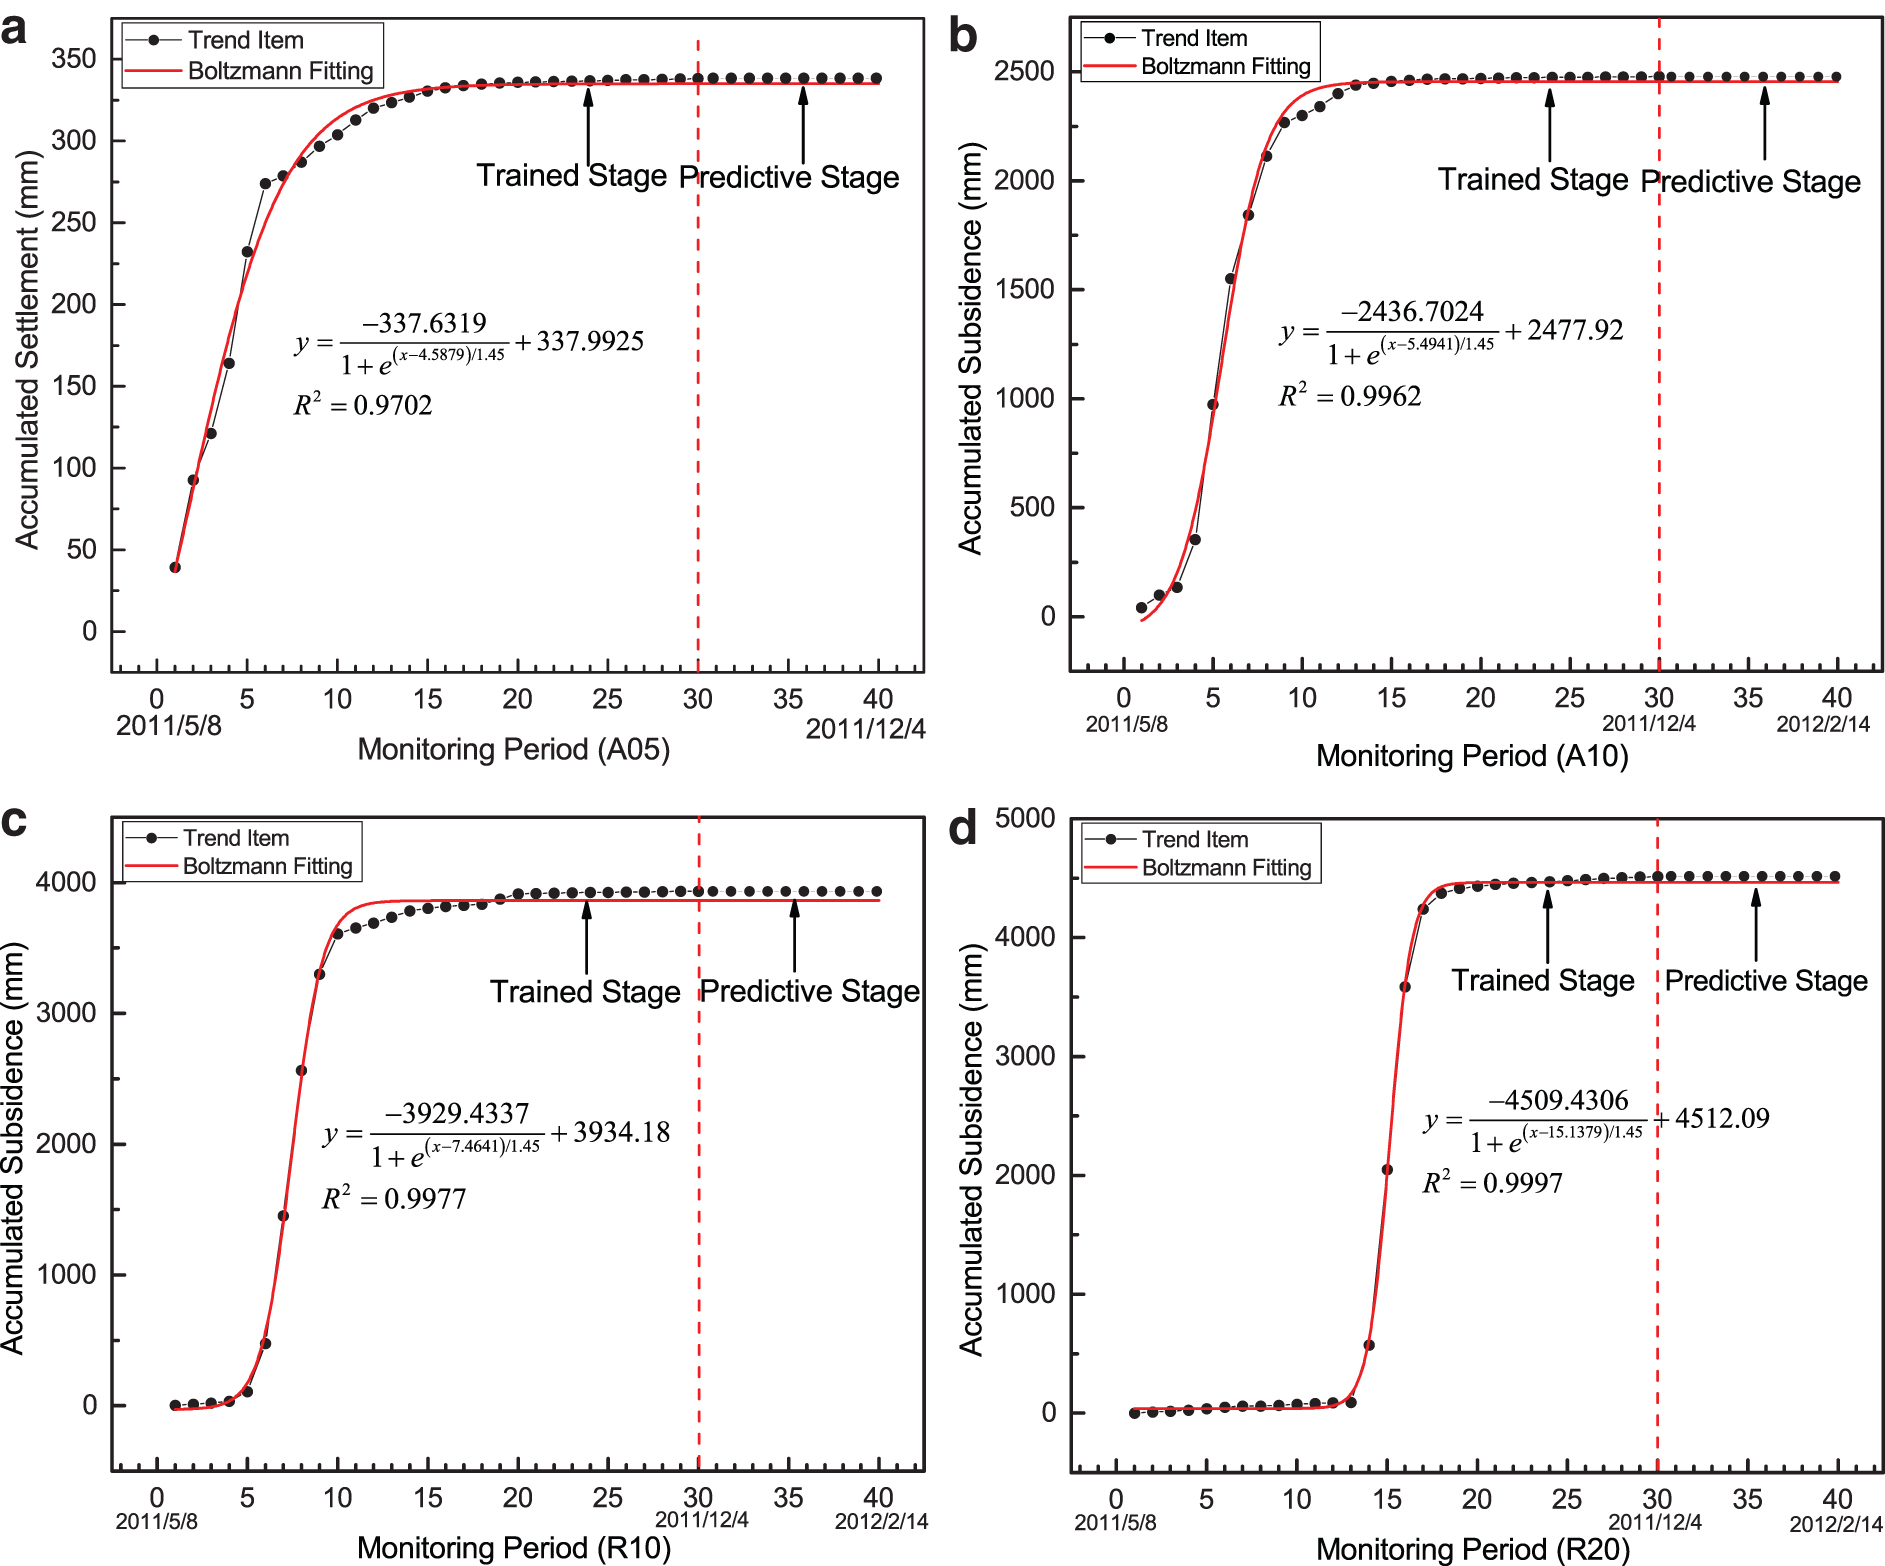
Fitting and prediction of trend items.
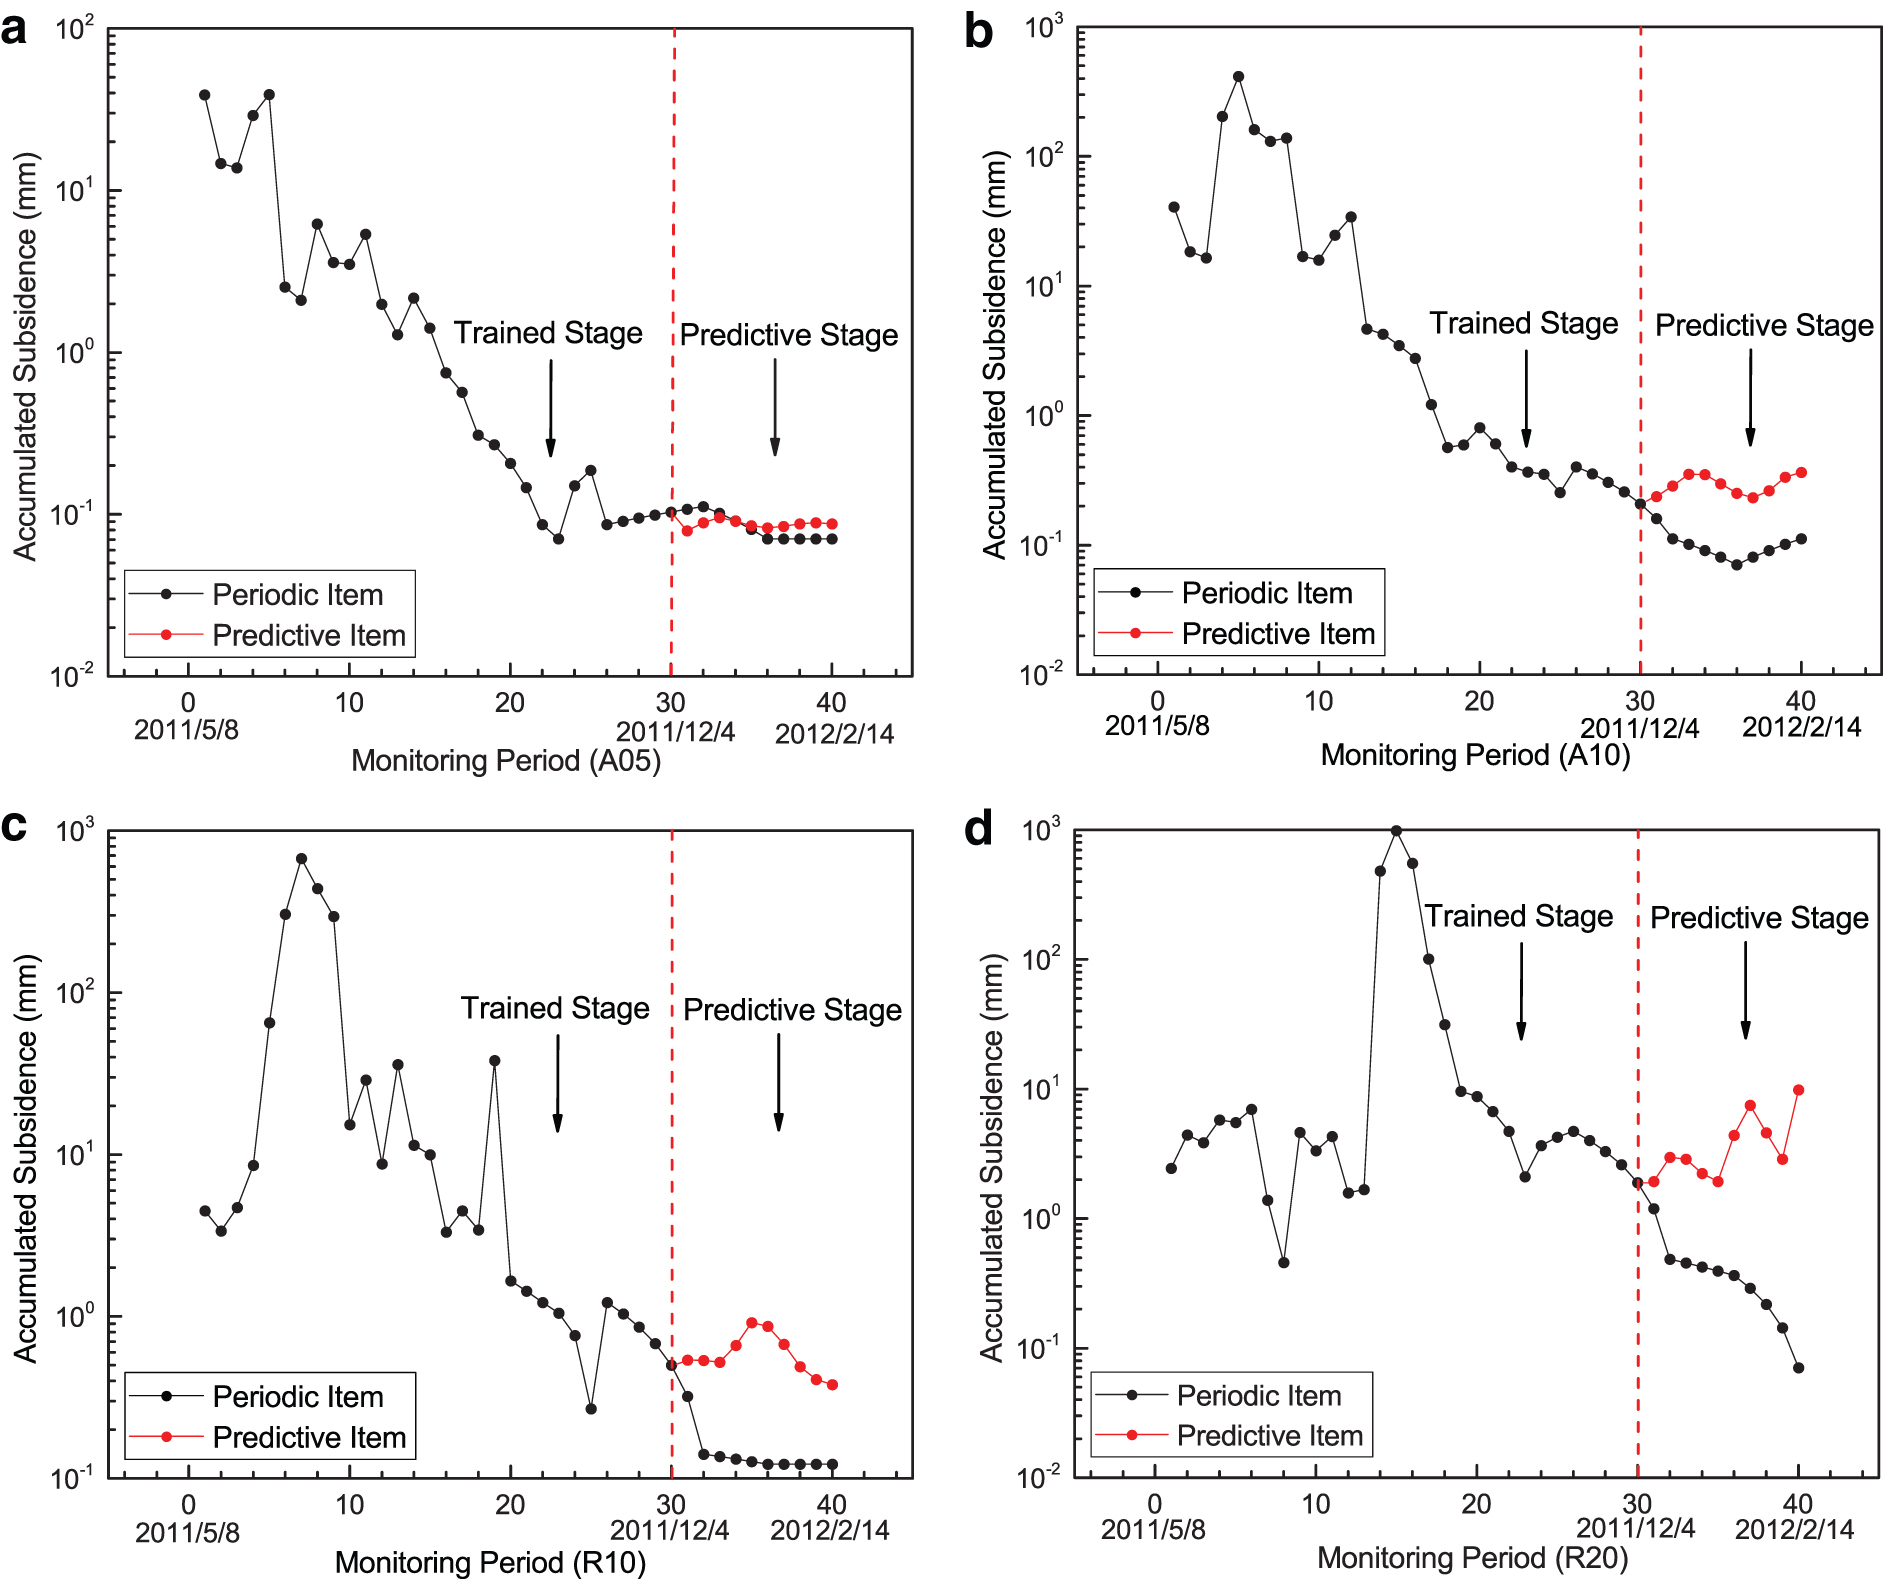
Prediction of periodic items.
The LSTM model is used to predict the periodic items. LSTM is a deep learning model that inherits the recursive cycle and temporal characteristics of a recurrent neural network. LSTM effectively overcomes the problem of gradient disappearance and can realize long short-term memory of information. 67
In this article, the LSTM-based prediction model is established in three steps: (1) data preprocessing: The data set is divided into the training set and testing set at a ratio of 3:1. Then, the minmaxscaler() function is used to normalize the training set. Then, the sequence length is set as 10, that is, the monitoring data within ten weeks are a time-series. (2) Creating the LSTM model: The LSTM model includes three layers: the input layer, the hidden layer, and the output layer. Because the training data only contain the accumulated subsidence, the input dimension and output dimension are 1, and the number of neurons is set as 100. (3) Model training: A linear activation function and the mean squared error are used as the activation function and loss function, respectively. Furthermore, the Adam algorithm is chosen as the optimization function with a learning rate of 0.005, and the number of iterations is 500.
We used the prediction model to forecast the data for the following 10 periods (Fig. 8). The results indicate that LSTM can capture the regularity of the periodic items. However, some errors exist due to the lack of monitoring data and the periodic weakening of disturbance in the later monitoring period.
Discussion of the above results
The above results indicate that (1) the surface subsidence caused by coal mining can be divided into three stages and the degree of subsidence on the central line of the monitoring area is relatively high; and (2) the Boltzmann function and LSTM model can capture the laws of the trend items and periodic items.
Moreover, the following can also be observed that:
The monitoring period is long due to GPS monitoring, resulting in insufficient data and errors among the periodic items. Therefore, it is necessary to collect the monitoring data of small particle sizes to enhance the prediction accuracy.
The displacement of the surface subsidence directly reflects the law of surface displacement, but the occurrence of displacement is related to many factors. Fewer induced factors decrease the generalization ability of the prediction model. Therefore, subsidence prediction must be combined with multiple factors to enhance the prediction accuracy.
Data interpretation for the prevention of surface subsidence
As mentioned several times, monitoring and early warning are important strategies to prevent the surface subsidence induced by coal mining. Early warning is based on monitoring data. Mining the monitoring data can timely grasp the deformation law of the surface subsidence and its development trend, providing early warning information for subsequent mining.
The subsidence characteristics indicate that the degree of subsidence on the central line of the monitoring area is relatively high and that subsidence mainly occurs in the stage of subsidence development and is sufficient. Thus, it is suggested that more monitoring devices should be arranged near the central line of the monitoring area. Moreover, to better monitor the surface deformation trend, the data acquisition frequency of the monitoring devices should be increased.
The mining of trend items and periodic items indicates that the Boltzmann function and LSTM model can predict subsidence development. The above prediction model provides data support for the development of surface subsidence induced by subsequent mining, making the early warning faster before the occurrence of geohazards and being more conducive to the evacuation of mining workers and the protection of essential facilities.
Geohazards are usually with the characteristics of group-occurring and the occurring of surface subsidence may induce secondary geohazards. The monitoring areas are located in mountainous areas, and surface subsidence may cause other geohazards, such as landslide and rock collapse. Understanding the subsidence law of the monitoring area is critical for the prevention of secondary geohazards. The monitoring of secondary geohazards should be strengthened in the regions with a high degree of subsidence, and edge-based devices should be arranged to conduct the monitoring and early warning.
Discussion
The data mining and analysis of the IoT based on edge devices have shown great potential in geohazard monitoring and early warning. Like the application of edge computing in intelligent medicine, automatic driving, and other scenarios, edge computing can also play an essential role in geohazard monitoring and early warning, which requires a low delay. The difference is that the monitoring objects are rock and soil, the monitoring area is larger, and the monitoring environment is worse. These factors present new requirements for edge computing. In the following subsections, several key problems in edge-based IoT data mining for geohazard prevention are discussed.
Key techniques in data acquisition
Sufficient monitoring data are an essential basis for geohazard prevention. Sensor networks are very suitable for geohazard monitoring scenarios due to their large-scale, self-organization, dynamics, and reliability. However, the geohazard monitoring environment is harsh, and the complex monitoring environment will lead to the failure of part of the sensor nodes; thus, the sensor network needs higher fault tolerance to avoid sensor network failure.68,69 Moreover, the monitoring period of geohazards is long, and the sensor nodes should have low consumption to ensure the continuity of the monitoring.70–72 In addition, the monitoring range of geohazards is wide and the monitoring types are various, which puts forward the requirements of low costs73,74 and more new types for sensors. For the monitoring area, reasonable distribution and configuration of sensors 75 will contribute to understanding the geological information of all aspects.
Due to the harsh monitoring environment of geohazards, some areas, such as mountains and canyons, cannot be monitored by sensor networks easily; thus, more monitoring methods need to be developed. Satellite remote sensing works well for geohazard monitoring, but the coverage period of satellite remote sensing is long and the update speed is slow, leading to the lack of flexibility in geohazard monitoring. In recent years, unmanned aerial vehicle (UAV) remote sensing systems have been widely used in geohazard monitoring and early warning due to their strong mobility, high adaptability, low altitude flight, high acquisition speed, high resolution, and low costs. Through its remote sensing images and video data, UAVs provide a data basis for monitoring and early warning,76,77 and UAVs are a powerful supplement to edge computing. Moreover, UAVs can also be used as a suitable carrier of edge computing. The combination of both makes geohazard prevention flexible and has a low delay.
Ground sensor networks and low-altitude UAV remote sensing systems can provide first-hand monitoring data for geohazard prevention and lay a solid data foundation for subsequent processing.
Utilization of 5G for data transmission
Geohazard monitoring data have the characteristics of big data, leading to an unavoidable delay in data transmission. Fifth-generation communication technology (5G) has high bandwidth, low latency, and high interaction, providing better connectivity and lower latency for edge-based applications.78–80 Moreover, to cope with the large workload, low delay demand, and harsh geohazard environment, the need for data transmission devices will be more complex, and the performance requirements will also be higher. The emerging 5G technology can better overcome the problems encountered in the data transmission of edge computing.
Application of emerging prediction models
Establishing an effective prediction model is the core task of accurate geohazard prediction.81,82 The mechanism of geohazards is a very complicated dynamic process; thus, the establishment of an early warning model needs to meet the characteristics of reliability and timeliness.
As there are many induced factors and a wide influence range of geohazards, the early warning of geohazards needs to be conducted from an overall perspective. The application of the sensor network should meet the requirements of geohazard monitoring. Each sensor node stores the monitoring data; moreover, the monitoring data between each monitoring point are dependent, and there is a correlation between the monitoring data from different sensors. Therefore, we need to mine the data from the overall perspective.
The graph neural network (GNN)83,84 provides a new idea to address this problem. The GNN is a neural network that runs directly on graph structures. A graph is a data structure composed of two parts: vertexes and edges. The edges have weights and directions, which represent the connection between two vertexes and the information flow. We can take the sensor nodes in the monitoring area as the graph network's vertexes and the sensor nodes contain some monitoring data, such as the monitoring time, geographical location, and induced indicators. Each vertex is connected to establish a connected network. The weight can be the geographical distance between two points. The closer the two points are, the closer the disaster situation between the two points. Currently, the GNN model has been widely introduced in many cases, such as traffic flow prediction.85,86 We are looking forward to applying new algorithms, such as GNNs, in geohazard monitoring (Fig. 9).
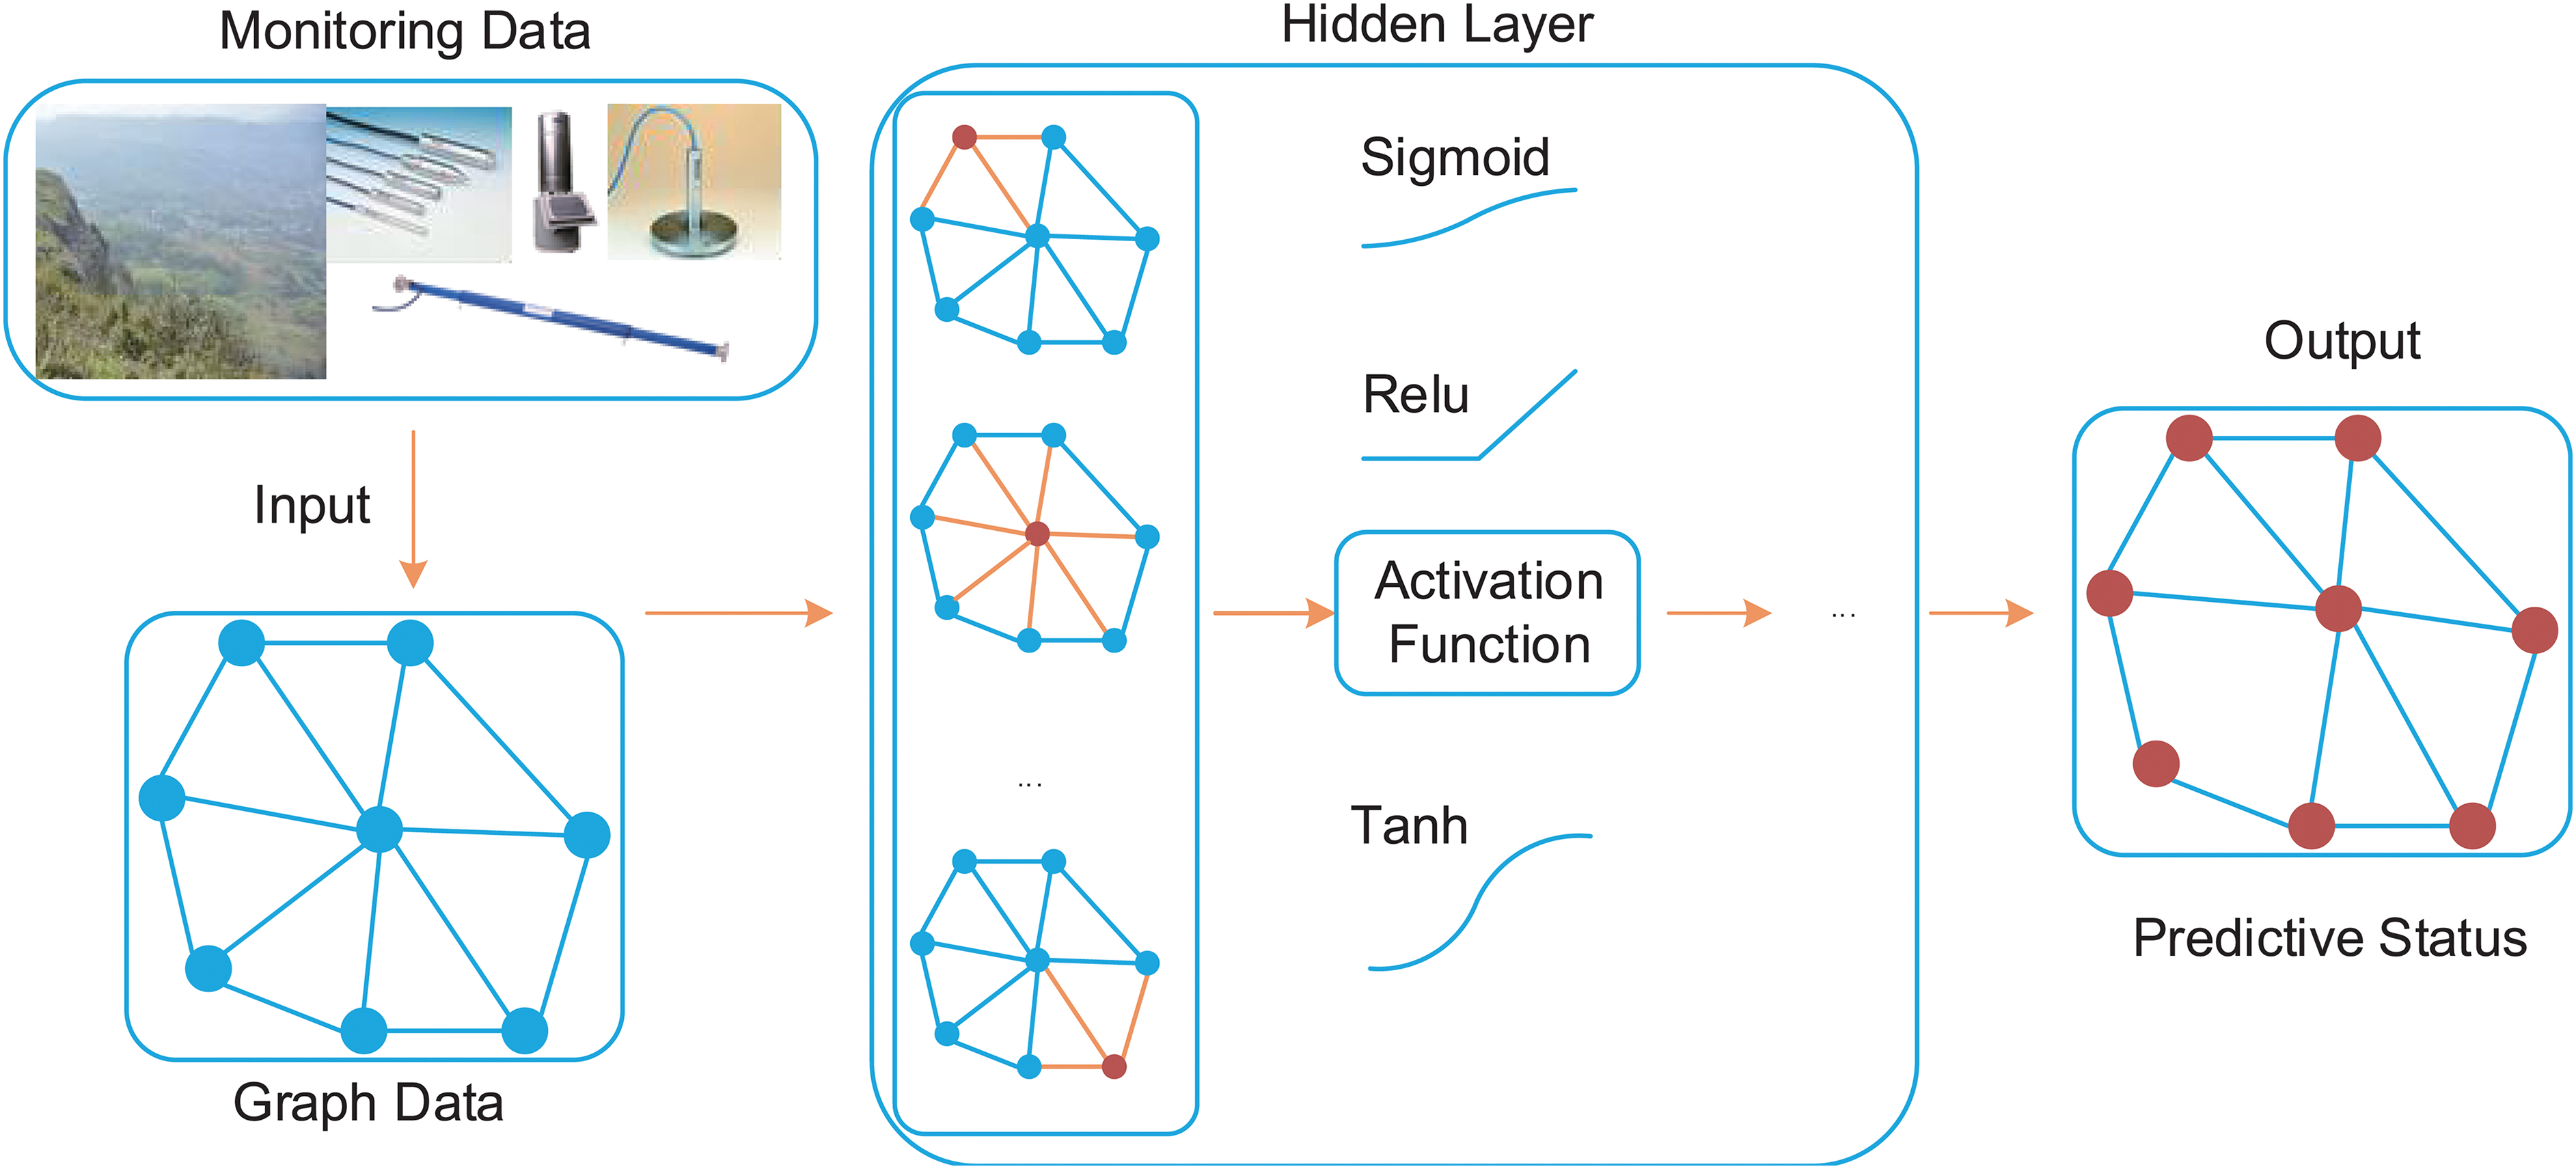
Graph neural network in geohazard prevention. Color images are available online.
Cloud computing and edge computing in geohazard prevention
Cloud computing and edge computing are different modes of big data computing. Cloud computing focuses on the overall situation, more like the command center, while edge computing is auxiliary. Edge computing and cloud computing need to cooperate closely to satisfy the geohazard prevention needs and increase the application value of edge computing and cloud computing. For example, edge computing devices are the execution units of monitoring and early warning; moreover, edge computing devices are the collection and preprocessing units of the high-value data required by cloud computing. On the contrary, cloud computing can train the early warning model through data mining and distribute it to the network edge, and the edge side can conduct early warning based on the output model.
The geohazard prevention early warning system based on edge computing and cloud computing includes three layers: the terminal layer, the edge computing layer, and the cloud computing layer. The terminal layer contains sensor network monitoring devices, responsible for collecting geohazard monitoring data, such as displacement, rainfall, and surveillance videos. The edge computing layer is mainly composed of various edge computing nodes. These nodes process the collected data, generate relevant early warning information, and send messages to pertinent users. According to the historical data and currently processed data, the cloud computing layer conducts unified scheduling for the deployment of geohazards.
The coordination of cloud computing and edge computing can maximize the advantages of both and can be flexibly deployed to conduct geohazard prevention (Fig. 10).
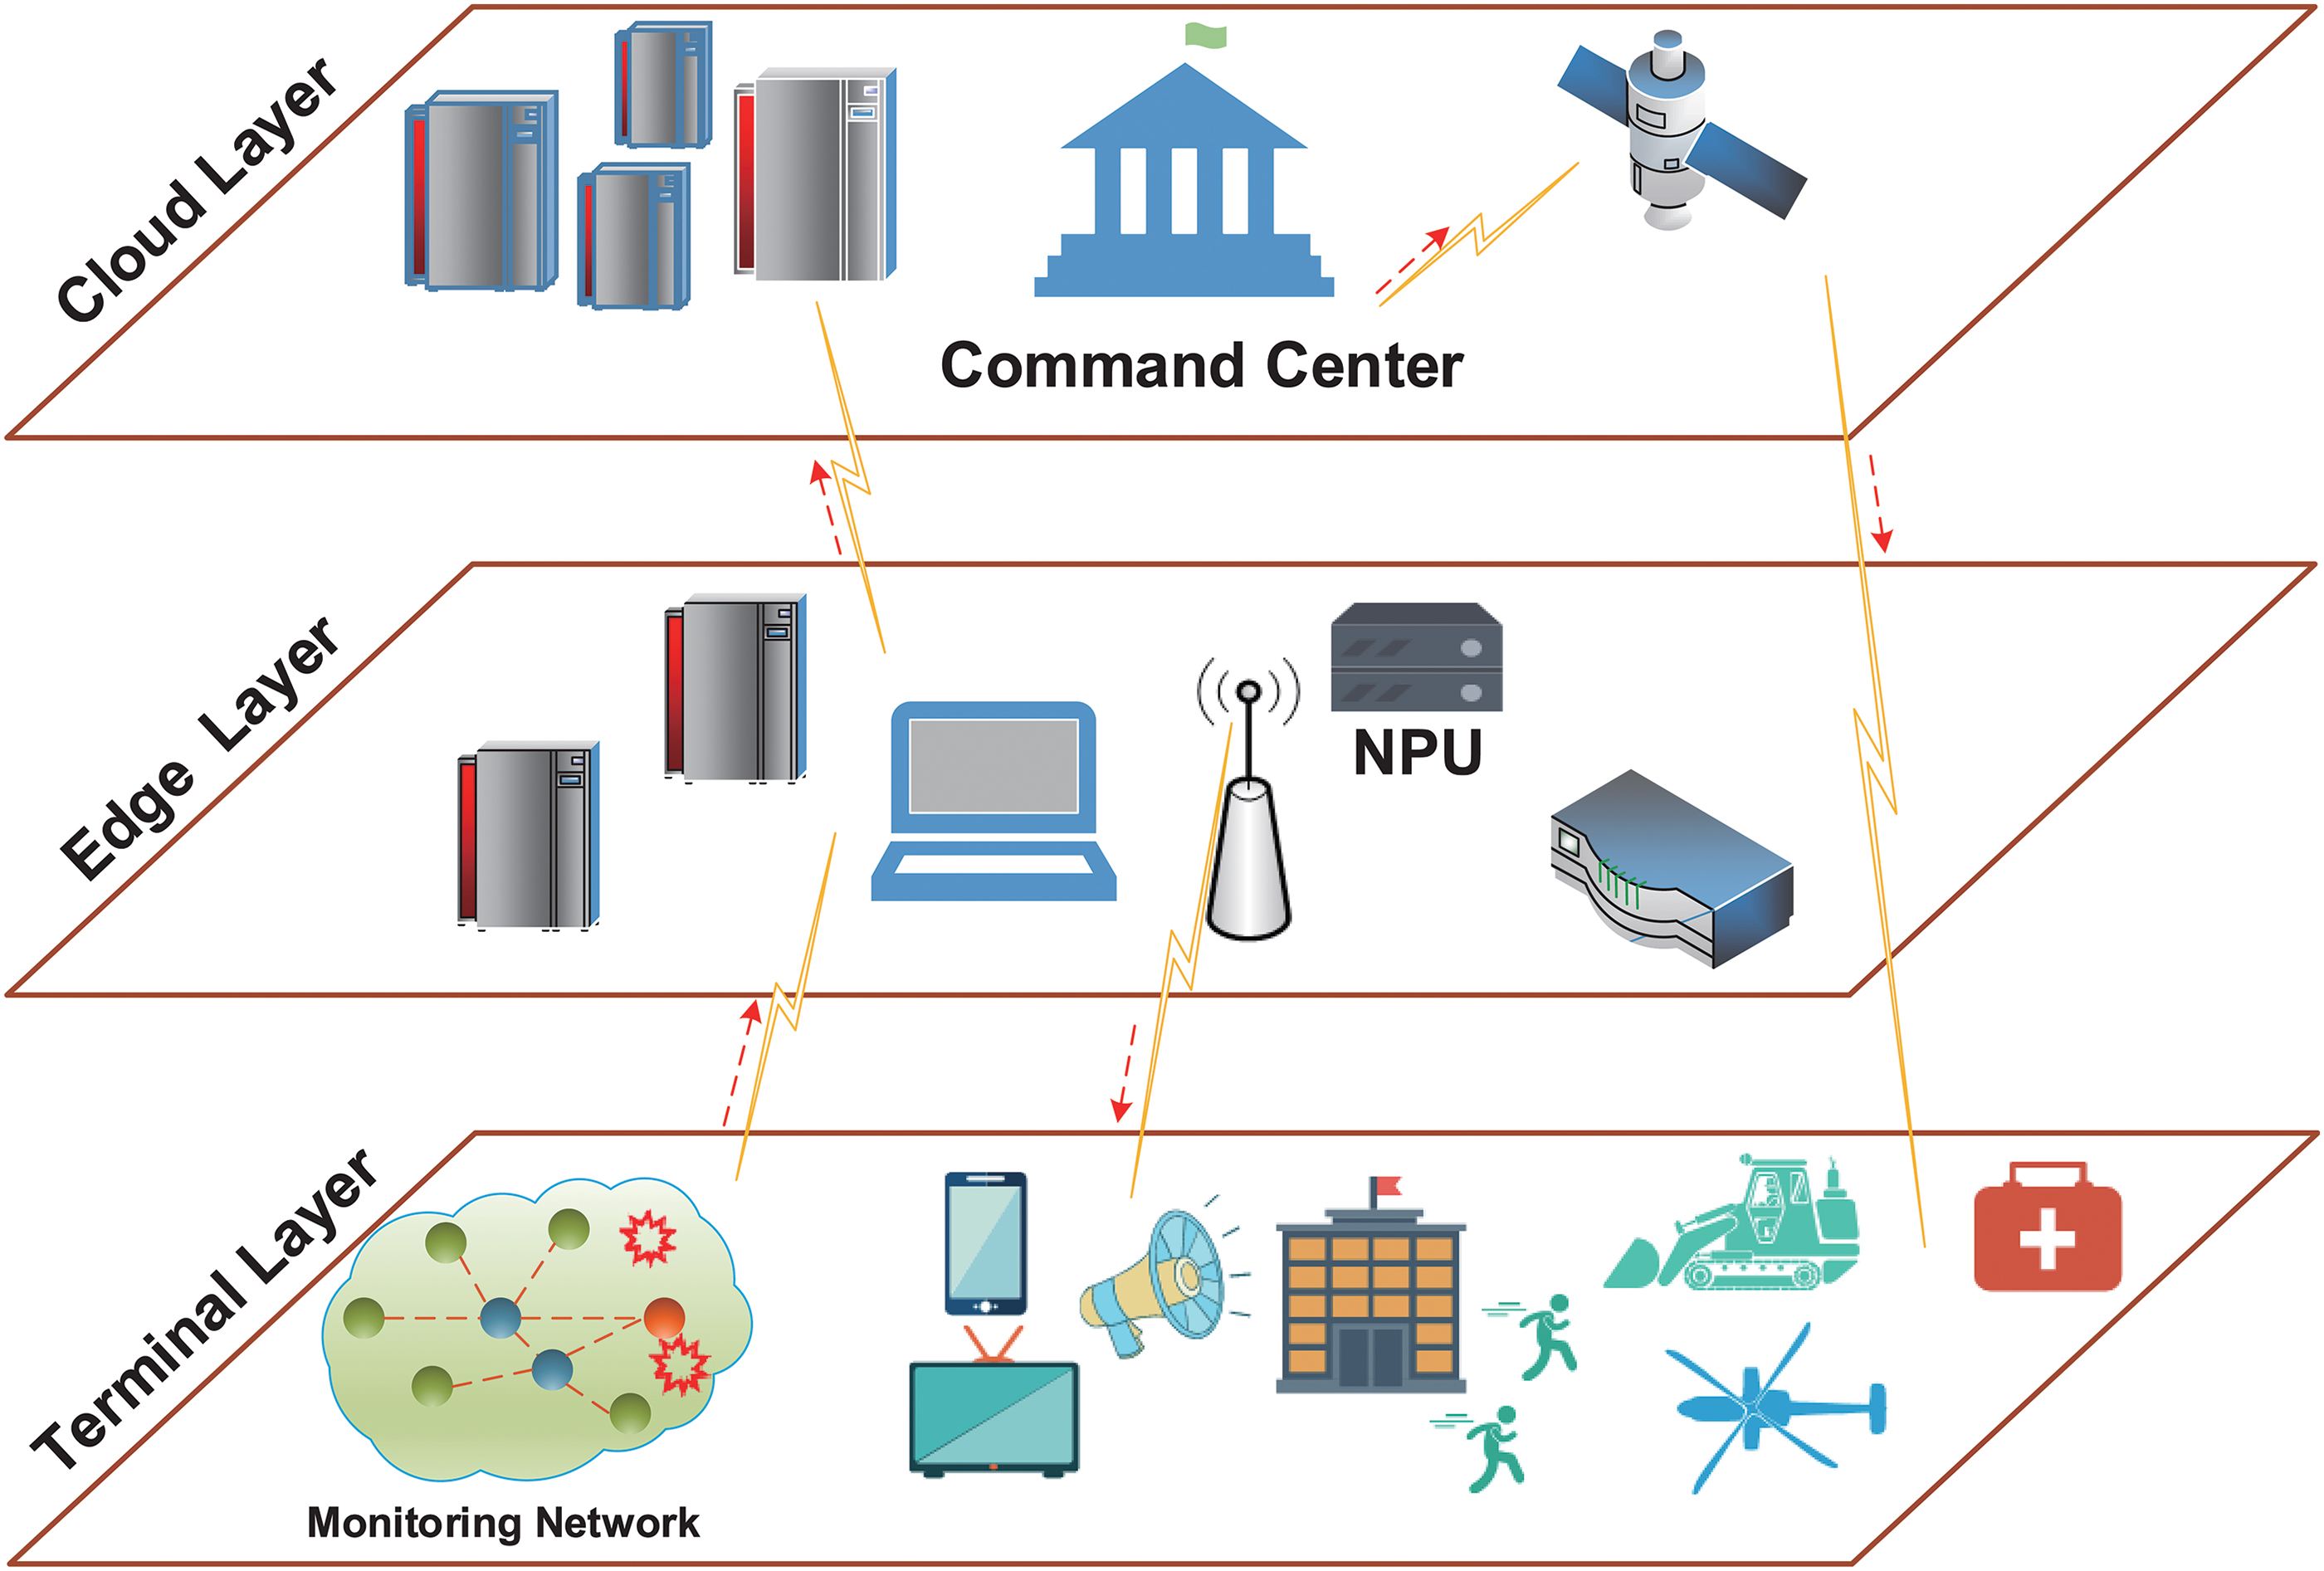
Cloud computing and edge computing in geohazard prevention. NPU, neural network processing unit. Color images are available online.
Conclusion
This article illustrates a general paradigm of edge-based IoT data mining for geohazard prevention. The combination of edge computing and geohazard prevention is usually with the characteristics of low delay, security, and reliability, and has great potential compared with cloud computing. Edge computing has not been widely introduced into the application scenario of geohazard monitoring and early warning. Thus, in this article, a general paradigm of edge-based IoT data mining for geohazard monitoring and early warning is presented, including data acquisition, data mining and analysis, and data interpretation. Moreover, a real case of surface deformation induced by coal mining is used to illustrate the details of the presented general paradigm. In addition, the challenges and potential future work in edge-based geohazard prevention are summarized as follows: (1) the harsh geohazard monitoring environment puts forward high requirements for fault tolerance, low power consumption, and the networking of sensor networks. (2) Several new techniques, such as UAV monitoring, 5G communication technology, and the GNN, could be integrated with edge computing. (3) Cloud computing and edge computing could be combined and collaborate to maximize their advantages in geohazard prevention. The presented general paradigm of edge-based IoT data mining can contribute to geohazard prevention.
Footnotes
Authors' Contributions
Conceptualization: J.Q. and G.M. Methodology: J.Q., G.M., and Z.M. Writing—original draft preparation: J.Q. and G.M. Writing—review and editing: G.M. and F.P.
Acknowledgments
The authors thank the editor and the reviewers for their contributions.
Author Disclosure Statement
No competing financial interests exist.
Funding Information
This research was jointly supported by the National Natural Science Foundation of China (Grant Nos. 11602235 and 41772326), the Fundamental Research Funds for China Central Universities (2652018091), and Major Program of Science and Technology of Xinjiang Production and Construction Corps (2020AA002).