
Abstract
This study contributes to the research on Internet of Things data visualization for business intelligence processes, an area of growing interest to scholars, by conducting a systematic review of the literature. A total of 237 articles published over the past 11 years were obtained and compared. This made it possible to identify the top contributing and most influential authors, countries, publishers, institutions, papers, and research findings, together with the challenges facing current research. Based on these results, this work provides a thorough insight into the field by proposing four research categories (Technology infrastructure, Case examples, Final-user experience, and Big Data tools), together with the development of these research streams over time and their future research directions.
Introduction
Business Intelligence (BI) is a kind of information system that is used for gathering, manipulating, storing, and analyzing raw data and transforming it into useful information for managers enabling them to make better and faster decisions and discover new business prospects.1,2 The BI systems complement corporate operational information systems such as Enterprise Resource Planning (ERP), Supply Chain Management, Customer Relationship Management, etc. and offer organizations a great potential to improve organizational efficiency. 3
A BI system is composed of three components 4 : a technological component, which includes a broad range of analytical software for diverse organizational provisions 5 ; a human component, consisting of system developers and managers with a high level of analytical skills; and the business process, which will underlie the transformation of information into knowledge. The evolution of these three components has allowed three generations of BI systems to be established.
The first generation of BI appeared in the 1990s. It was characterized by highly formatted reports developed by IT personnel using proprietary BI tools embedded into companies' desktop or client/server applications, and it communicated by proprietary application programming interfaces. The second generation of BI started in the 2000s. Using data warehouses and dashboard-building tools, analysts and business users were able to access large amounts of structured and unstructured data and could create intuitive drag-and-drop reports by themselves. 6
Data were usually extracted from corporate operational computer systems and then transformed and loaded into an enterprise data warehouse and centralized metadata repository, using extraction transformation migration and loading (ETML) tools, such as Apache Spark. The next step was to cluster them in Data Marts. On-line analytical processing (OLAP) tools, such as Oracle Business Intelligence Enterprise Edition (OBIEE) and IBM Cognos, were used to calculate and display indicators in user interfaces such as dashboards, spreadsheets, etc. 7
Today, the third generation of BI is characterized by (1) organizations' awareness of the possibilities of BI to create a competitive advantage and therefore of the need to develop a Data-Driven Business Strategy where data are used to create more value, to keep costs down, to drive additional sales, to engage customers more fully, and to improve process efficiency; and (2) the exponentially increasingly multi-structured data sets that companies have to analyze in an efficient manner, with Internet of Things (IoT) sensors and web 2.0 tools being the major contributors. 8
An integral part of today's generation of BI systems is IoT data visualization for business analytics processes. The IoT provides massive amounts of data emitted from multiple connected sensors that, once gathered, analyzed and displayed, can be used by managers to support their decision making. Data visualization is essential in this process, since it allows managers to gain a proper understanding of the underlying patterns and results obtained by analysis algorithms. 9 Data Visualization in BI must consider the business objectives and the evolving needs of users, taking into account high-level semantics, reasoning about unstructured and structured data, and providing simplified access and a better understanding of data. 10
However, although IoT data visualization enhances the productivity and efficiency of the business, different authors have shown that there are numerous challenges and factors that affect the use of IoT data visualization for BI processes that must be identified and studied. 11 These include volume and variety of data, heterogeneity of devices, necessity of scalable and efficient storage infrastructures, data security and privacy, reliable validity of marketing segmentation, inexperienced users who do not know what type of information they want to extract from data or which would be the best type of visualization or who are wrong in their interpretation, 12 and financial management issues.
To date, no literature review has examined the IoT data visualization for BI processes. To address this gap, this article synthesizes the body of knowledge on IoT data visualization for BI processes and establishes research categories that bring together research conducted on the basis of relevant common points. In particular, in this study, the following research questions (RQs) are posed:
RQ1: Which are the top contributing authors, countries, papers, institutions, and publishers in the field of IoT data visualization for BI processes? RQ2: Is it possible to classify research papers on the basis of relevant common points? RQ3: What are the future research necessities in the field of IoT data visualization for BI processes?
To answer the earlier RQs, this article (1) carries out a systematic review of the literature on IoT data visualization for BI processes, since it is an efficient research method that allows a precise evaluation of the information published to date 13 ; (2) provides a thorough insight into the field by using bibliometric analysis techniques to evaluate 237 published articles, and to identify top contributing authors, papers, countries, publishers, and institutions related to the field; (3) identifies and proposes four established and emerging research categories that would encourage scholars to expand research on IoT data visualization for BI processes; and (4) identifies the future research necessities in each research category.
This article is organized as follows: The Research Methodology section describes the software tools and the research methodology used to perform the bibliographical analyses. The Findings section offers the findings of the bibliographical analyses. Finally, the Conclusion section discusses the findings as well as the conclusions, research limitations, and future work.
Research Methodology
To answer the earlier mentioned RQs, a semi-structured literature review was selected because it makes it possible to understand the state of knowledge, to identify the historical evolution, and to develop a research agenda. 14
Among the various text-mining and grouping methods to extract nontrivial patterns and knowledge from textual and unstructured documents written in natural language, probabilistic topic modeling can be highlighted.15,16 A topic model is normally defined as an approach for discovering the latent information in a corpus. This method takes into account two essential aspects: (1) Words can have multiple meanings; and (2) interpretations and documents may contain one or more topics. 17 One of its main applications is the classification of documents, which has received significant attention. In general, document classification problems are solved following this sequence: (1) coding each word or document with a numerical vector, and then (2) classifying documents. 18
In this study, to provide insights into the main topics, the machine-learning algorithm Latent Dirichlet Allocation (LDA) was applied instead of other topic modeling such as Latent Semantic Analysis (LSA) or Probabilistic LSA. The LDA, an unsupervised topic modeling approach, was selected because among the different methods it is the simplest and most popular,19–21 it can be applied to different kinds of problems, 22 it allows to obtain good performance, 23 it can be used to quickly identify thematic clusters in large documents, 24 it can significantly reduce the workload involved in the screening phase of a systematic review, 25 and it is not necessary to have any knowledge in advance about the topics. 26
The LDA was carried out in Python by using several libraries. The core libraries include data science libraries such as Pandas and NumPy for handling the data, and Gensim library, written by Radim Rehurek, an open-source NLP library intended for unsupervised topic modeling. 27
The LDA works by assuming that each document is a probability distribution of topics and each topic is a probability distribution of words from the document. The idea is that documents are “represented as random mixtures over latent topics, where each topic is characterized by a distribution over words.” 15 The LDA is based on three concepts: the corpus (the text collection), the document (one item within the corpus), and the terms (the words within a document). Then, the aim of the LDA algorithm is to infer topics from recurring patterns of word occurrence in the documents. Topics are heuristically located on an intermediate level between the corpus and the documents and can be imagined as content-related categories, or clusters. 28 Five steps were carried out to apply LDA (Fig. 1).

Research methodology.
Building and preprocessing the corpus of documents
The first step was to select the data sources, which in this case were Scopus and Web of Science (WoS). Although there are other popular interdisciplinary databases (DBs) such as Google Scholar, the low-quality data found in Google Scholar raises questions about its suitability for research evaluation. 29 Scopus and WoS are the main sources of bibliographic citations used for bibliometric analyses. This is mainly because (1) they are the only ones that combine both a rigorous selection process and wide interdisciplinary coverage, which make them significantly stronger than the other DBs 30 ; (2) they are the two world-leading and competing citation DBs.
Although, during the past decade, there was a significant growth of available bibliographic data sources and metrics, WoS and Scopus DBs still remain the two major and most comprehensive sources of publication metadata and impact indicators. Therefore, they serve as the major tools for a variety of tasks: from journal and literature selection or personal career tracking to large-scale bibliometric analyses and research evaluation practices in all possible levels 31 ; and (3) both DBs are constantly being improved due to the intense competition and notable transfer of academic activities into a digital Internet-based environment. 31
The selection of articles and reviews was carried out by identifying those that had certain keywords in the title, in the keywords section, or in the abstract (Table 1). The keywords used were organized in three sets: IoT, data visualization, and BI, with all the possible synonyms and terms related to them. The search was conducted in October 2020, and the results were limited to papers in English published in journals and at conferences as of 2009. The fields of research were also limited to the following areas: Business, Management, and Accounting; Computer Science; Economics, Econometrics, and Finance; and Engineering.
Search strategy
Data cleaning and preprocessing of unstructured text data
To generate significant topic modeling, data in the corpus were cleaned. Different methods were used to do so 24 : removing punctuation and tokenization (segmenting documents into case words); making bigrams and trigrams using the n-gram language model (two/three words frequently occurring together in the text, e.g., “decision” and “making” become “decision making); stopping (removing punctuation and the so-called stop words, e.g., conjunctions and any meaningless words); and lemmatizing (converting word to its meaningful base form, considering the context, e.g., “assessing” and “assessment” become “assess”).
Model selection
Once the corpus had been cleaned, the LDA algorithm developed by Blei and Hoffman 32 was implemented for topic modeling. This algorithm is based on online stochastic optimization, and it learns the Dirichlet hyperparameter α document-topic density directly from the data. The Dirichlet hyperparameter β word-topic density was fixed at the value of 1/K as proposed by the topic model library that was used: gensim. 33 The number of topics K was set, taking into consideration the topic coherence metric.
Topic validity and labeling
To ensure the validity and interpretability of the results, a content analysis was carried out independently by the authors with the objective of checking whether the topics depict relevant research issues and whether a topic should be discarded or whether two or more topics should be merged. Once the topics had been validated, a label was assigned to each of them.
Presentation of findings
After the identification, validation, and labeling of topics, the analysis tools available at WoS and Scopus were used to perform a biographical analysis by using descriptive statistics. Finally, a content analysis of the papers belonging to each of the topics was carried out to identify the main research conducted, the main conclusions, and the future research directions in all the research categories.
Findings
Initial results
The initial search was conducted in October 2020 and resulted in 230 journal papers and 194 conference papers. The initial set of papers were filtered further by reading the titles and abstracts to check coherence with the RQs and eliminate duplications. This filtering led to the final set of 126 journal papers and 111 conference papers, giving a total of 237 papers.
Figure 2 shows the evolution in the number of publications. It has increased considerably in the past six years, and a boom can be highlighted as of 2019 and 2020.
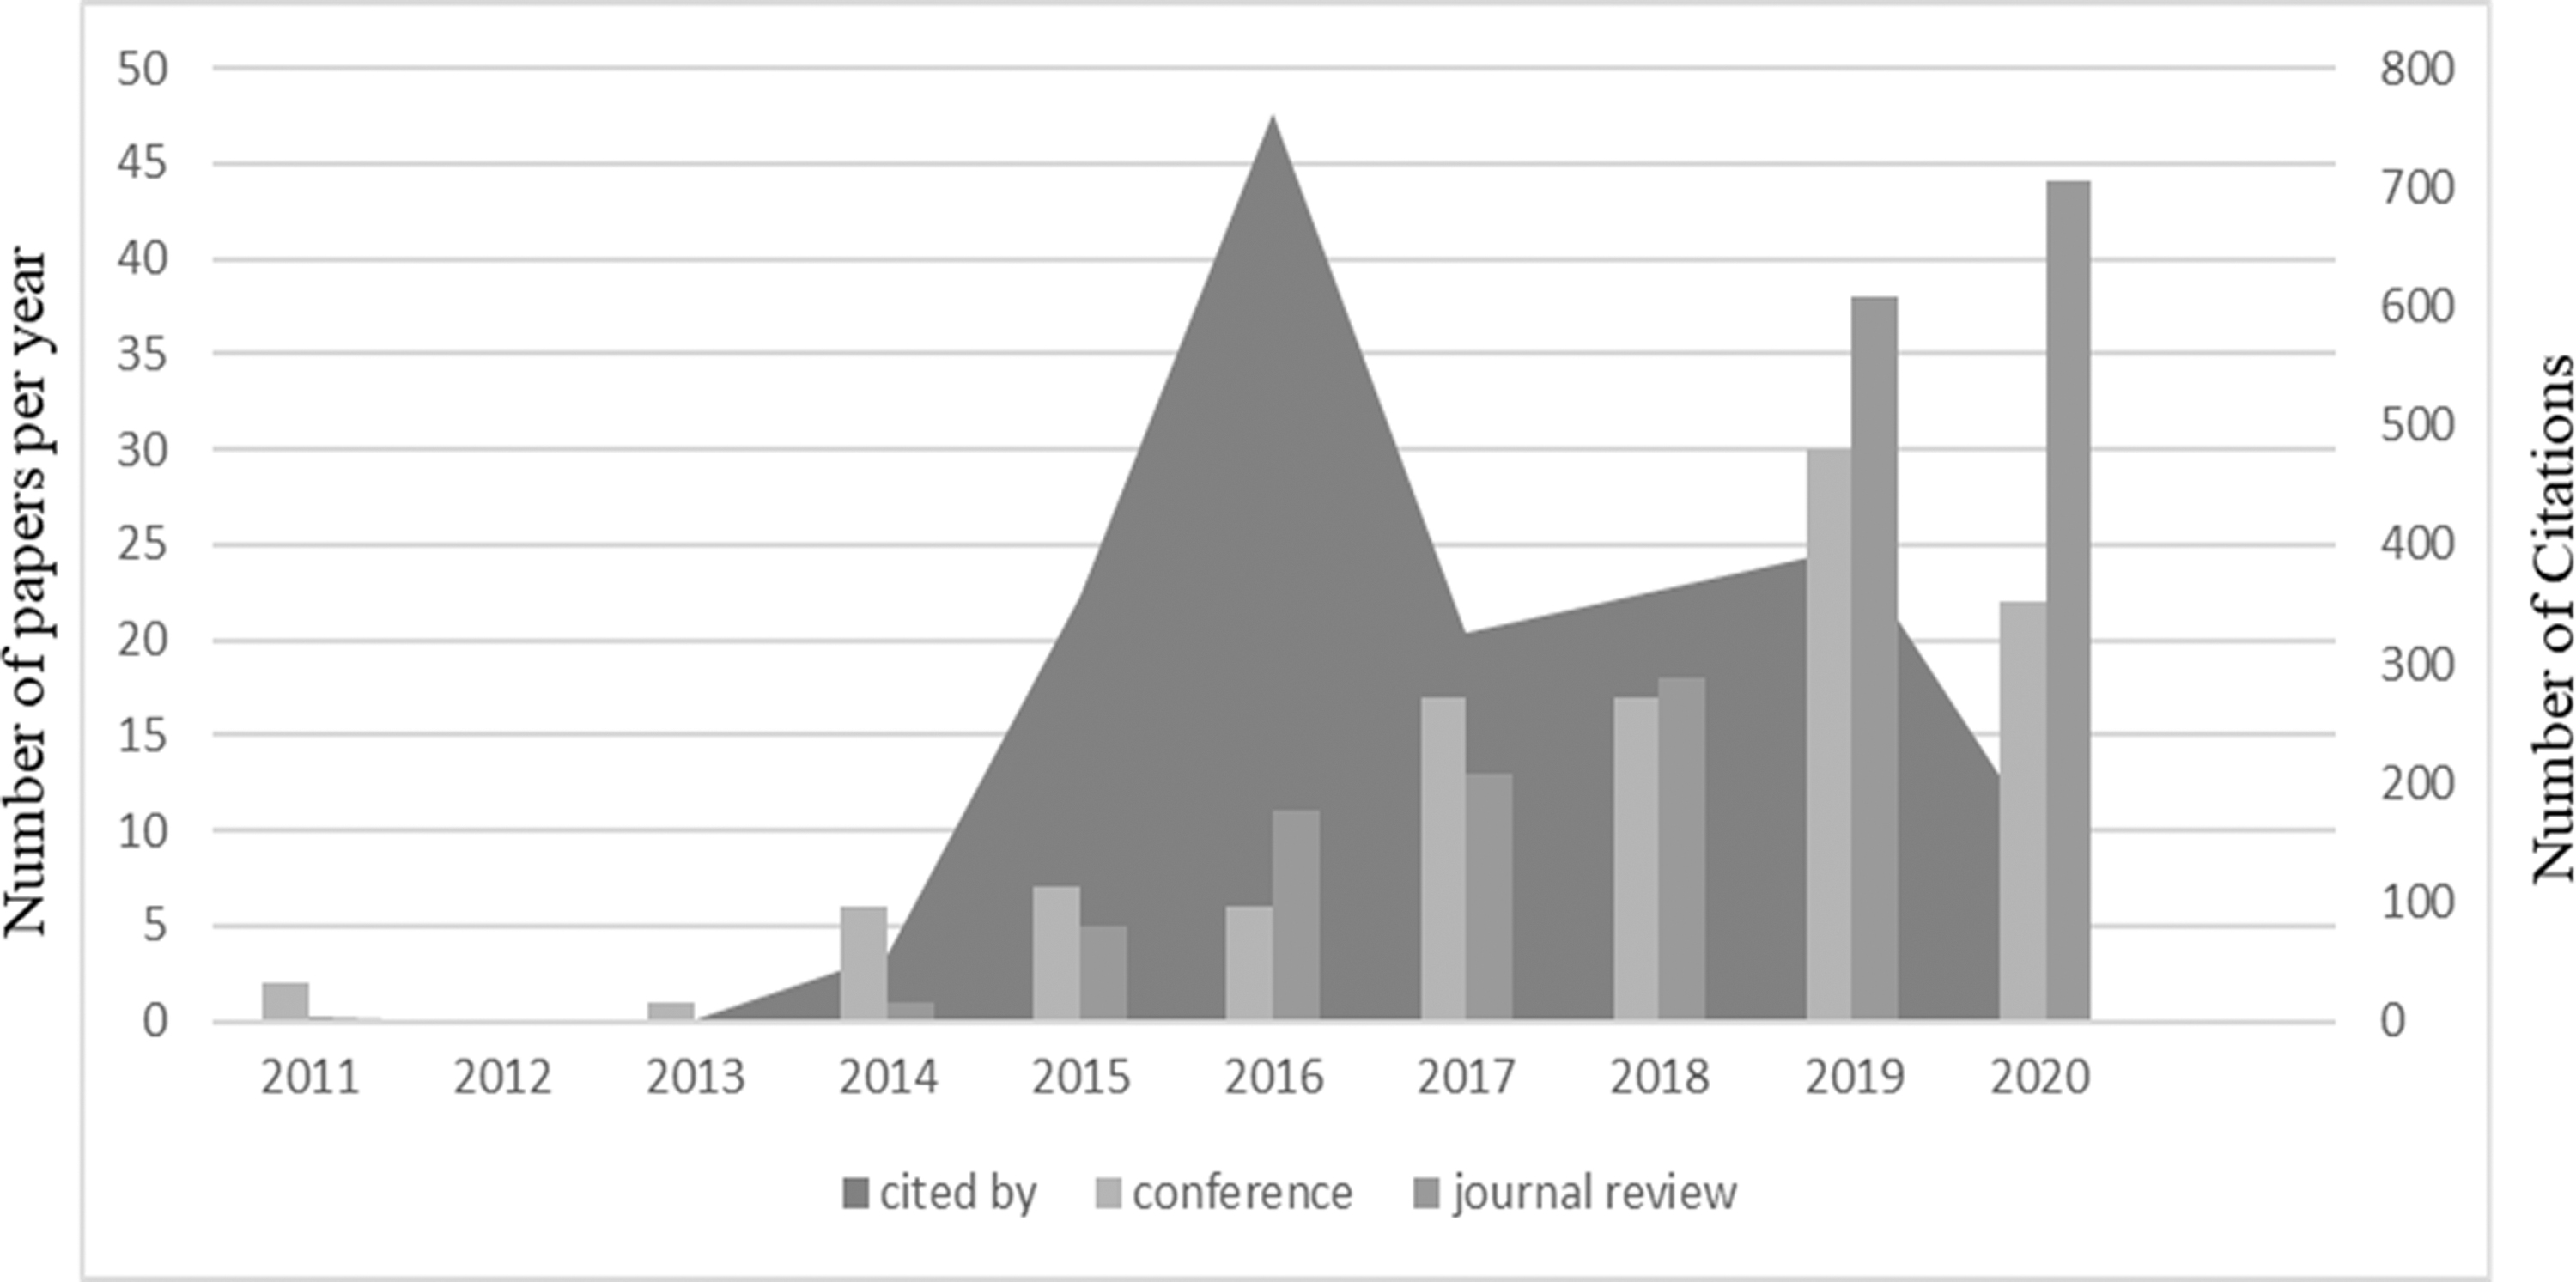
Trend in the generation of articles.
A bibliometric analysis was carried out over these 237 papers. Tables in the Appendix A1 report the top contributing authors (Appendix Table A1), countries (Appendix Table A2), institutions (Appendix Table A3), paper citations (Appendix Table A4), and publishers (Appendix Table A5) in the field of IoT data visualization for BI processes.
Findings show that (1) there is a small number of experts in the field; (2) the distribution by countries reveals the leadership of China, followed by the United States, India, and Germany; (3) the most cited papers are focused in Big Data; (4) no institution is detected that stands out significantly in terms of the number of publications; and (5) three sources stand out over the others: ACM International Conference Proceeding Series with 14 publications, followed by Advances in Intelligent Systems and Computing publications, and Procedia CIRP both with 11 publications.
Papers classification
Eighteen LDA models were calculated, with the number of topics K varying between 3 and 20. From these, the model with six topics was selected because it was the one with the highest coherence value (the coherence score increases rapidly until topic 6, and then starts to follow almost a horizontal trajectory) whereas it had the least repetition in words and better interpretable topics. Therefore, as suggested,44,45 we selected k by using a reasonable practice of evaluation among alternative values in such a way that the interpretation of the machine-generated model results becomes as easy as possible from the point of view of a human reader.
Then, the validity and the interpretability of the topics were assessed and, as agreed by the authors of this article, two topics were merged in one topic, and other two topics were merged in one topic too, since the papers discussed similar issues. The four topics are:
Topic 0, Technology infrastructure. This focuses on the technology architecture/infrastructure of the system and proposes available analysis methods, tools, and technologies.
Topic 1, Case examples. This focuses on analyzing and proposing solutions (ad-hoc or general) for real problems in different areas of enterprise/industry.
Topic 2, Final-user experience. This topic focuses on the final-user experience.
Topic 3, Big Data tools. This topic focuses on how Big Data tools/methods can be used in this field. It seems that Big Data is very important in this field and requires a topic of its own.
Table 2 reports the four validated topics identified along with the top 10 words and the number of papers.
Validated topic model
Regarding the number of papers in every topic, it has been increasing every year, being topic 3, Big Data tools, the one with the most significant progress in recent years (Fig. 3).
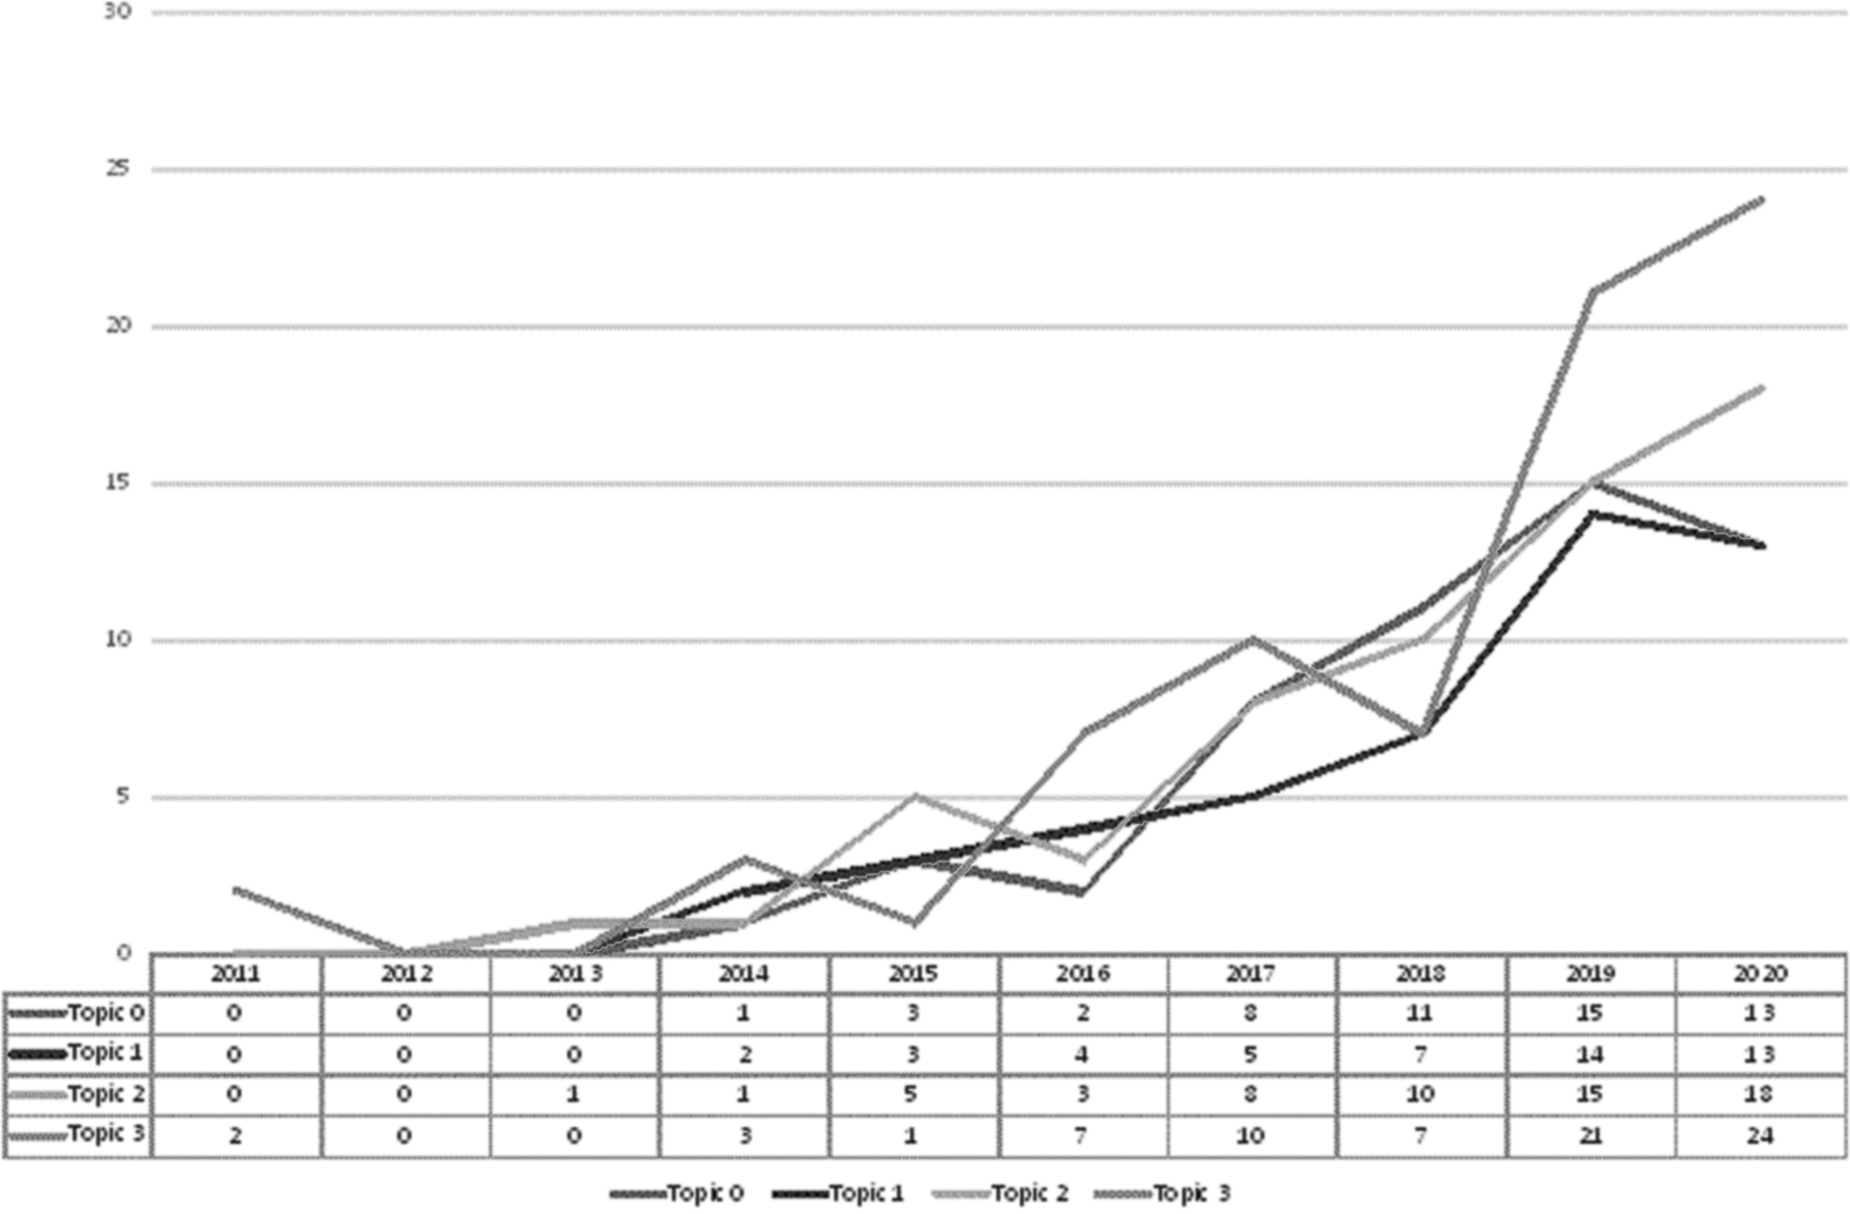
Number of papers per topic and year.
State of the art in each topic
In the following, the main research lines identified in each topic are shown (Fig. 4).

Main research lines identified in each topic.
Topic 0, technology infrastructure
On considering 53 papers on the topic “Technology infrastructure,” which are primarily focused on transformation toward industry 4.0 by means of Information and Communication Technologies (ICT), two major research lines can be inferred: (1) papers that use modern technologies to manage energy consumption and to achieve more sophisticated monitoring methods, and (2) papers that made an effort to enhance optimization and productivity in businesses.
Research line 1: papers that use modern ICT to manage energy consumption and to achieve more sophisticated monitoring methods
In this research line, several papers paid special attention to develop the Iot technological infrastructure for monitoring buildings and construction sites. Zach et al. 46 presented a scalable approach to monitoring buildings and processing the data by means of data preprocessing algorithms and virtual data points. The good point about their work is that software interfaces are independent of the hardware and can be supported simultaneously, which allows batch processing for various applications. Donnal et al. 47 believed that to monitor, measure, and control power consumption, high-performance low-cost computers should be employed to make local analysis possible.
They proposed the construction of an energy box around these computers as a nonintrusive load monitor to provide the end-user with visualization of power consumption and the generation of custom reports by means of an integrated scripting engine. Song et al. 48 developed an IoT platform that can monitor and refine the air conditioning operation habits in a house. Their development employed a deep belief network algorithm to analyze the data and recognize consumption patterns, a cloud server to collect the data, and visualization techniques to display power consumption. This resulted in a reduction in energy consumption.
Another monitoring system, proposed by Zhang et al. 49 could recognize nonhardhat use, which is considered a crucial safety measure on construction sites. Their IoT-based proposal took advantage of sensors, radio-frequency identification (RFID) triggers, smartphones, a web-based application for data visualization, and a cloud server that store and retrieve the collected data. In terms of consumption management, Assad et al. 50 introduced a framework, based on the use and incorporation of virtual models, to predict the key performance indicators (KPI) in energy consumption in manufacturing systems before being set up.
Therefore, they use the VueOne virtual engineering tool to achieve the best energy-efficient production systems. Finally, another interesting study was carried out by Jin et al., 51 who attempted to eliminate some of the problems on a construction site, including detecting and locating errors and identifying intruders, by developing an intrusion monitoring system based on IoT. To develop their system, they took advantage of five key components, including RFID triggers, safety hardhats, a backend cloud server that would be contacted by a smartphone application, and a web-based management platform.
Other papers in the same research line focused their state-of-the-art monitoring approaches on other areas. Gao et al., 52 Kurniawan et al., 53 and Pachayappan et al. 54 proposed an IoT-based management system for farmlands that used multiple sensors to gather monitoring data belonging to the weather, soil, and plant conditions such as soil humidity, pH, the wetness of leaves, etc., intending to ensure the satisfactory situation of the planting environment, improving the economic return, and achieving better control over the state of the planted crops in real time.
The studies by Gao et al. 52 and Kurniawan et al. 53 were published in the same year and were somewhat similar but with some differences, especially in the hardware they used. Thus, the former employed RFID and ZigBee, and the latter implemented Wemos D1 mini and Arduino. Another paper by Alam et al. 55 presented an integration of the IoT with augmented and virtual reality technologies to monitor and maintain the system and ensure the safety of the personnel in an extreme environment. Their emphasis was on using mobile computing equipment on the workers' side and processing real-time data.
Although the last four papers mentioned aimed at dealing with real-time data, Tan et al. 56 managed to perform data mining and at analyzing and visualizing historical data on the quality of the manufactured products to discover and monitor the performance trend of the business. In addition, Benedetto et al. 57 attempted to solve some consumption management problems by deploying sensors on the production line.
Research line 2: papers that use modern ICT to enhance optimization and productivity in businesses
The second research line is mostly concerned with developing the technological infrastructure to enhance business optimization and productivity. To attain optimization of production and productivity in the manufacturing lines of factories, Jinushi et al. 58 suggested a comprehensive system based on IoT that covers the collection, aggregation, and visualization of data, to lessen the workers' responsibility and support decision making. To make optimal decisions and improve the business in the food industry, Goti-Elordi et al. 59 combined and integrated data from different Iot sources by using BI tools.
To have a productive business, the discover-innovate-predict-perform-sustain model based on the analysis of Iot data was introduced by Rane and Mishra. 60 Apart from that, Yu et al. 61 exploited information technology to propose a Building Information Modelling (BIM)-based smart management model for a construction site to increase productivity and efficiency. They deployed IoT, cloud computing, and Big Data analytics to attend to the issues related to data analysis and storage, augmented and virtual reality, digital processing to preprocess the components before transporting them to the construction site, and three-dimensional scanning to detect probable errors in measurements.
Finally, in an attempt to optimize various areas of smart sustainable cities such as freight logistics and citizens' transportation, Beneicke et al. 62 considered using analytical tools, hybrid simulation–optimization techniques such as agent-based simulation, and machine-learning algorithms, to analyze Iot data to enhance citizens' behavior insights and cognition.
Topic 1, case examples
Topic 1, Case examples, comprises all the papers that have proposed solutions (ad hoc or general) for real problems in different business sectors and corporate areas (48 papers). Different business sectors have been considered: Energy, Health, Building/construction, Smart Cities and transportation, smart factories, Telecommunications, B2C companies/Business Shopping, Geography/Environment and Agriculture, Mining Industry, as well as other proposals suitable for enterprises in any business sector.
On the other hand, the corporate functions that have been studied are: Strategic Planning. Manufacturing, Facility Management, Human Resources Management, and Risk Management, and there are proposals suitable for any corporate function. Appendix Table A6 in Appendix A2 synthesizes the Topic 1 proposals by business sector and corporate function.
In addition to Topic 1 papers, Appendix Table A6 in Appendix A2 also includes proposals of papers that belong to other topics and have some kind of example of application. These proposals include the topic number of their paper in brackets. They have been included in Appendix Table A6, because in this way the table contains all the real applications of IoT data visualization for BI processes that have been carried out so far. Therefore, this information is gathered in one place for practitioners.
Topic 2, final-user experience
The second most addressed topic in the pool of papers is “Final-user experience,” with 61 papers primarily focused on data visualization techniques and their application. These papers can be classified into three noticeable research lines: (1) those that made an effort to facilitate human–computer interactions through visualization and simulation and to improve user experience, (2) those intended to develop smart visual monitoring systems, and (3) those that attempted to develop easy-to-use visual intelligent decision-making systems.
Research line 1: Papers that attempt to facilitate human–computer interactions through visualization and simulation
Within this first research line, there are several examples of papers that are mainly focused on human–computer interactions using visualization methods. Pfeffer et al. 92 believed in using interactive surfaces as a means to facilitate collaborative work, as well as virtual and augmented reality (AR) to help in problem-solving by representing a product virtually. They illustrated a comparison between possible future technologies deployable in manufacturing plants and the current methods to demonstrate how plant control is going to be changed.
They believed that the integration of data collected from various steps in a product life cycle may help the internal and external stakeholders share the information collaboratively. An example of this was developed by Rubart et al. 101 They presented an interactive BI digital boardroom that would enhance user experience and promote the level of interaction between analysts and planners. They made use of a multi-display environment along with multi-touch and multi-user interaction approaches to display data visualizations.
In addition, Shao et al. 102 introduced an IoT-Avatar architectural framework based on mixed reality for human–computer interactions in an IoT system. Their system was adaptive, flexible, and engaging and also included a two-way communication method between the IoT system and the representation of the virtual avatar character to deal with the bandwidth deficiency within IoT system communication. Finally, Yun et al. 103 attempted to support decision makers in the industry by proposing a novel visual human–computer interaction decision-making system based on data-mining techniques.
To evaluate the performance of the proposed method, the authors applied various data mining algorithms and assigned different values to the key parameters, and then proved that their method was robust and effective. Table 3 shows a summary of the problems that these papers are trying to solve and their proposed techniques.
Visual human–computer interactions proposals
AR, augmented reality; BI, Business Intelligence; IoT, Internet of Things.
Research line 2: Papers that attempt to develop smart visual monitoring systems. These papers are focused on monitoring Smart Factories, Smart Buildings, and Health.
Regarding smart factories, Bojan et al. 93 presented a generic architecture to deal with the visualization of large-scale time-series data that can be employed in various systems, if they work with structured data. Using cloud computing in data collection, as well as sensors and actuators, they managed to implement their proposal on a farm and decreased the number of workers. In addition to this, to prioritize end-user attention in high-volume fast data streams, Abuzaid et al. 104 developed a search engine called MacroBase to work with fast data that classifies and explains fast data to the end-user with the help of a combination of streaming classification and data explanation techniques and would lead to an increase in performance.
Moreover, to monitor the organoleptic properties of the food products in an Iberian ham manufacturing company, García-Esteban et al. 105 proposed a software platform called ICatador based on cloud manufacturing, which consists of four collaborative agents. In this proposal, they made use of advanced visualization techniques, communication technologies, and artificial intelligence (AI) techniques, mainly to facilitate quality testing for the professional taster. Further, to facilitate monitoring of the condition of the machines by the engineers in the manufacturing industry, Olivotti and Eilers 106 proposed a visualization technique that exploits sensor data, with the aim of detecting the reasons underlying anomalies, optimizing maintenance efforts, and increasing the availability of machines.
In addition, Iftikhar et al. 107 used machine-learning techniques to produce a solution for real-time analysis and dynamic visualization of the sensor and ERP data in smart manufacturing companies to detect possible future faults. Finally, Gu and Gao 81 proposed a visual particle system in digital twins capable of predicting and monitoring industrial production processes and would succeed in reducing production costs. Their system is helpful in terms of the limitations of current digital twin systems regarding simulation and is capable of simulating more complex objects such as gas and fluid.
With regard to smart buildings, some authors contributed to the transition from regular buildings to smart buildings by employing visualization along with other technologies. Fraternali et al. 108 developed a platform in which they visualized the data gathered from smart meters and sensors to display energy consumption patterns in an understandable way for a wide range of users and to give them adaptive recommendations regarding energy saving while encouraging them to collaborate. Their proposal also took advantage of gamification methods to promote awareness and make durable behavior changes toward sustainable energy consumption.
To improve current visualization techniques in a building that are deficient in interaction and immersiveness, Carneiro et al. 109 presented an approach based on IoT by integrating AR technologies and smart buildings, and they provided effective interactive AR visualizations for the occupant to monitor the energy consumption and learn about the interconnection of the building system. In addition, Kazado et al. 110 mentioned that BIM is a virtual presentation of a building that displays the exchange, management, and communication of data about the building, but it is unable to represent the real-time information related to the performance.
Therefore, they introduced an add-in program to integrate BIM and real-time data collected from the existing building sensor technology, within three approaches, and developed a data platform to visualize indoor environmental parameters. Further, Ceccarini et al. 111 took advantage of IoT and demonstrated a case study of a smart campus in which the heterogeneous data gathered from the sensors are visualized and contribute to a more efficient use of the campus premises.
As regards health issues, Yang et al. 112 introduced a system called VisOSA to monitor patients suffering from a chronic disorder called Obstructive Sleep Apnea (OSA). VisOSA is a web-based application that allows patients to assess their health condition and physician staff to monitor their patients both individually and in a group. In addition, Lupión et al. 65 and Marques and Pitarma 113 worked on health-related concerns in smart homes. To monitor the health condition of elderly or disabled people in smart homes, Lupión et al. 65 developed an IoT platform with the help of sensors that send the data to the cloud, and then the data are analyzed via activity recognition algorithms.
Finally, the results would be visualized through a web-based system and necessary alerts or notifications would be issued for doctors or a user's family. Marques and Pitarma 113 presented an approach based on IoT to monitor the environmental noise in a building, since serious health issues can originate from noise pollution. Then, they visualized the collected data through web software to assist decision makers with taking appropriate measures. Finally, to develop a health monitoring system, Elouni et al. 114 proposed integrating a Remote Health Monitoring Systems that uses multi-agent technology with machine-learning approaches to deal with the temporal aspect of real-time health data, to extract knowledge from collected data, and to predict the patients' state.
Table 4 summarizes the problems that these papers are trying to solve and their proposed techniques.
Proposals for monitoring improvement using visualization methods
Research line 3: Papers that attempt to develop easy-to-use visual intelligent decision-making systems
Regarding the third research line in this topic, almost all the papers in our pool mentioned supporting decision makers in some way, though some of them dedicated their work to providing support for decision making. Teong et al. 115 aimed at discovering a way to enable decision makers to explore data and gain deeper insights from visualized data. They showed that interactive visualization can do the trick and proved the effectiveness of their proposal by applying it to an airline to predict flight delays.
In addition, Hingant et al. 116 offered an enhanced intelligence system called HYBINT that would assist decision makers with watching over their all-important instruments. They supplied their system with cyber and physical heterogeneous data, and then the output of the analyzed data would be represented through visualization techniques in a single visualization space. They applied their work to a real environment and proved that it can enhance situational awareness. Moreover, Ltifi et al. 117 and Alves et al. 118 managed to combine data-mining techniques with data visualizations to enhance decision making.
Ltifi et al. 117 claimed that valuable patterns can be extracted from data by employing Decision Support Systems based on data mining. To transit from these patterns to knowledge, they proposed a generic approach to help decision makers take advantage of this knowledge, by using a common visual analytics process. They applied their proposal to a medical case in the Intensive Care Unit and proved its feasibility. Finally, an interactive visual analytics approach called PlanningVis was proposed by Sun et al., 119 which allows the exploration and comparison of production plans.
By integrating an automatic planning algorithm with interactive visual explorations, PlanningVis can facilitate the efficient optimization of daily production planning as well as support a quick response to unanticipated incidents in manufacturing.
Table 5 summarizes the problems that these papers are trying to solve and their proposed techniques.
Proposals for easy-to-use visual intelligent decision-making systems
Topic 3, Big Data tools
The topic “Big Data tools” is one of the most addressed topics in the academic literature (75 papers, 32% of all papers analyzed). It is possible to classify them into two main research lines: (1) Papers that introduce a comprehensive framework of Big Data analysis that mostly covers from IoT data acquisition to knowledge visualization; (2) Papers with a more focused view that discuss the application of visualization techniques on Big Data. In both categories, the authors are mostly seeking to achieve intelligence, and sometimes they manage to integrate other technologies such as cloud computing, machine learning, AR, virtual reality, etc. to overcome deficiencies such as dealing with heterogeneous data, real-time data, rapid change of data, storing huge amounts of data, etc.
Research line 1: papers that introduce a comprehensive framework of Big Data analysis
Within the first research line, the papers mostly pivot around two business sectors, namely smart factories and transportation industry. As far as smart factories are concerned, there was an evolution from conceptual proposals to frameworks to support specific situations (Table 6). Therefore, to accomplish an intelligent factory through the implementation of Industry 4.0 and Big Data, Shafiq et al. 86 presented a conceptual all-inclusive framework that comprises four stages, namely real-time data capture from sensors, PLCs, etc.; data standardization and formalization; semantic analysis; and real-time visualization of KPI through a GUI dashboard.
Big Data frameworks for smart factories and transportation industries
Similarly, Liu and Jiang 42 introduced a comprehensive cyber-physical system (CPS) architecture for the shop floor, which would assist in intelligent manufacturing. Their proposed framework covered configurational and operational delicacies from data collection and interconnection between the entities to industrial Big Data analysis and acquisition of knowledge, which would help intelligent decision making. In addition to that, Campos et al. 120 investigated the characteristics of data and Big Data and highlighted how manufacturers may implement Big Data analytics and technologies, such as data mining, as well as data visualization techniques in their organizations to convert the data into information and manage their assets.
In addition, Jung et al. 121 suggested a Big Data analysis framework in which data are collected from three different stages: the distribution stage in which products are distributed, the customer usage stage in which products are used by consumers, and the A/S stage in which products are repaired by repair shops. Data are then analyzed and visualized and the analysis output is subsequently handed over to the companies to assist them with improving efficiency at each stage. Moreover, Yu et al. 82 proposed a comprehensive architecture to be used in IoT-based smart factories to assist with fault detection and predictive maintenance.
Several technologies such as Apache Spark, OPC Collector, transformation protocols, and encryption methods have been used to produce this manufacturing Big Data ecosystem. Unlike many other papers addressing the same subject, they paid attention to data security issues and guaranteed data security. Similarly, Godinho and Piedade 122 proposed a framework called ACCEPT that was designed for the collection, storage, analysis, and visualization of shop floor data through a web application.
With regard to transportation industry, different frameworks have been proposed to solve different kinds of traffic problems (Table 6).
A new comprehensive framework for Intelligent Transportation System (ITS) was developed by Xiong et al. 123 that took advantage of cloud computing to integrate and share Big Data collected from satellites and helicopters, aka Space-Air-Ground Big Data, with the aim of accomplishing accurate and energy-efficient transportation in real time. Zhang et al. 49 introduced a framework for Distributed Collaborative Urban Traffic Big Data (DCUTBD) system, which takes advantage of cloud computing to provide a collaborative platform to share multidimensional traffic data, software and resources among the entities, as well as visualization of complex traffic problems.
The authors applied their proposal to a real city to approve its efficiency and feasibility. Aside from these, regarding marine transportations, Soares et al. 124 proposed an agile and comprehensive framework that acquires heterogeneous data streams from various sources such as maritime and marine sensors within IoT infrastructures, integrates and processes the data employing Semantic Web Technologies, and discovers knowledge to help the ships and reveal unusual events. Further, Luo et al. 125 presented a comprehensive Big Data analysis framework that covers collection of data, processing the data and data mining, and data visualization, by integrating Big Data analytics into CPS to help decision makers in various areas.
They proved its practicality and versatility through two practical cases in power grids and aircraft. Finally, to achieve smart transportation management, Khan et al. 126 presented a framework capable of integrating heterogeneous dynamic Big Data gathered from various sources in urban transportation systems. The authors employed data mining and machine learning models and covered all the necessary steps to deal with Big Data, that is, data acquisition, storage, analysis, and visualization, together with real-time monitoring and forecasting, with the aim of assisting decision makers.
Research line 2: papers that discuss the application of visualization techniques on Big Data
The second research line is mostly concerned with the application of visualization techniques to Big Data collected from various sources. The application has been focused in two areas: industrial Big Data and geographical Big Data. To deal with industrial Big Data, Xu et al. 127 designed and implemented a visual analytic system to investigate tremendous amounts of data generated in the assembly lines of factories. Their system would assist with monitoring the performance of assembly lines in real time and the investigation of historical data to uncover anomalies and deficiencies and to aid with finding the reasons for them.
For the specific case of agricultural industries, Wu et al. 91 proposed a multi-dimensional information visual analysis approach for market sales Big Data that employs a density-based clustering algorithm that would expel excessive data and just keep the effective information, aiming at providing the agricultural industries with a clear vision about market status and trends, and assisting with smart decision making. Moreover, an interactive visual analytics system was designed by Wu et al. 128 to allow monitoring of the equipment in a factory in the process industry and thus avoid unplanned downtime and unnecessary routine maintenance.
They deployed advanced analytical algorithms and intuitive visualization designs to provide a semi-supervised approach to monitor the condition of the equipment. In addition, Qian et al. 129 proposed a versatile architecture to perform 3D visualization on the shop floor Big Data collected through sensors and IoT technology in real time, with the aim of showing the real-time state of the shop floor comprehensively, thus enhancing production efficiency and reducing production costs. To evaluate the behavior of the Advanced Driver Assistance System (ADAS), Priyadarshini et al. 130 proposed an interactive GUI to perform the analysis and visualization of the tremendous amount of data collected from sensors and vehicles in the automotive industry.
Finally, Redondo et al. 83 aimed at handling tremendous amounts of data in industrial companies to support the continuous monitoring of machines and extract knowledge and patterns through a visualization technique called Hybrid Unsupervised Exploratory Plots (HUEPs), which combines Exploratory Projection Pursuit (EPP) and Clustering methods. They applied their proposal to the practical case of an automotive industry sector to test its ability to predict failures.
With regard to geographical data, Bornschlegl et al. 131 introduced an approach to analyze heterogeneous car-to-cloud data through comprehensive visualization so that they can detect anomalies. Aside from these, Kang et al. 132 proposed methods for visualization and spatial-temporal analysis of Big Earth data based on Keyhole Markup Language (KML) and employing Cesium, which is a java library for creating 3D virtual Earth and 2D maps in a web browser and would help reveal the correlation between dimensions and periodic trends within the Big Earth Data.
Moreover, Bouloukakis et al. 133 proposed an interactive data visualization system for smart cities to transit from static IoT data visualization to interactive IoT data visualization. To accomplish this system, they took advantage of advanced user interaction techniques and Virtual Reality and overcame difficulties with data complexity and heterogeneity. Moreover, Lock et al. 134 developed an application for visualizing real-time and historical Big Data on the city transportation that applies AR and would help with assessing the transportation performance and the results would be beneficial for a wide range of people, namely decision makers, city planners, and citizens.
New research agenda
Technology infrastructure
The area of research on this topic involves approaches for integrating technologies and making them operate together properly, 135 which also raises the need for standardization and improved interoperability. 39 For example, there is a need to find approaches to integrate IoT, Industrial Information Integration Engineering (IIIE), 5G, and Blockchain. 136 Regarding IoT, a common consensus on the IoT standards, as well as a clear functional view of different components of IoT operating together are required. 135
In addition, within an IoT environment, interoperability between various parts such as networking, devices, syntax, semantics, and platform should be enhanced through a protocol gateway service. 135 In terms of big data, deploying programming languages such as Python and R in big data analytics should be explored. 137 Aside from these, fog computing was introduced to eliminate latency issues caused by transferring data between the cloud and the application in latency-sensitive applications such as health care applications. However, it also brought about other requirements that need to be addressed, such as the business model, security, privacy, and scalability. 138
Case examples
Although a huge amount of research has been conducted in this field, there is a need to integrate technologies such as IoT, AI, etc. into different business areas to achieve a comprehensive transition from traditional to modern and smart. As far as buildings are concerned, more research should be carried out on the integration of AI with BIM to make the BIM modeling process less time-consuming. 139 Moreover, the use of Cloud BIM in off-site construction is required to enable the stakeholders to share the project data. 139
In addition, special attention must be paid to enhancing the exploitation of power consumption datasets by using machine-learning algorithms that can contribute to reducing energy consumption and shifting to a more sustainable and energy-efficient environment, such as using generative adversarial networks to improve the quality of collected data, and deep learning models to identify consumption anomalies. 140 Also, to monitor energy consumption, deploying more cost-effective hardware to transmit and process data is important, as is the use of IoT sensors and smart meters to help achieve data accuracy and real-time data collection and analysis support. Although end-users' power consumption data can be used to extract usage patterns, privacy must be protected.
As for other areas, a promising research direction is the deployment of big data by means of drones, unmanned aerial vehicles, and satellites to assist with the prediction of natural disasters such as floods, bushfires, etc. to take necessary measures in advance. 137 Moreover, to monitor pollution, mobile crowdsensing can be used to collect the related big data. 141 Finally, more emphasis should be placed on the hardware and algorithms required to employ Big Data on the whole lifecycle of a product. 34
Final-user experience
Visualization is one of the technologies that has emerged to directly assist users in various areas and is considered a hot area of research, 142 although there are still challenges that need to be addressed. To name but a few, visualization techniques should be equipped with context awareness to be able to visualize the data according to the situation. Also, it is better if the reasons underlying the recommendations delivered by a visualization system are transparent to the users. In addition, more efforts should be focused on integrating virtual reality techniques into visualization systems to make the system interactive by accomplishing the third dimension. 142
Aside from these, regarding energy consumption, effective visualization techniques can be employed to allow the end-users to be aware of their consumption behavior. 140 Regarding the health care system, custom visualization and dashboard panels with more details would effectively help to enhance patient–physician interactions. 67
Big Data tools
Big Data technologies have facilitated business digitalization, although more efforts are necessary for many related areas. To name just a few instances, first, with the growth of heterogeneous big data, some challenges arise, including the storage overhead on the servers, and to overcome this challenge many scholars have suggested using distributed storage such as cloud computing.38,138,143,144 Despite the benefits, it also gives rise to other challenges such as the need to take care of data integrity, accountability, availability, and authenticity, 145 and above all security and privacy concerns. 144
Other than that, the lack of efficient algorithms for querying big data in a cloud environment has led to scalability issues and delayed responses. The second promising research direction is to branch Big Data out into various business fields such as the tourism industry to address the problem of over-tourism and to increase overall productivity 146 and more importantly in health care, 147 such as helping to design predictive systems for early detection of the diseases. 39 The third research direction concerns the approaches to performing effective and thorough analyses and mining of collected data, 148 which can be achieved through various approaches, such as by using the power of machine learning 148 and deep learning along with data fusion mechanisms. 149
Finally, an increasing amount of attention has recently been paid to the big data collected through mobile crowdsensing, although more research is required to reveal the power of crowdsourced smartphone-based measurements. Further, obtaining consistent and reliable results from smartphone sensors is still a major concern. 150
Conclusion
Although IoT data visualization for BI processes enhances the productivity and efficiency of the business, different authors have shown that there are numerous challenges and factors that must be identified and studied in this field.
To advance in this line of knowledge, in this article a bibliographical analysis of the literature on IoT data visualization for BI processes published since 2009 has been carried out. A sample of 237 papers were analyzed to identify the evolution over time of the number of articles included on the list, the evolution of the number of citations generated by these articles, the number of articles published by authors, the number of articles published by country, the number of articles published by institution, the content of the 10 most cited articles on the list, the number of articles published per journal, the indicators of relevance, impact, and prestige of the 10 journals with the most articles published on the list, and the established and emerging research categories on the topic as well as their future research necessities.
The work presented in this article contributes to the literature on IoT data visualization for BI processes, as it extends the existing bibliographical reviews:
(1) It considers IoT, data visualization, and BI together, since to date none of the existing reviews had considered these three research areas together; (2) it extends the period of the systematic review to 2020; (3) it has a greater coverage of information sources since it uses both the Scopus and WoS DBs jointly; (4) it identifies the main authors, countries, and institutions that contribute in the field of IoT data visualization for BI processes, using statistical analysis and bibliometric analysis techniques to obtain and compare the most influential works (response to RQ1); (5) through a topic modeling using LDA, it identifies and proposes four research categories: Technology infrastructure, Case examples, Final-user experience, and Big Data tools (response to RQ2); and (6) it identifies future research needs in the field of IoT data visualization for BI processes (response to RQ3).
The bibliographical analysis has confirmed the initial hypothesis that an analysis of current research could facilitate the advancement of future research in this field.
The main conclusion is that the area of study requires more research and a higher number of annual publications. It is also necessary to improve the relevance of the research carried out, something that could be achieved by accessing journals of greater impact. Finally, the number of papers published in each category is quite balanced. The category with the fewest papers is Case Examples. Therefore, research conducted in this category should be improved, since it is crucial to transfer the knowledge generated by academics to practitioners, thereby allowing the implementation of the advances in the other categories in real enterprises. In this regard, it is notable that not all corporate functions that can take advantage of IoT data visualization for BI have case examples, such as marketing, purchasing, sales, etc. The same happened with the business sectors. This is an important gap in the current research on this category.
Finally, it is important to highlight the limitations of the study. This research was limited mainly by
(1) the biases introduced by studying only two bibliographical DBs: the WoS and Scopus. There was also a language bias, due to the fact that these DBs include mostly articles that were written in English, and the search was conducted only in English. Other academic DBs specifically dedicated to computer science such as ACM Digital Library or IEEE Xplore Digital Library could be used to improve and compare the results;
(2) choosing a series of specific keywords introduced another bias by default. Other keywords could have been used and might have yielded different results;
(3) the bibliometric analysis based on LDA was used, and the literature was classified in four research clusters. Other methods, such as network citation analysis, might be used for such analysis to compare results; and
(4) a spreadsheet has been used to do the systematic literature research. The use of a specialized tool could help to discover new findings.
Footnotes
Author Disclosure Statement
No competing financial interests exist.
Funding Information
No funding was received for this article.
Abbreviations Used
Appendix A1
Appendix A2
Appendix Table A6 Synthesizes the Topic 1 Proposals by Business Sector and Corporate Function.