




Abstract
Decision making in stock market is a movement in which investors gather information and carry out complex analysis to select options, based on market variations and investor's preferences. This involves the facts of risk of return, appreciating or depreciating of stock markets in value and dynamic circumstances. We present a design to study and discover bear and bull markets from macroeconomic variables in a probabilistic manner to assist the decision-making process. Features such as return, risk, simple, and exponential moving average are represented as flexible time series. The learning method that involves conditional dependence of stock variables and inference is described by the base of Bayesian theorem. We highlight our learning method using an actual case study with a consistent stock portfolio optimization. The case study addresses a set of selected stock symbols of VN-index and the logical method is illustrated by significant rates of accuracy over a variation of types of stock symbols.
Introduction
Behavioral finance and profitable trading are the major topics that need to be addressed in creating a feasible and reasonable program for identifying the behavior of stock market. The first question is shown with designs that can gain control of the aspect of behavior, that is, what is the base to the performance of stock symbols, and yet is manageable enough to predict stock prices given trading history.
Stock returns can come into sight from comparative movability of the stock prices and the decisions of investors. In consequence, the stock returns can offer essential facts about the dependence of the stocks inspected and the style of alteration of the stock symbols. Dismemberment in the trend of the stock return can assist in partitioning time series of stock symbol into segments that correlate with bull and bear markets.
Efforts have been contributed to analyze and forecast such regime switches of the stock prices using assessment of the risk of future regime transforms. 1 A number of articles address the question of grading the price of stock symbol corresponding to the investor preference from fundamental analysis and technical analysis. The value of a security is mainly rated in the fundamental analysis 2 by checking the elemental aspects that concern recent business of security and coming up expectations. In contrast, trading movement such as time series of price and volume may give foundation for statistical analysis of trend for the security viewed in the technical analysis. 3
Consider a wide range of machine learning methods4–6 that present the application of statistical analysis used for training and performing prediction for trend of security market. Yet, when security data are mined with machine learning methods, underlying factors are uncovered. From this point of view, accuracy in analyzing and forecasting for security market can be improved by implementing support vector machines (SVMs), 7 Bayesian networks, 8 random forests, 9 neural networks, 10 and hybrid methods. 11 However, we find that due to volatility of the security market, the forecast of stock trend is still one of the most complicated exercises.
One interesting fact is the potent growth of Vietnam's capital markets for meeting demand of investment over the past 20 years. After the recent trend of subsectors of the markets covering banking, securities, and insurance, the credit institutions take the major part (67%) of total financial assets. 12 Regulation and supervision of the capital markets are conducted by the State Bank of Vietnam and the ministry of finance.
It is worth noting that the emerging market is becoming an engaging stop for investors assisted by the area's secure economic and political backdrop. In the challenges brought by the COVID-19 started from 2020, the country's policy of large-scale vaccination and patient treatment has supported businesses for maintaining production, keeping Vietnam's economy resilient in an expanding rate of 2.9%. 13
Our study seeks to explore how macroeconomic variables of stock market and their relations can be analyzed in the delivery of a high-quality prediction algorithm. Within this article, our early findings of a case study forecasting events of bear and bull markets within a set of selected security symbols of VN-index (VNI) and results of decision making with the analysis are presented.
In reality, the technical analysis assisted by fundamental analysis is our major topic, allowing us to produce a deep study of market time series data. The first contribution of the article consists of consistent analysis of financial features and their relation to bull/bear state of stock symbols. The second contribution is our evaluation method for each security symbol giving ability of assistance for decision making of portfolio management. The learning method is described in Bayesian formation that contributes analytical and insightful foundation for robust validity. A case study with stock symbols of VNI is performed with the prediction method to show the accuracy of the learning method.
Related Studies
Analysis of finance behavior of market trading is essential because profitability is based on rational investment decision. We first review approaches of machine learning for assistance of mining market data (I). Then, published reports of feature engineering with various financial indicators used in the data mining are summarized (II), and finally, study cases for actual financial markets are discussed (III).
(I) One way of estimating financial market situation is to classify market states first to bull market, mixed market, and bear market and then further subdivision can be made. Chen et al 14 do feature analysis for the hidden state of the Markov model (HMM) for the first stage in the market state classification and then perform state estimation. As an enhanced version of the recurrent neural networks (RNNs) to deal with the long-term dependency issue of RNN, the long–short-term memory (LSTM) was applied by Min. 15 to predict the market trend. Here are three types of trends covering bull, bear, and flat markets. The experimental result of the study illustrated that the LSTM method is suited for long data period.
There is a different way of evaluating stock price by using trading strategy. Dang 16 presented a solution combining reinforcement learning realized by greedy strategy and the LSTM. Thus, a stock trader plays a role of agent and the stock market is the play environment. Next, a statistical method with semiparametric characteristic named boosted regression trees (BRT) was introduced in the study of Alberto. 17 Prediction can be performed with the BRT for a large data set wherein relations in the data set may not be linear nor monotonic. A function for soft weighting variables allowed prediction of the market values.
The idea of hybrid method is applied by Haase and Neuenkirch 18 to have a strong tool for prediction. To produce diffusion feature, macroeconomic indexes and financial variables were integrated first by the principal component analysis (PCA) and then by the shrinkage technique. The Markov one-step model was proposed for regime change prediction. A hybrid solution designed by Amit and Prateek 19 carries out stock market prediction by the deep convolutional LSTM integrated with the Rider optimization algorithm and butterfly optimization for training. Also, financial technical indicators were derived by the Sparse-Fuzzy C-Means clustering and feature selection.
This may seem like many methods applied for financial forecast, but there are alternative methods. In our study, methods of k-nearest neighbors (KNNs), Gaussian naive Bayes (GNB), and gradient tree boosting (GTB) are implemented for predicting states of market including bull, bear, and flat markets.
(II) Nyberg 20 proposed a dynamic binary time series model to predict financial market trend consisting from bull and bear states. The two regimes are related to the downturn and scaling up cycles of market value. With the market data such as dividend–price ratio, the long-term, and short-term interest rates, the model displayed good results. Since the features represent all the data used for machine learning, feature engineering is an important preparation task. Jaideep and Matloob 21 proposed to get financial features from both fundamental and technical indicators. Then feature analysis with PCA was performed to choose the best feature collection for further prediction of stock prices.
Considering the data preparation stage, our method implements feature extraction from fundamental and technical indicators and then evaluates the features for choosing the best ones. PCA is also applied in this stage to have smaller data size that can be helpful for further deep learning process.
(III) In the time series analysis of security market, changing volatility must certainly be considered with the fact that there are risks of change for trend of market during real investment projects. The Nikkei 225 Futures and TOPIX Futures were the objects for study in Mitsui article 22 addressed in this issue. The trend analysis was realized by MS-ARMA(1,1)-GARCH(1,1) model detecting bull and bear markets from market data. Experimental analysis provided ability of capturing bull regimes with high mean and low volatility while low mean and high volatility were observed with bear market regimes.
Notice again the important components that are feature engineering and the market state analysis are essential for prediction of the market states. Shen and Omair 23 implemented the LSTM method for 2 years data of the Chinese stock market. Their feature engineering includes feature expansion, recursive feature elimination, and the PCA. An interesting observation from the article of Zheng et al 24 is that the data used for experiment were taken from the index of Shanghai Securities Composite Index and Standard & Poor's 500 (S&P500). The authors show random LMST method that contains a module for prediction and another for prevention. The deep learning model has three full connection layers.
Rather than taking data from the mentioned stock indexes, a set of symbols from VNI stock index was used for our case study. Then feature engineering was conducted to support overall performance. Three learning models were implemented to illustrate our Bayesian prediction model for bear and bull markets. Next section describes in detail the foundation of our method.
The Method
In this section we express a Bayesian inference model to accompany a classification method applied to financial time series data to predict bullishness of market. The model defines how various assets of a stock market are associated with each other. One principal view of stock market is that it takes s for a stock symbol and b for a discrete class that can be bull, bear, or flat market. If we update market data on a daily basis, then the element d for day is evident. All market indicators and features such as close price would be remarked by f. To mark a time series data of feature f from the day
As in the first essential view of the classification topic, we would like to know if a stock symbol b in a day d is bull or bear or flat market. This can be expressed by the Bayes rule
25
with illustration shown in Figure 1.1 with note of sd for marking a stock symbol s in a day d. So, probability of bull market given the symbol in a day can be expressed by

1. Classification for symbol s in day d for bull or bear or flat market. 2. Classification for symbol s associated with features f in day d.
Actually, a common alternative is suggested to drop the denominator
Applying technique of Bayesian statistics, the mode of the posterior distribution is used for estimation of unknown quantity in the maximum posteriori probability (MAP). More exactly, the MAP of a symbol s in a day d can be estimated by alternative values of class b,
In occasions of Equations (2) and (3), it is reasonable to define the probability

This is a significant task for getting financial features that can be extracted and selected from the fundamental indicators and technical indicators. The features evidently differ from symbol to symbol, depending on particular day (Fig. 1.2),
With the availability of the financial features, we can represent the joint probability distribution

Notice that throughout prediction of b (bull or bear market or flat market) for a symbol s in day d, we have full data for previous days

To evaluate

An obvious population standard deviation
And then
Simplest of these is to estimate
In pursuing estimation of
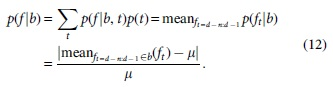
Hence, the first item
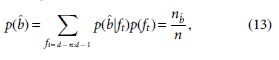
where
The research involves no more than minimal risk; The research could not practicably be carried out without the waiver or alteration; The waiver or alteration will not adversely affect the rights and welfare of the subjects.
Feature engineering
Let us now study properly the preparation of data and see how to make the data consistent with the prediction method addressed in previous section allowing performance improvement. To specify the financial features, it is interesting to consider their relation with class values covering bull, bear, and flat markets in our case study. Our option is to use the Bayes rule for inference,
This can be described by a decomposition of the feature values into time series values of the days

Although the financial features of days dt are collected and the mean
The counting of each event
The use of Equations (15)–(17) for calculation of Equation (14) was seen to make the feature estimation effectual. This can be contributed to the need of selecting a small set of features for further training process with expectation of performance improvement.
In carrying out a fundamental feature selection, it is necessary to study financial data that regulate the strength and stability of an asset. The evidence from macroeconomic fundamentals suggests key indicators such as stock indexes, trade balance, money in circulation, interest rates, unemployment, inflation, gross domestic product, and industrial production. In fact, stock indexes such as
A commonly used technical indicators for learning market movement is the close price
Experimental studies in technical analysis suggest the moving average that is defined by the average of closing price over a period of time. Thus, the simple moving average (SMA)
After all, when the initial and final values are known, the return can be estimated
The return feature is constructive in assessing the return possibility of an asset for a time period. The standard deviation of the feature is used to estimate the volatility of return or the risk
Market cycle normalized return (mcnr)

We measure the scale of change of the return feature to define classification to bull, bear, and flat markets bd. The threat of change for the return feature is 0.2 or 20% by default for a particular trading day d,
And as we have seen earlier in this section, all the extracted features are to be checked by Equation (14) to select the most essential features for machine learning. An alternative method uses PCA proposed by Jolliffe
26
to extract principal components from the initial features, keeping major characteristics and also reducing the size of feature value domain. The PCA consists of the eigenvalue decomposition on covariance matrix V with mean vector

Symbol filtering
A further performance improvement can be gained by studying asset portfolio, that includes weighting, selection, and control of asset values. As a financial asset is coded in a market symbol, the goal of symbol filtering is to evaluate values of symbols and then assign weights for selection. This task is needed for optimizing return on investment. Strength of a symbol s can be measured by its features f that were primarily processed in the previous section,
Suppose that the time series of selected features for a viewed symbol are available for a number of days

As
Learning methods
There is a diversity of learning prediction methods designed for time series data. Our case study uses the features and symbols predefined by the previous section for three selected learning methods: GNB (I), KNNs (II), and extreme gradient boosting (XGB) (III).
(I) The key assumption for the GNB
25
is that distribution of the continuous values related with each class is the Gaussian. The posterior
where the mean
(II) A classic approach for learning data is to use KNNs. 27 Notice that our classification is trinary for classes of bull, bear, and flat. The Gaussian distribution (26)–(29) allows getting posteriors for each class:


where
The equation for the prior for bear is similar. So that the most likely class prediction is based on the ratio of
Thus, the KNN attempts to do a classification checking KNNs. Equation (34) is a way to interpret comparing the number of bulls with the sum of the number of bears and the number of flatsn a short distance to the viewed data point.
(III) Concerning the GTB,28,29 it is necessary to detect some function
To investigate the performance of learning methods in our case study, accuracy, precision, recall, and F-measure
31
are used as metrics. Note that TP is short for true positive, FP—false positive, TN—true negative, and FN—false negative,

The latter equations have completed our description of fundamental inference method for detecting bull and bear markets. Figure 2 shows the method in a form of pseudo codes. Here, the feature engineering carried out for updated market data takes the first part in the algorithm, permitting feature evaluation and feature selection. We assess the asset portfolio in the second part by checking performance of each stock symbol and then select the best if necessary. Then, we can use a particular day, giving separation of market data by the day for training and test.
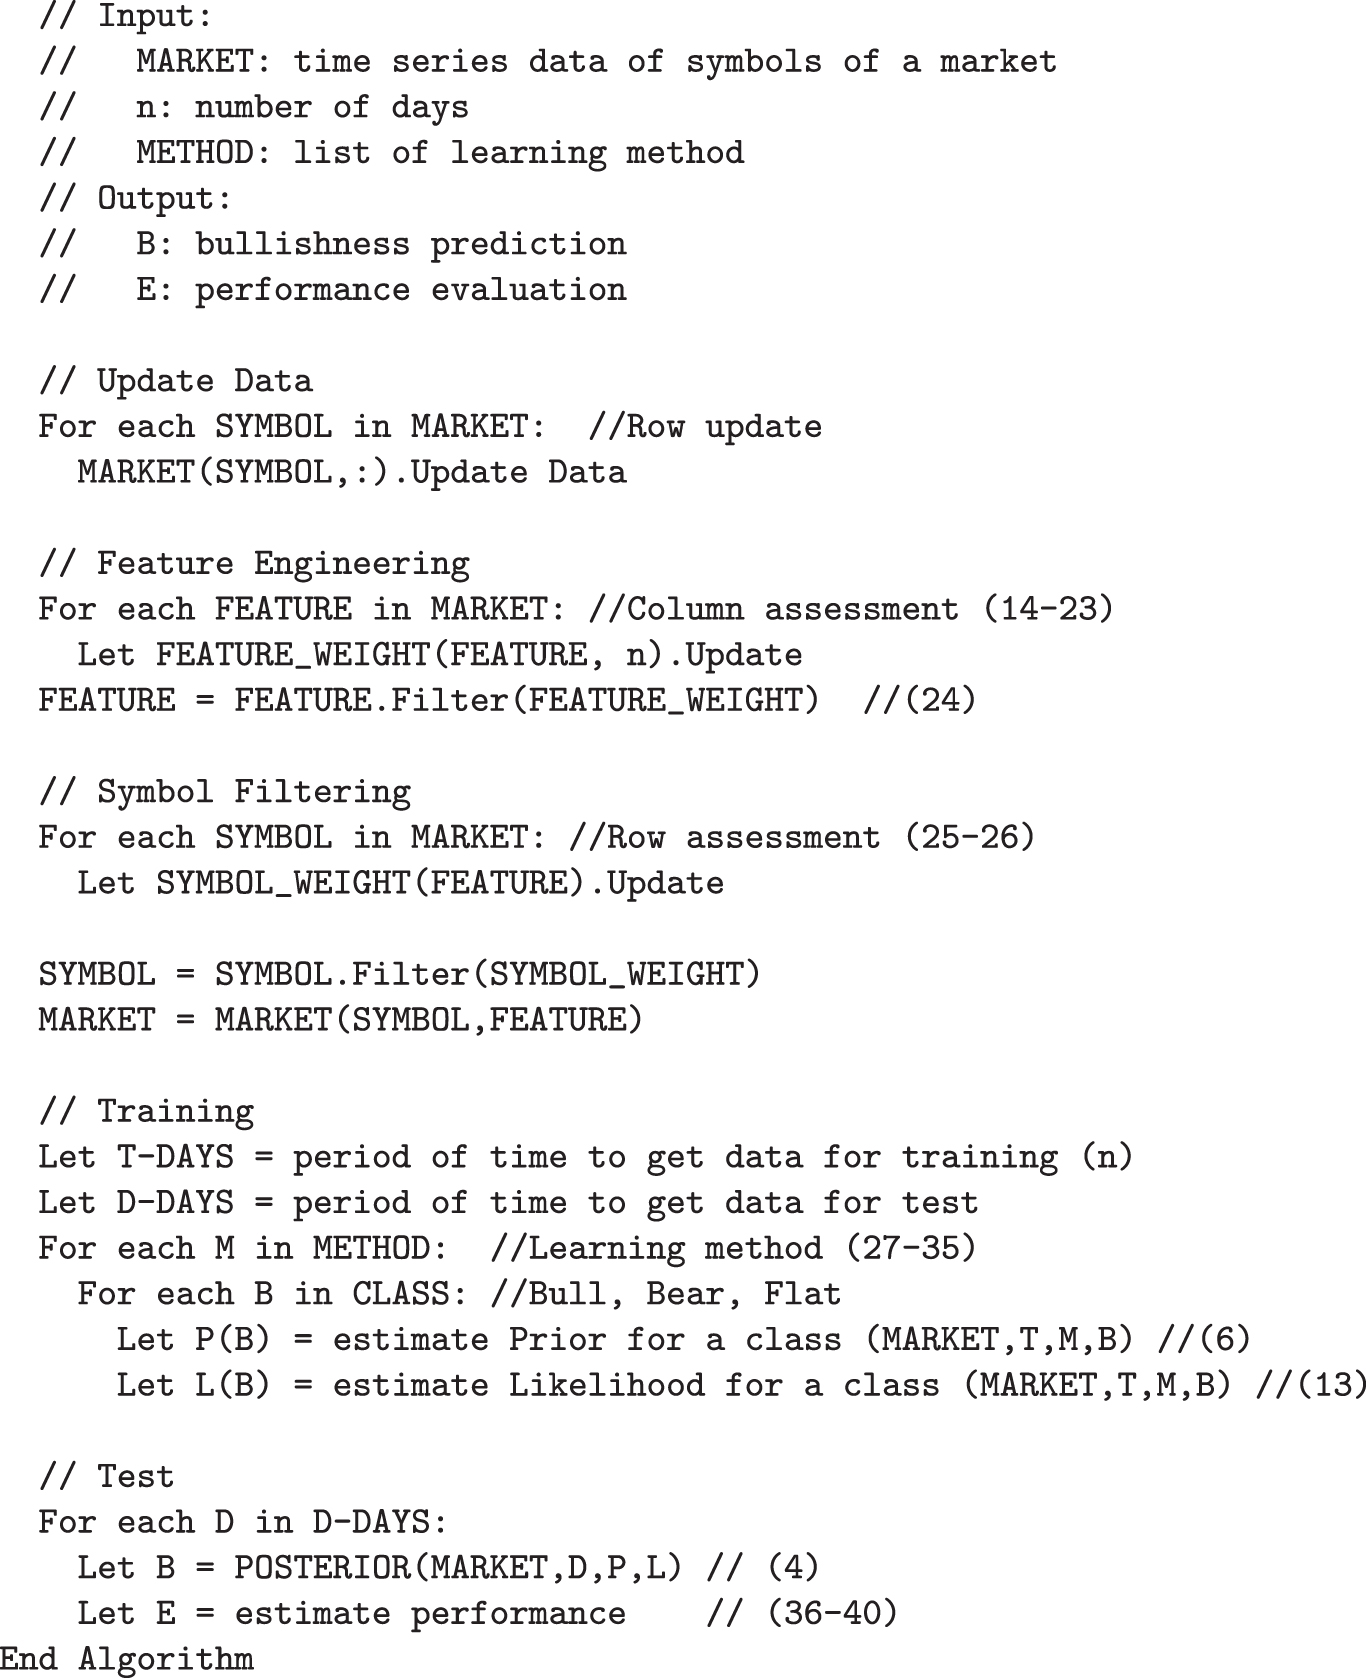
Bayesian bullishness inference algorithm.
The described Equations (6)–(13) for getting posterior and likelihood are the base for the section of training. The prediction of bull and bear markets for the test data set is conducted by estimation of prior by Equation (4). Performance of application is measured by Equations (36)–(39) ending the algorithm.
Experimental Results
As well as a large bull market cycle for VNI stock market has been ended by the beginning of July 2021, the proposed algorithm has been applied over all VNI data 32 for a predicting period of 5 years, from July 2, 2016, to July 2, 2021 (Fig. 8). The aim is to learn bullishness for a set of 100 selected stock symbols. Data of stock market are updated daily with major technical indicator including close price, trading volume, open price, adjusted close price, the highest price, the lowest price, and percentage change of adjusted close price.
The fundamental indicators are also captured for analysis, such as business domain, earnings per share, and price-to-earnings ratio. In particular, the indicators of the VNI are revised everyday for our experiment. As they are summarized from the market data, the market indicators have notable relation to market's symbols.
Feature analysis
For given close prices by days for a stock symbol, the SMA
Symbol filtering
One actual scenario is the use of a set of significant indicators to monitor preferred symbols. We are given a table of data for most available security symbols of the market having mentioned fundamental and technical indicators. To concentrate on a subset of symbols, a list of requirements is formulated in a form of conditions applied to the data table. The conditions related to the mentioned indicators allow selection of preferred stock symbols for further study. Basing on updated data and our specific conditions on business domain, volume, and price-to-earnings ratio, from 100 symbols we have 12 qualified symbols covering FIT, HCM, HPG, HSG, MBB, MSN, NKG, NVL, SSI, VIC, VNM, and VPB.
If history of close prices for the symbols is updated, the return
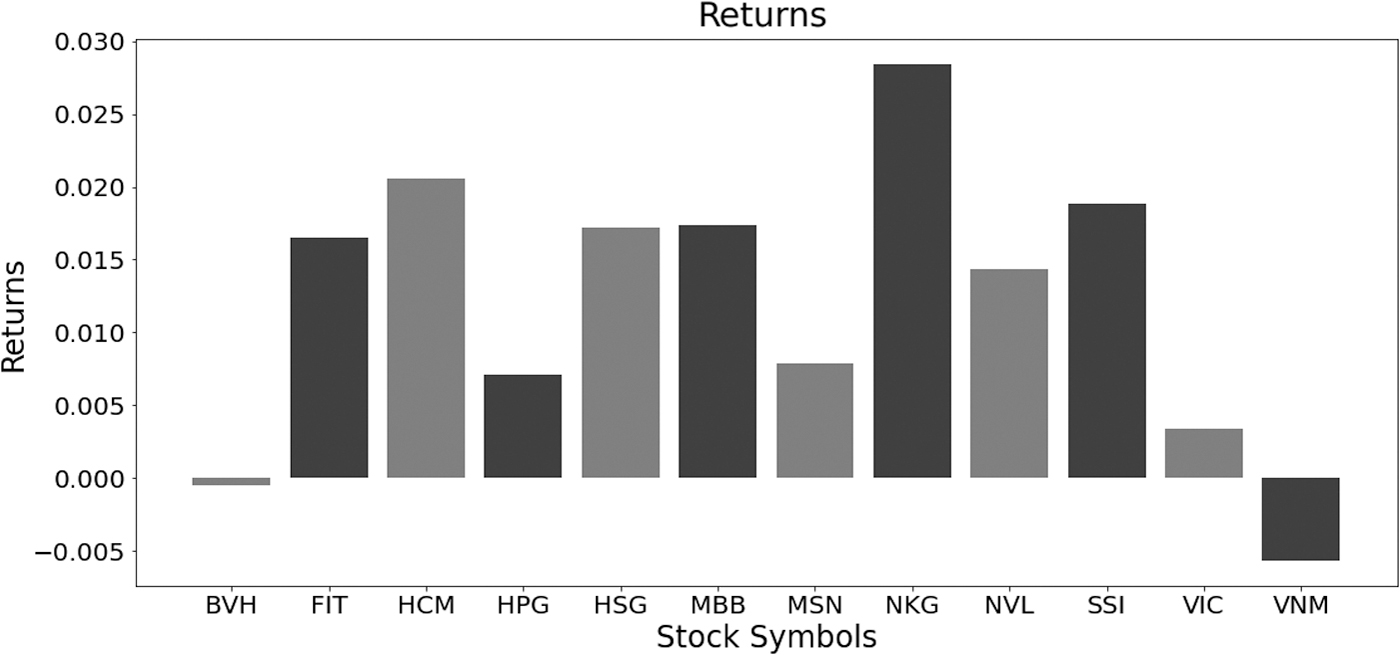
Average return for a particular period of time for a set of selected symbols.
However, of course, the information is not enough for decision. For such return, the risk of return is expected not always to be low. By getting average for a period of time, Figure 4 shows the risk of return, associated with viewed stock symbols.
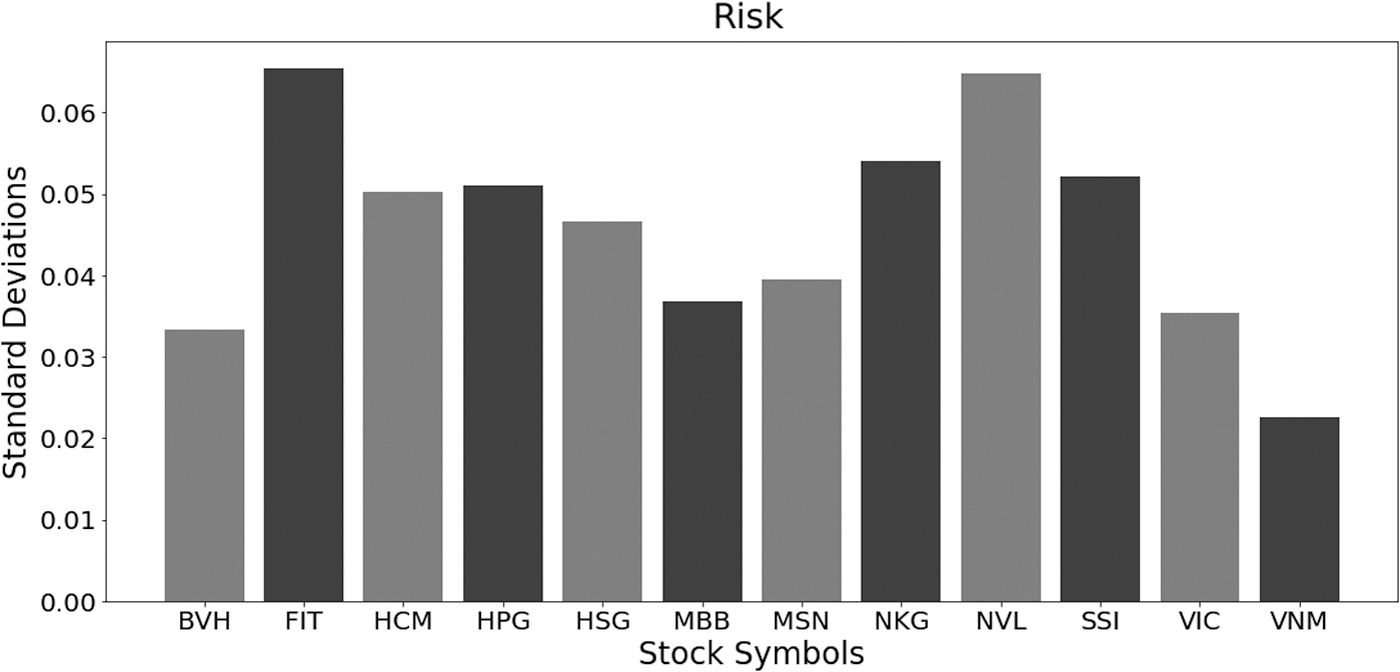
Risk of return for a set of selected symbols reported for a period of time.
On combining the return and the risk into coordinates of point in a 2D map, each stock symbol can be positioned for a comprehensive view of stock data. Thus, Figure 5 shows an example of the position map derived from data for a specific time period. When the stock symbols were selected initially by the previous section by the same set of preferences for a group of features, the position distinction of the symbols in the map is caused by other features.
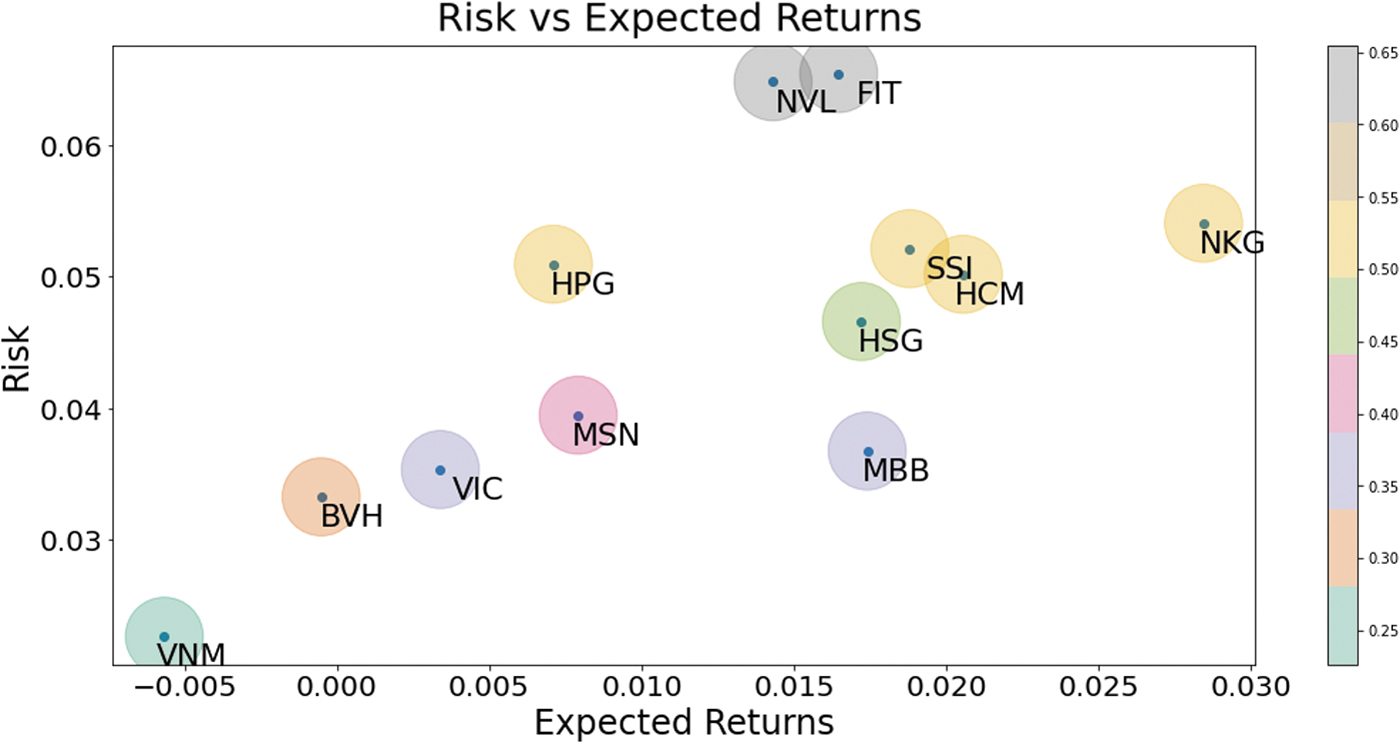
A position map with return and risk of return for a set of stock symbols.
Bullishness prediction
With specific regard to the index of market, the mcnr
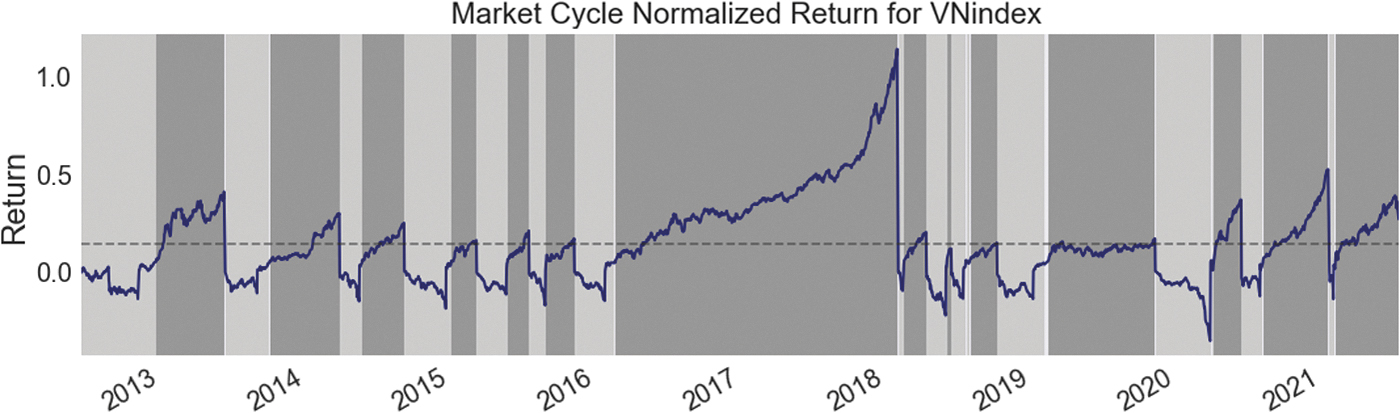
Trend of the VNI by the market cycle normalized return and bull versus bear markets. VNI, VN-index.
Our feature engineering module for each stock symbol requires merging fundamental indicators and technical indicators. So the VNI features such as the mcnr and bull versus bear markets are merged for features set of a stock symbol. The analysis of the features allows detecting trend for a viewed symbol. Figure 7 shows the movement of the close price for 1 year period from July 02, 2020, to July 02, 2021, for an example symbol of HCM. We then estimate the return feature and show bull versus bear markets in the bottom part of the figure.

Example of return movement for 1 year period from July 02, 2020, to July 02, 2021, for a stock symbol.
Hence, all features extracted from fundamental and technical indicators assist the detection of return trend for stock symbol. Figure 6 shows the trend estimated for our sample symbol for 1 year period. The trend is printed in dark and light background to show bull and bear markets. Note that training data for the case takes the date of July 2, 2020, back to the pass. For each day in the test, we retrain with data before the day.
Having prepared the data for training and the test, it is now possible to implement learning method for each stock symbol. The methods described in the previous section are GNB, KNNs, and the XGB. In this way, the bullishness is predicted from knowledge estimated by training data of the days before the day of prediction. The performance metrics (36)–(39) are retrieved for the learning cases using comparison of predicted and expected values. The accuracy for mentioned learning methods exercised for 12 stock symbols is given in Table 1.
Accuracy of learning methods for 12 symbols
GNB, Gaussian naive Bayes; KNNs, k-nearest neighbors; XGB, extreme gradient boosting.
The worst score is seen by 62.85% when the GNB method is applied for MSN symbol and the best rate we can see is 94.96% when KNN is applied for NVL symbol. However, average accuracy of XGB is eventually the best by 84.29%. To display how the learning methods related to the accuracy. Figure 9 shows the accuracy achieved for each learning case and resumes it in the last group of columns.
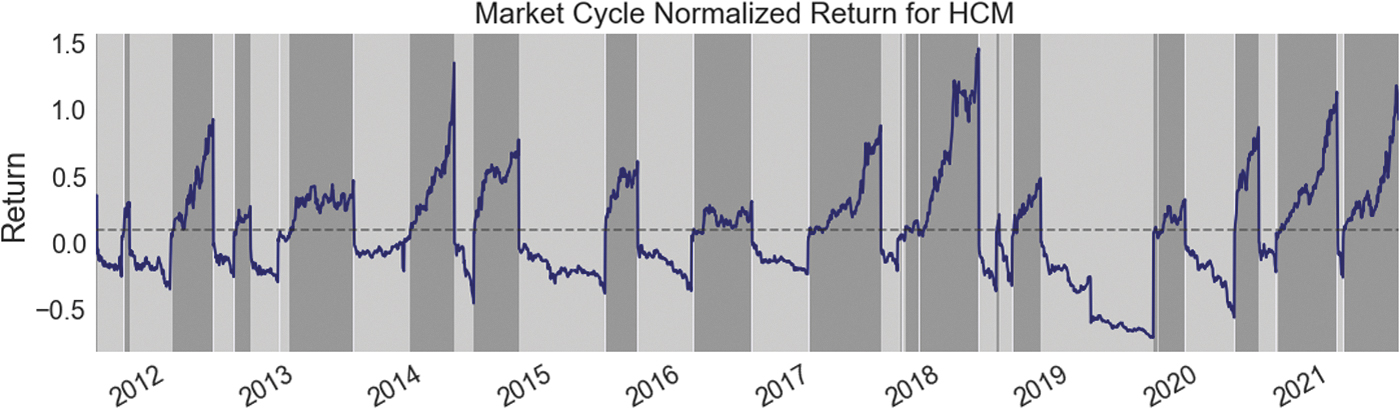
Return trend of a sample stock symbol and expectation of bullishness for the symbol.
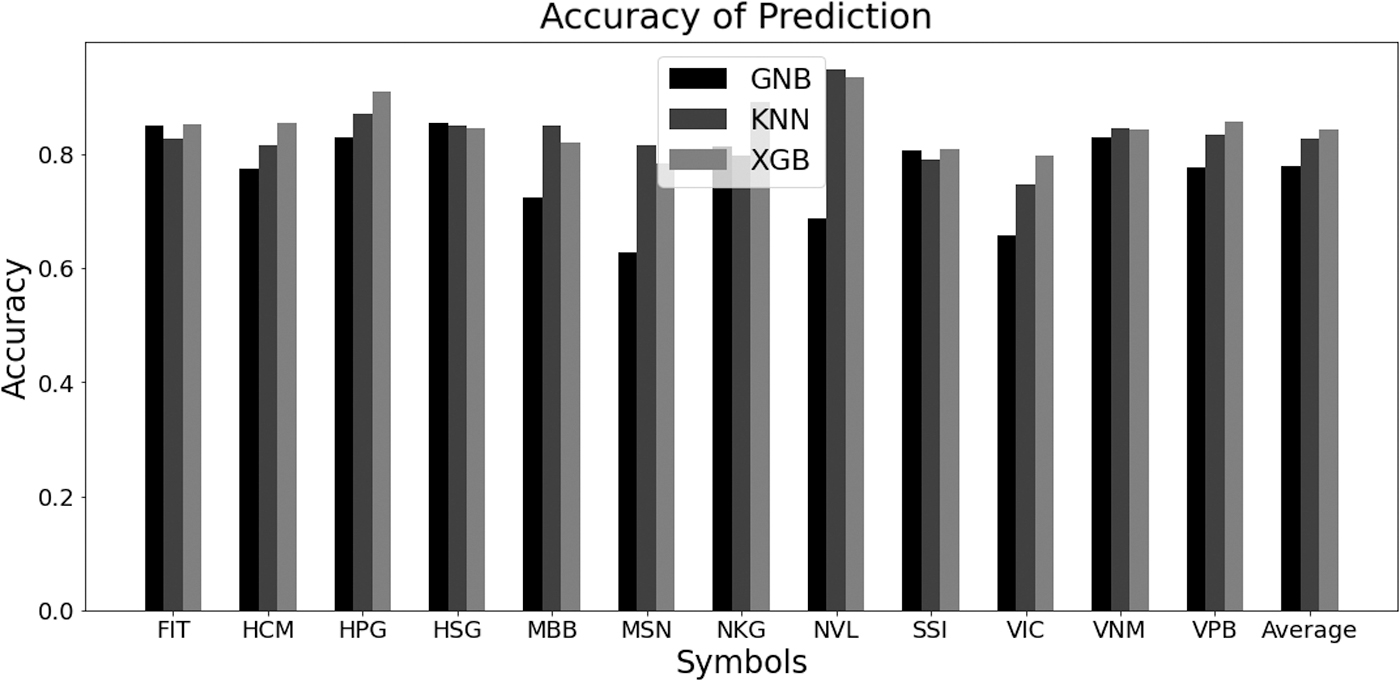
Accuracy of prediction by learning methods for 12 symbols.
The prediction methods are applied for a larger group of VNI stock market, containing 100 symbols for the same time duration already mentioned. Each learning case attempts to predict bullishness of the related symbol. Since each metric represents a specific aspect of performance, the measures for precision, recall, and F-measure are also collected for each prediction case and the average results are expressed in the Table 2 along with computing times. Hence, the performance scores of the three prediction methods under the real-world stock market VNI for 1 year test time are shown in Figure 10.
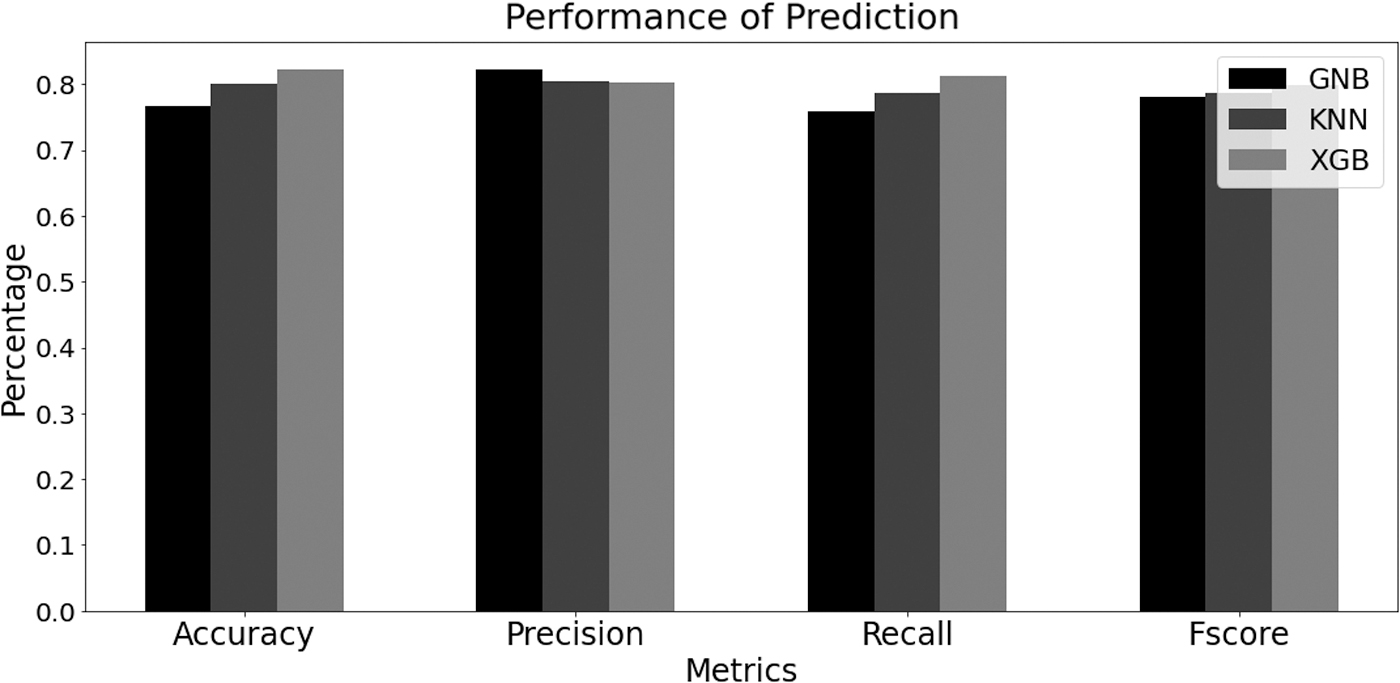
Performance by accuracy, precision, recall, and F-measure for 100 symbols.
Performance by accuracy, precision, recall, and F-measure for 100 symbols
Based on Figure 10, it is intuitive to implement the XGB method rather than applying GNB or KNN because of the high accuracy and Fscore. However, the time spent for the XGB method is the largest. The learning KNN method provided acceptable results and this can be improved for the case of small set of data. The cost of computing the distance between the new point and each existing point is huge, which reduces performance. Notice that we processed retraining for prediction of each test day already, but overall accuracy for the real stock market is still not 100% due to the high volatility of the market. However, the learning method can provide strong tools for data mining and support decision making for trading in financial investment.
Conclusions
In this study, we presented a tool for mining financial data and decision support for trading in the financial market where there are a wide range of information and existing high volatility. We first introduce an inference method based on Bayesian theorem for studying bullishness prediction process. It is interesting to note that the inference model is described in detail for each learning object such as stock symbol, fundamental and technical features, bull market, and bear market. Implementation of inference analysis permits us to investigate in depth the base of prediction process giving high confidence on motivating application for trading market.
Second, the method was seen as constructive both for the certainty of accessing and predicting bullishness of the market, and for delivering better trading decision. This is achieved by empirical implementation of trend prediction for a real stock market. It is essential that update of market information and its indicators completely and timely is necessary for inference. By allowing access to different kinds of data and studying their relations with the bullishness of market, the inference-based learning methods can improve prediction performance.
Footnotes
Acknowledgments
We thank the anonymous reviewers for their careful reading of our article and their many insightful comments and suggestions.
Authors' Contributions
N.A.D. and V.B.D. designed the study. N.A.D. developed the theoretical framework and processed the experimental data. V.B.D. performed the analysis.
Author Disclosure Statement
There are no financial conflicts of interest to disclose.
Funding Information
This research received no specific grant from any funding agency in the public, commercial, or not-for-profit sectors. The authors certify that they have no affiliations with or involvement in any organization or entity with any financial interest (such as honoraria; educational grants; participation in speakers' bureaus; membership, employment, consultancies, stock ownership, or other equity interest; and expert testimony or patent-licensing arrangements), or nonfinancial interest (such as personal or professional relationships, affiliations, knowledge, or beliefs) in the subject matter or materials discussed in this article.