




Abstract
Big data has been satisfactorily used to solve social issues in several parts of the word. Social event prediction is related to social stability and sustainable development. However, current research rarely takes into account the dynamic connections between event actors and learning robust feature representations of social events. Inspired by the graph neural network, we propose a novel Siamese Spatial and Temporal Dynamic Network for predicting social events. Specifically, we use multimodal data containing news articles and global events to construct dynamic graphs based on word co-occurrences and interactions between event actors. Dynamic graphs can model the evolution of social events. By employing the fusion of spatial and temporal dynamic graph representations from heterogeneous historical data, our proposed model predicts the occurrence of future social events for the target country. Qualitative and quantitative analysis of experiment results on multiple real-word datasets shows that our proposed method is competitive against several approaches for social event prediction.
Introduction
If “big data” can be used to help us find the right partner, optimize the choice of hotel room, and solve many other problems in everyday life, 1 it should also be able to help policy makers improve operations by predicting social events. Big data has been satisfactorily used to discover social issues in several parts of the word, including human behavior analysis,2,3 health care,4,5 and economic forecast. 6 In this article, we focus on predicting social events by using big multimodal data. Social events refer to the occurrence of major changes, such as stock market turmoil, wars, protest, strike, etc.
Social event prediction is a crucial task for many key purposes in social stability and sustainable development. For example, the formulation and implementation of a country's new economic policy will inevitably have an impact on prices, stock market, and other related industries. This impact may be positive or negative, and it may also cause public anxiety. Policy makers could adjust policy formulation based on the predicted results to guarantee the precision of policy implementation and minimize the instability.
The outbreak of social events is due to changes in the relationships between social entities, including countries, organizations, and citizens.
7
Therefore, the key to predict social events lies in modeling the dynamic relationships between event actors and learning robust feature representations of social events. Despite substantial progresses in recent years, there are still many challenges for predicting social events:
Social event actors and the relationships between them are dynamically changing. First, the actor of social event participants will change as the event evolves. For example, new actors could join and old actors could withdraw. Second, new relationships could be established between different actors, and old relationships could disappear. The source data used for predicting are always multimodal, noisy, and heterogeneous. Traditional event predicting methods depend on single feature representation with machine-learning pipelines. Obviously, a single feature can no longer meet the demands in the current international environment of complex and multisource information. The static text and dynamic features from the news media should be fused to process. The evolution of social event is multistage, which including genesis of the movement, increase in social unrest, enthusiastic mobilization to develop an organization, maintenance of the organization, and termination.
8
From this perspective, existing approaches usually use a short period of data to model the social event, which ignores the whole process of social event evolution.
We address the earlier challenges by learning spatial and temporal dynamic graph representations of social events from the fusion of big multimodal data. Specifically, it contains two interconnected subproblems: modeling the evolution of social events and predicting the occurrence of social events. We first use word co-occurrences and the interactions between event actors to construct dynamic graphs, including the sequence of text graphs and event graphs.
Dynamic graphs can model the evolution of social events. We also propose a new Siamese network to fuse spatial and temporal information from heterogeneous historical data of news articles and global events to predict whether social events are positive or negative in the future of the target country. Our contributions are summarized as follows:
To model the dynamic changes of social event actors and the relationships between them. We construct a sequence of dynamic text graphs and dynamic event graphs from news articles and global events to model the evolution of social events.
We propose a Siamese Spatial and Temporal Dynamic Network to process the dynamic graphs, which could learn the spatial and temporal dynamic graph representations of social events. Dynamic graph representations are more suitable to understand and analyze the context of social events than static features.
The fusion of spatial and temporal graph representations from the network is used to produce the probability estimation for predicting social events. It takes into account both the semantic features of news articles and the hidden graph embeddings of social events.
The rest of the article is organized as follows. We first review the related work of social event prediction in the Related Work section. The methodology to predict social events of the article is presented in the Social Event Prediction Framework section. In the Experimental Results section, we elaborate the implementation details, and we analyze the experimental results on the large-scale dataset to prove the effectiveness of our method. Finally, the conclusion of our work is drawn in the Conclusion section.
Related Work
The task in this study is to predict whether social events are likely to occur in the target country and given time. In this section, we briefly review previous research relevant to our work, with a focus on feature representation and related approaches.
Feature representation of prediction model
Feature representation is critical for predicting social events in both the regression model and the deep learning model. Recently, more available data and improved models have allowed researchers to use the combination of multiple cues for social events prediction, for example, spatial, temporal, and spatiotemporal fusion. Before that, the single-modal data were used for feature representation to realize prediction. For example, Markov-switching and Bayesian vector autoregression models 9 are used for the Israel-Palestine conflict based on real-time data series from the Kansas Event Data System (KEDS) project. 10
Specifically, density evaluation is used to choose the actual model for any given conflict or region. The research produced prediction for material conflict between the Israelis and Palestinians in 2010. In addition, due to the ability to capture political tension at a higher temporal resolution, news reports are used for forecasting social events. 11 According to the new index, this research found that the number of conflict-related news items increases dramatically before the outbreak of conflict. The time series of these methods are constructed from text.
Therefore, it is important to learn event representation from the text. At present, the commonly used methods include traditional crafted features12,13 and contextual features from deep neural networks. The study 14 proposed a neural network to learn word embedding that describes social events, which are converted into event representation from a function. Other studies are trying to predict not only when but also where social events are likely to break out. Spatial representation of social events is also needed to learn. The study 15 disaggregates spatial information to generate conflict predictions for administrative units. However, single static features from text are not able to describe the changes between event actors.
A dynamic graph convolutional network (GCN) 7 was proposed to encode temporal contextual features into graph representation from historical and prior event documents for predicting social events. Vertexes in graph could represent words and event actors, and edges could represent whether an event happened. To capture temporal information, a graph learning framework 16 based on an event knowledge graph was studied with heterogeneous data fusion to predict concurrent events of multiple types and multiple candidate actors simultaneously.
A unique approach 17 by learning the context of each actor using neighboring actors in a given social graph was proposed for predicting events. A two-level multi-instance learning framework was used to construct a multi-task spatiotemporal correlation graph model 18 for precursor mining coupled with event forecasting.
Based on the earlier methods, static features are not able to capture the dynamic trends in social events effectively. Due to event actors and the relationships between them always changing dynamically, the source data are also becoming more diverse and complex. Therefore, our proposed method considers the spatiotemporal evolution of social events by utilizing dynamic graph representations.
Predicting social events
Recent years have seen the emergence of a series of research that attempts to address the problem of predicting social events. The first prediction models relied on the simple linear regression model, and the second methods are based on machine-learning and deep-learning techniques, an analytical trend that continues to the present day. 1
Integrated Crisis Early Warning System (ICEWS) 19 was developed by the U.S. military for military planners and other decision makers. The goal of ICEWS was to bring together the best modeling approaches to evaluate their integration and could generate and forecast that was more accurate and actionable than any one of the approaches alone could produce, including the agent-based model, separate logistics regression models, and Bayesian techniques.
This study 20 presents a detailed evaluation of Early Model Based Event Recognition using Surrogates, which is a large-scale big data analytics system for social events prediction. The results indicate that message-based architecture is a viable approach to the big data system for forecasting social events. The Autoregressive Fractionally Integrated Moving Average 21 model was used to model all univariate time-series to forecast political conflict.
An autoregressive discrete regression model was applied to geo-located data on events in Bosnia for predicting future conflict. 15 The application of data science was used to discover violence-related issues in Iraq. 22 Specifically, K-Nearest Neighbors (KNN), Decision Trees, and Logistics Regression classification algorithms were applied to discover issues with refugee crises, humanitarian aid, violent protests, etc.
In addition, deep learning 23 methods are increasingly being used in the field of social event prediction.7,16,18 In the prediction of social events, text data such as news articles are often used as features. Although text is always typically represented as a sequence of tokens, there are still lots of Natural Language Processing problems that could be expressed with the graph structure. 24 For example, a graph message passing framework that combines graph structure and temporal features was proposed to predict long-term influenza-like illness. 25
Graph models are suitable for capturing spatial features among the event actors, but temporal information is not easy to be considered. Therefore, our method combines long short-term memory (LSTM) 26 to achieve the prediction of social events on the basis of GCN.27,28 Two novel approaches 29 were proposed to learn long short-term dependencies together with graph structure, which combine LSTM and GCN. Compared with these models, we present the Siamese dynamic network to encode the information from news articles and global events, using dynamic graph features to predict social events.
In the field of social event prediction, news articles are the most commonly used. However, the global events data contain the geographic location information of the event actors, which could be used to model the evolution of social event from the spatial dimension, which is ignored by current methods.
Social Event Prediction Framework
In this section, we present a novel Siamese Spatial and Temporal Dynamic Network in a unified deep architecture for predicting social events. The overview of the framework is shown in Figure 1. We first encode the input data into a sequence of graphs, which contains two streams: (1) encoding news articles into a sequence of text graphs; and (2) encoding global events data into a sequence of event graphs.
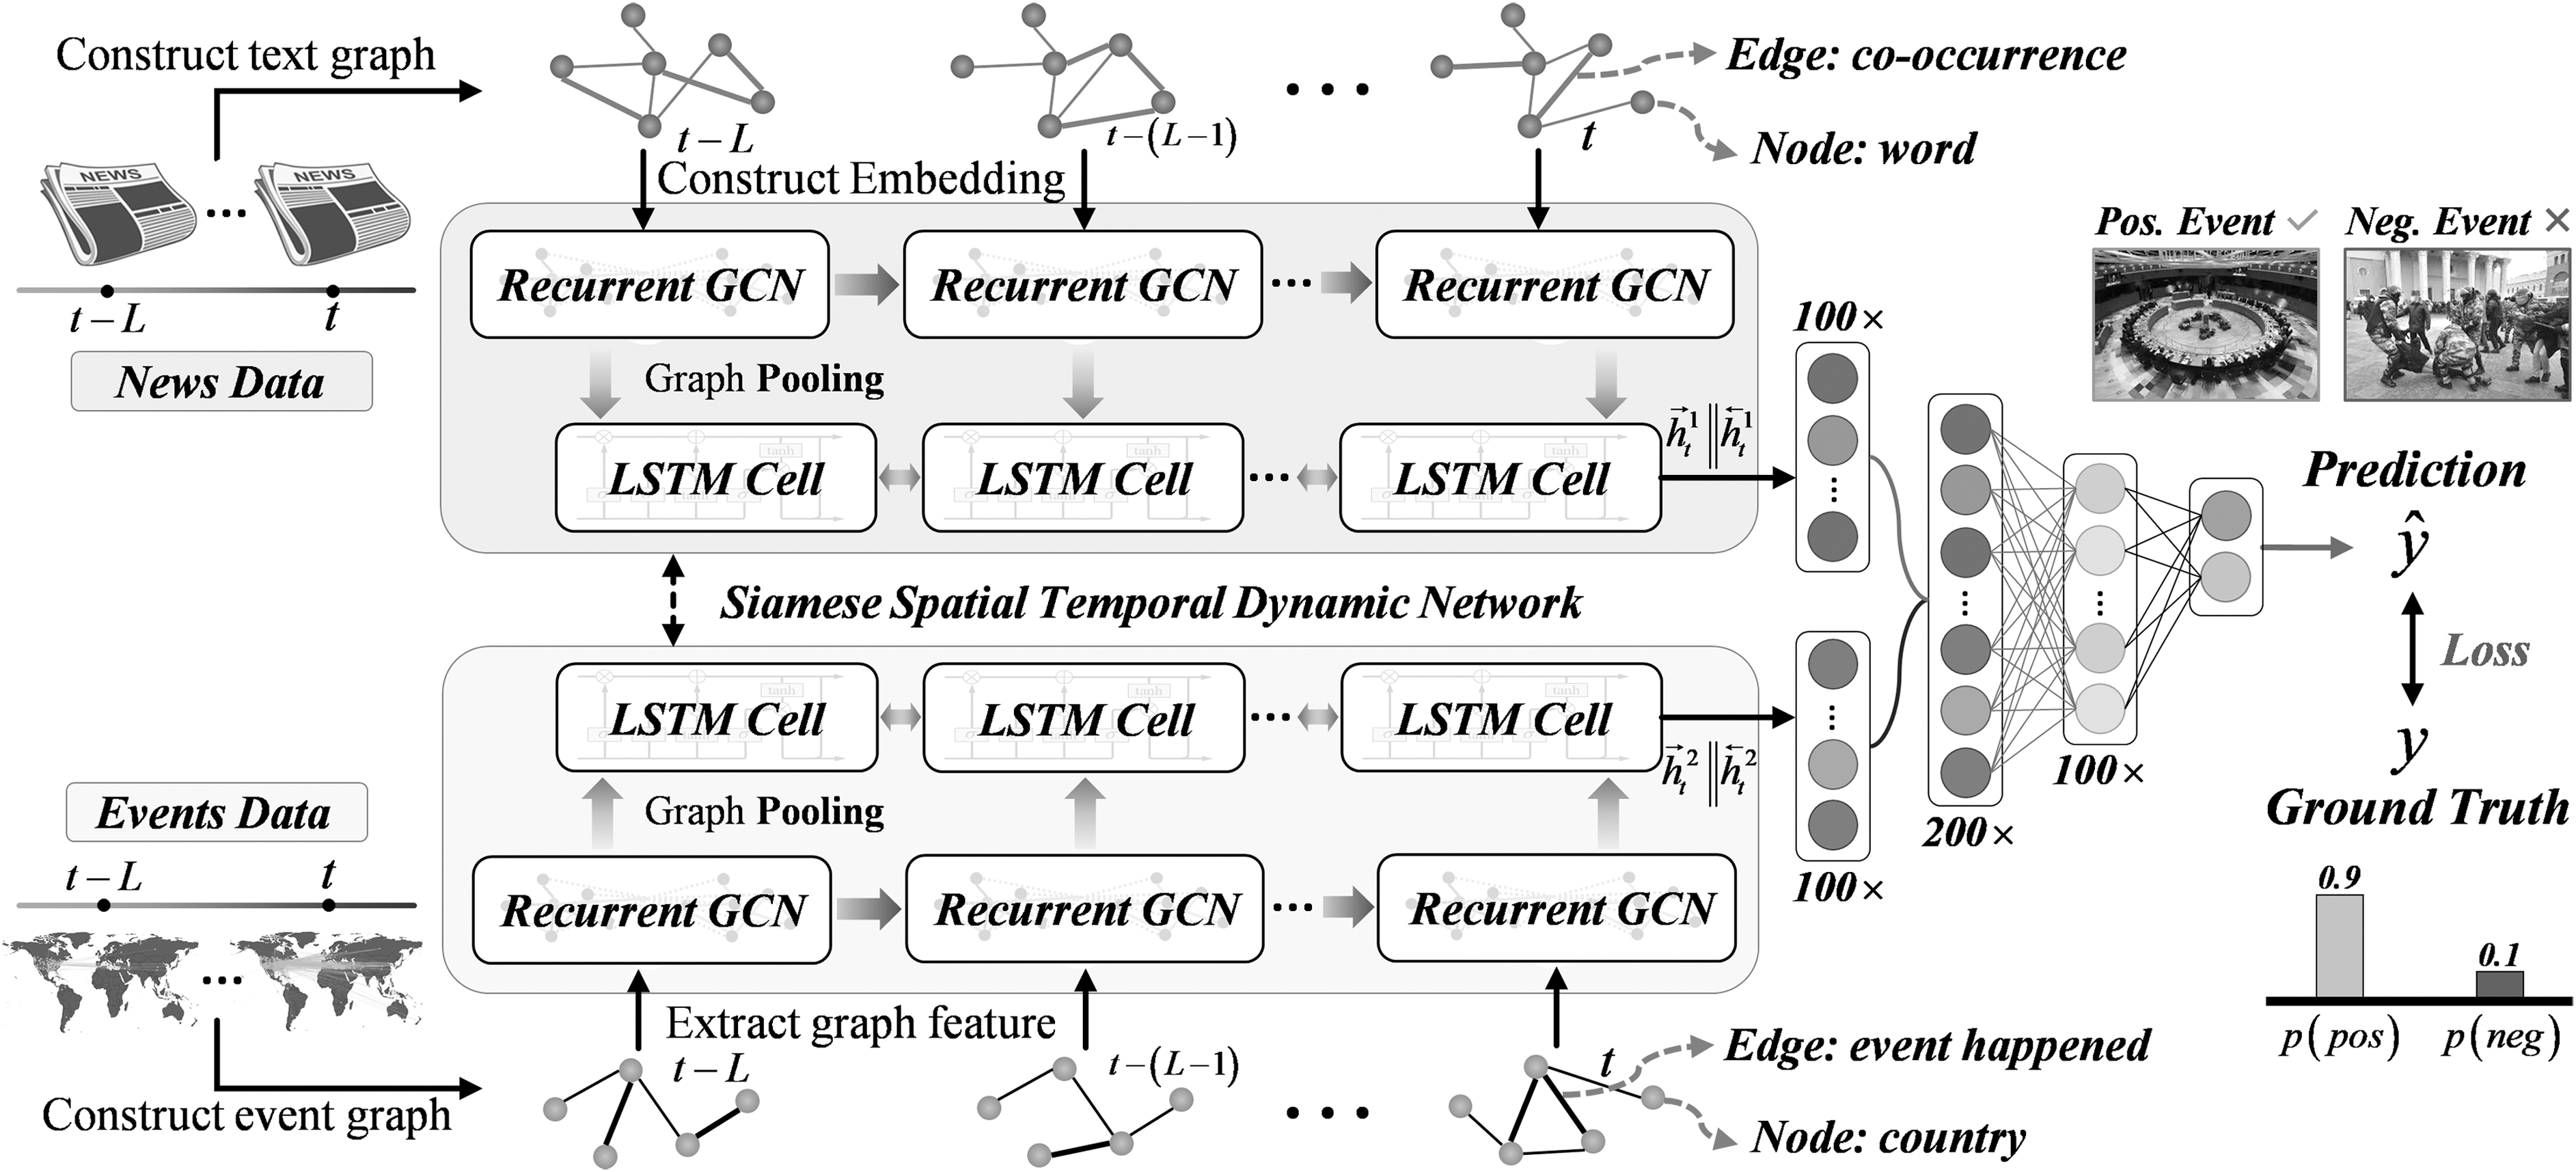
Overview of the social event prediction framework. GCN, graph convolutional network; LSTM, long short-term memory.
Then, we develop a Siamese Spatial and Temporal Dynamic Network based on the two-streams sequence of graphs to predict the occurrence of a certain type of events. For the first time, we fuse social event characteristics from the news and original event recorders, and we use a Siamese dynamic graph network 30 to model the complex changes of the social events.
Specifically, input data consist of news articles and global events data ordered by time. Before the input data are fed into the network, we first construct a sequence of text graphs and event graphs. Each stream of the Siamese Spatial and Temporal Dynamic Network has the same structure, including Recurrent GCN and LSTM Cell with the length of L. For each stream, the input features of graph sequence are first processed by Recurrent GCN, and then the outputs at each time step t are fed into the LSTM Cell for a 100-dimensional feature after graph pooling.
The output of two streams is concatenated, and the result is passed to another fully connected layer, which brings the 200-dimensional feature vector to the final spatial and temporal dynamic graph representation. At last, a softmax layer is followed to produce a probability estimation based on binary classification. The loss is calculated between the network output and ground truth.
Dynamic graph
In this work, we propose a Siamese Spatial and Temporal Dynamic Network to predict the social events based on news data and global events data by using the dynamic graph network. Therefore, we first transform our text-based input into graph structure and graph representation, including the dynamic text graph and the dynamic event graph.
Dynamic text graph
News articles play an important role in the evolution of social events. For the past historical news articles, we create a dynamic text graph. Specifically, we convert the news articles at each time step (represents 1 day) into a text graph, whose structure changes dynamically with time. To distinguish from the event graph in the following, the adjacency matrix of text graph at time step t is denoted as
The multiple text graphs are represented by a sequence of adjacency matrices
For each graph, the nodes are words and the dimension of the adjacency matrix is the total number of unique words. In this article, we build a vocabulary by eliminating the common words and extremely rare words from all the news data, and the adjacency matrix dimension n is the vocabulary size. The n is 301, one of which is an unknown character <UNK> in this article. We connect word nodes within a reasonable window in the news articles for 1 day rather than directly fully connecting all the word nodes. In other words, edges in the text graph represent co-occurrences between the terms within a fixed-size sliding window.31,32
To calculate weights between two-word nodes, we employ article-based point-wise mutual information (PMI),
33
a popular measure for word association. The weight of the edge between node i and node j at time t for the dynamic text graph is defined as:
We calculate the weight of the edge from the news articles at time t, and the
where
Dynamic event graph
In addition to using news articles to build a dynamic text graph, we also use global events data at each time step to build an event graph, whose structure changes dynamically with time. The dynamic event graph is constructed based on Global Database of Events, Language and Tone (GDELT) dataset, which contains >200-million geolocated events with global coverage for 1979 to the present. 34 The GDELT event records capture two actors and the action performed by Actor1 and Actor2. The actor corresponds to the country participating in the event.
We create multiple event actor relation graphs that are represented by a sequence of adjacency matrices
Feature representation
In the dynamic text graph, the feature representation of each word node in the graph is initialed by the word embedding 35 and can be updated by training. The word embedding is pretrained on a large corpus such as the Google News Dataset.
In the dynamic event graph, we use a one-hot vector to represent the feature of each event actor in the event graph at each time step.
Siamese spatial and temporal dynamic network
After constructing the dynamic text graph and dynamic event graph, we introduce our proposed model, the Siamese Spatial and Temporal Dynamic Network. The novel unified network learning spatial and temporal dynamic graph represents social events whereas it makes a prediction of social events.
As shown in Figure 1, the input of the network contains two streams: (1) the dynamic text graph, which is represented as a sequence of adjacency matrices
Graph convolutional networks
The GCN
27
is a multilayer neural network that operates directly on a graph and induces feature embedding vectors of nodes based on properties of their neighborhoods. Since the Siamese network has the same structure of two streams, for the convenience of description, we will omit the upper and lower subscripts for formulaic description. Formally, consider a graph
The GCN can capture the information only about immediate neighbors with one layer of convolution. When multiple GCN layers are stacked, information about larger neighborhoods is integrated. For a one-layer GCN, the new node feature matrix is computed as:
where
where l denotes the layer number and
Spatial and temporal dynamic network
The spatial and temporal dynamic network is designed to process graph data in both space and time, which could capture both local features of nodes at each time step and long-range spatiotemporal interactions between the adjacent time step. This network takes into consideration local information by iterative message passing at the spatial level between the connected nodes using GCN. In addition, this network integrates long-range temporal information by recurrence in time. As shown in Figure 1, the spatial and temporal dynamic network consists of recurrent GCN and LSTM cells, which are used to learn about spatial and temporal graph representation.
The structure of recurrent GCN is shown in Figure 2, and the messages are passed iteratively in both space and time. In the temporal processing stage, each node receives messages from the previous time step for updating the state. At the spatial stage, the graph nodes update states from both present and past, and they use message passing to exchange information. The message passing is realized by GCN. As mentioned earlier, the spatial representation
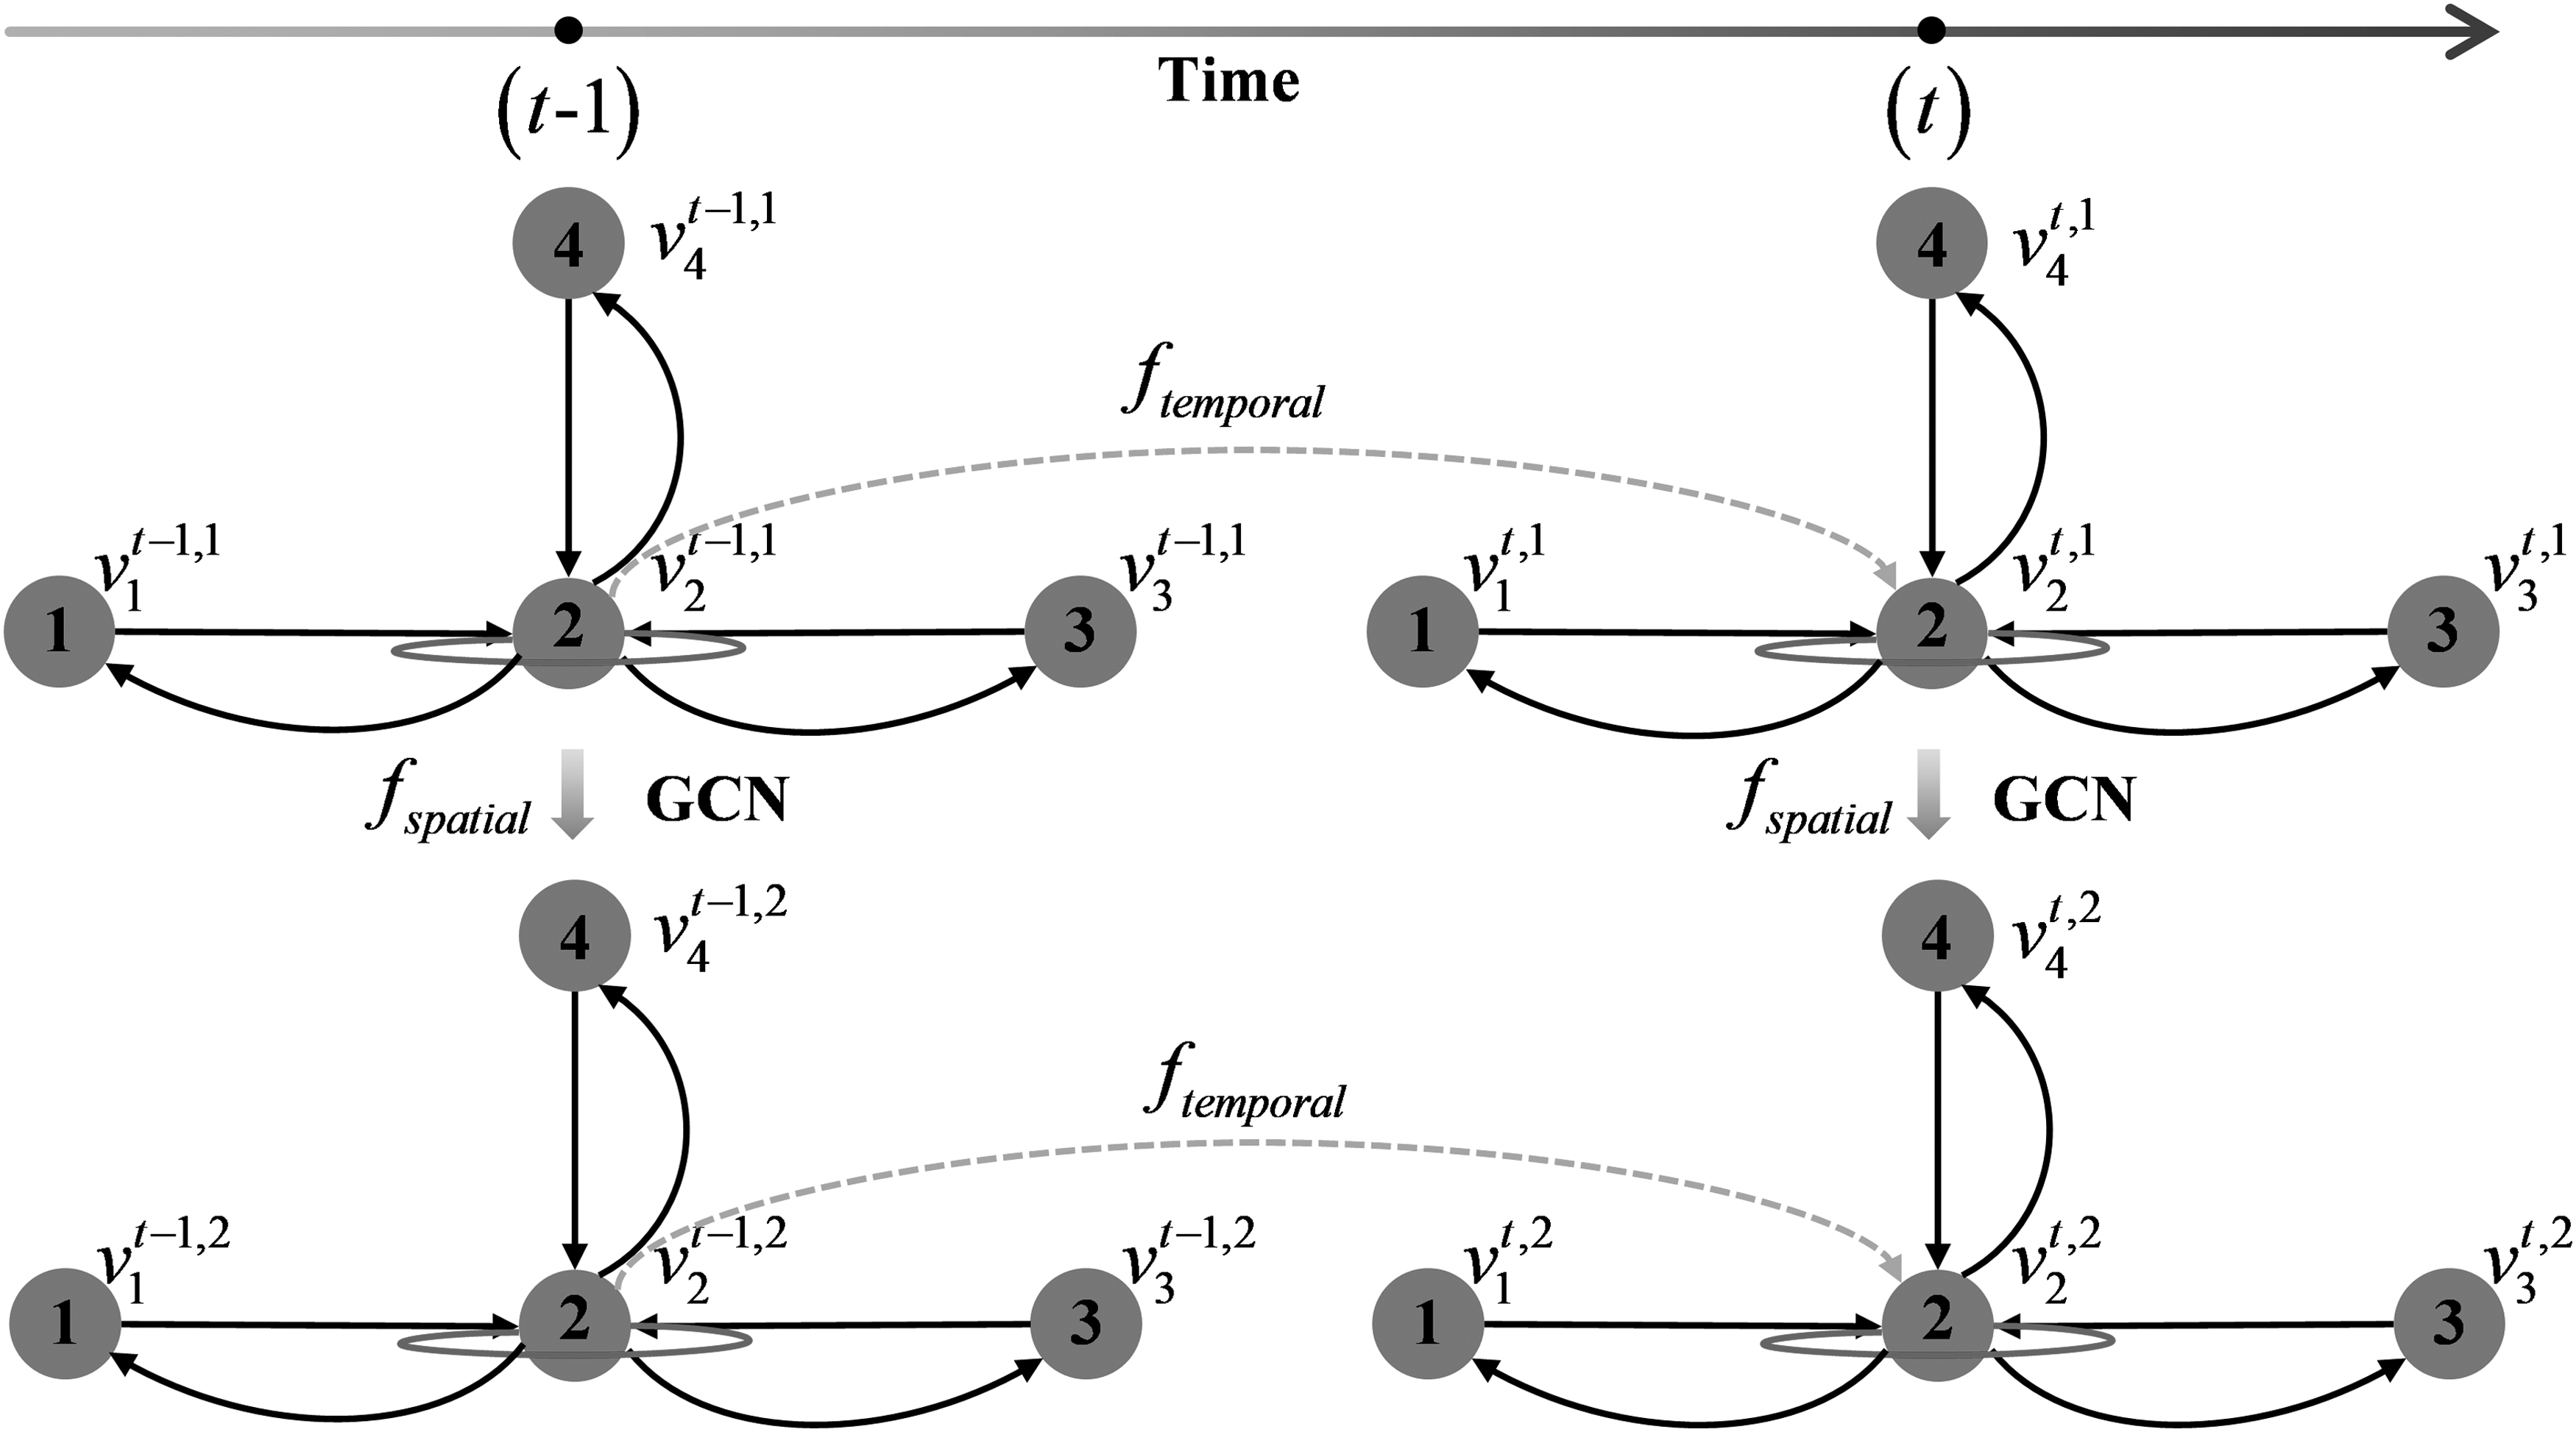
Overview of the recurrent GCN.
The temporal process stage updates each node state with information from its correspondent state in the previous time step at the same iteration. In other words, the features of node i updated at time step t are as follows:
where
Siamese prediction network
We pass the sequence of text graphs through the spatial and temporal dynamic network until it finally produces a 100-dimensional feature vector. Meanwhile, we also feed the sequence of the event graph into the same network that maps it to a 100-dimensional vector. The LSTM cell is a bi-directional structure. We use the hidden state of the final LSTM cell as feature vectors of the Siamese network.
The LSTM's output of the two streams is concatenated, and then the result is passed to another fully connected layer, which brings the 200-dimensional vector to a 100-dimensional feature vector. We train our Siamese prediction network by using a softmax classifier for the 0/1 classification problem.
Optimization
Finally, for the proposed Siamese Spatial and Temporal Dynamic Network, the values of the parameters determine how accurately the model performs the task of social events prediction. We transform the problem of prediction into a classification, that is, to predict whether social events occur at target time step. Therefore, binary cross entropy loss function is defined to evaluate the model performance. The goal is to minimize the loss and thereby to find parameter values that match predictions with reality.
We compare the prediction value of the Siamese Spatial and Temporal Dynamic Network with the ground truth and optimize the binary cross entropy loss:
where y is ground truth, corresponding to whether there is a social event at target time step in reality. And
Experimental Results
Dataset
As mentioned earlier, our Siamese Spatial and Temporal Dynamic Network contains two stream inputs. The first input is the sequence of the text graph, which is generated from the news data. The second input is the sequence of the event graph, which is generated from the GDELT dataset. 34 In the following, we will introduce these two datasets.
The GDELT contains >200-million events with global coverage for 1979 to the present. The data are based on news reports from different international news sources, which are coded by using the Textual Analysis by Augmented Replacement Instructions system 37 for events. Each GDELT data record is mainly composed of five parts, which are Event ID and Date, Event Actors, Event Action, Event Geography, and Data Management. Each event record has a Goldstein score, 38 which captures the likely impact that the type of event will have on the stability of a country.
Goldstein score with a value between −10 and +10 theoretically measures the potential impact of the event on the country. A negative value represents a negative impact, a positive value represents a positive impact, and 0 represents a neutral event. The larger the absolute value, the deeper the influence, and vice versa.
In this article, we regard the event that scores greater than 0 as positive, ≤0 as negative. In this manner, the event labels of the 0/1 classification are generated for network training. Events data between 2016 and 2020 from four countries are used, including the United States of American, the United Kingdom, Russia, and North Korea.
For the insignificance of the current news dataset, we follow the robots protocol to crawl available news from the related news website, and to form a large news dataset based on the New York Times Corpus. 39 The news dataset contains the date of publication, the full text of the headline, the abstract of the news, and the page number. The dataset includes news from the four countries mentioned earlier. Table 1 lists the key statistics of our news dataset.
News dataset statistics
In this article, we select a part of data from Table 1 for training. The news data from 2016 to 2020 of the United States of America in the New York Times are collected for the training network. We collect 5 years of news data from 2016 to 2020 of the United Kingdom in the Guardian. We also involve news data from 2016 to 2020 of Russia in the Kommersant for training. Due to the limitation of data, we only choose news in Pyongyang Times and Rodong Sinmun for social event prediction in North Korea.
Implementation details
We use the standard classification indicators to evaluate the prediction performance of our model. The metrics include: Precision (Prec.), Recall (Rec.), and F1 Score (F1). The flow diagram of our method is shown in Figure 3. Source data are divided into training data and test data. In the training phase, we construct the text graph and the event graph from events data and news data first, and we feed graph feature representations of dynamic graphs into our Siamese Spatial and Temporal Dynamic Network for learning parameters of the model. The pretrained model is used for predicting social events directly in the test phase.

Flow diagram of our method.
The hyper-parameters of the network are chosen from cross-validation. We train the Siamese Spatial and Temporal Dynamic Network from scratch, with a mini-batch size of 1, and a learning rate of 1e-6. The weights of the network are initialized in the way of Kaiming Initialization. 40 The biases are set to 0. Meanwhile, we use Adam 36 to minimize the loss. The bi-directional LSTM is trained with one layer and 50 hidden units of each direction, and the sequence length of LSTM is experimentally set to 6 for all datasets. The maximum of the training epoch is set to 10, which is enough to reach convergence. The output dimension of recurrent GCN is 100. Our network runs on 2 NVIDIA Tesla P4.
Except North Korea, data of the other three countries from 2016 to 2018 are used as the training set (30% of which are used as the validation set to prevent network overfitting), and data from 2019 to 2020 are used as the test set.
Ablation study
Impact of sequence length for input
One of the hyper-parameters of our model is the sequence length L of input data, which is the number of time steps used while training the dynamic network. Figure 4 shows the F1 score on the validation dataset of four target countries under different sequence lengths for our Siamese dynamic network. The performance gradually declines after 6 sequence lengths in all four countries. The F1 scores of the United States and the United Kingdom have similar trends.
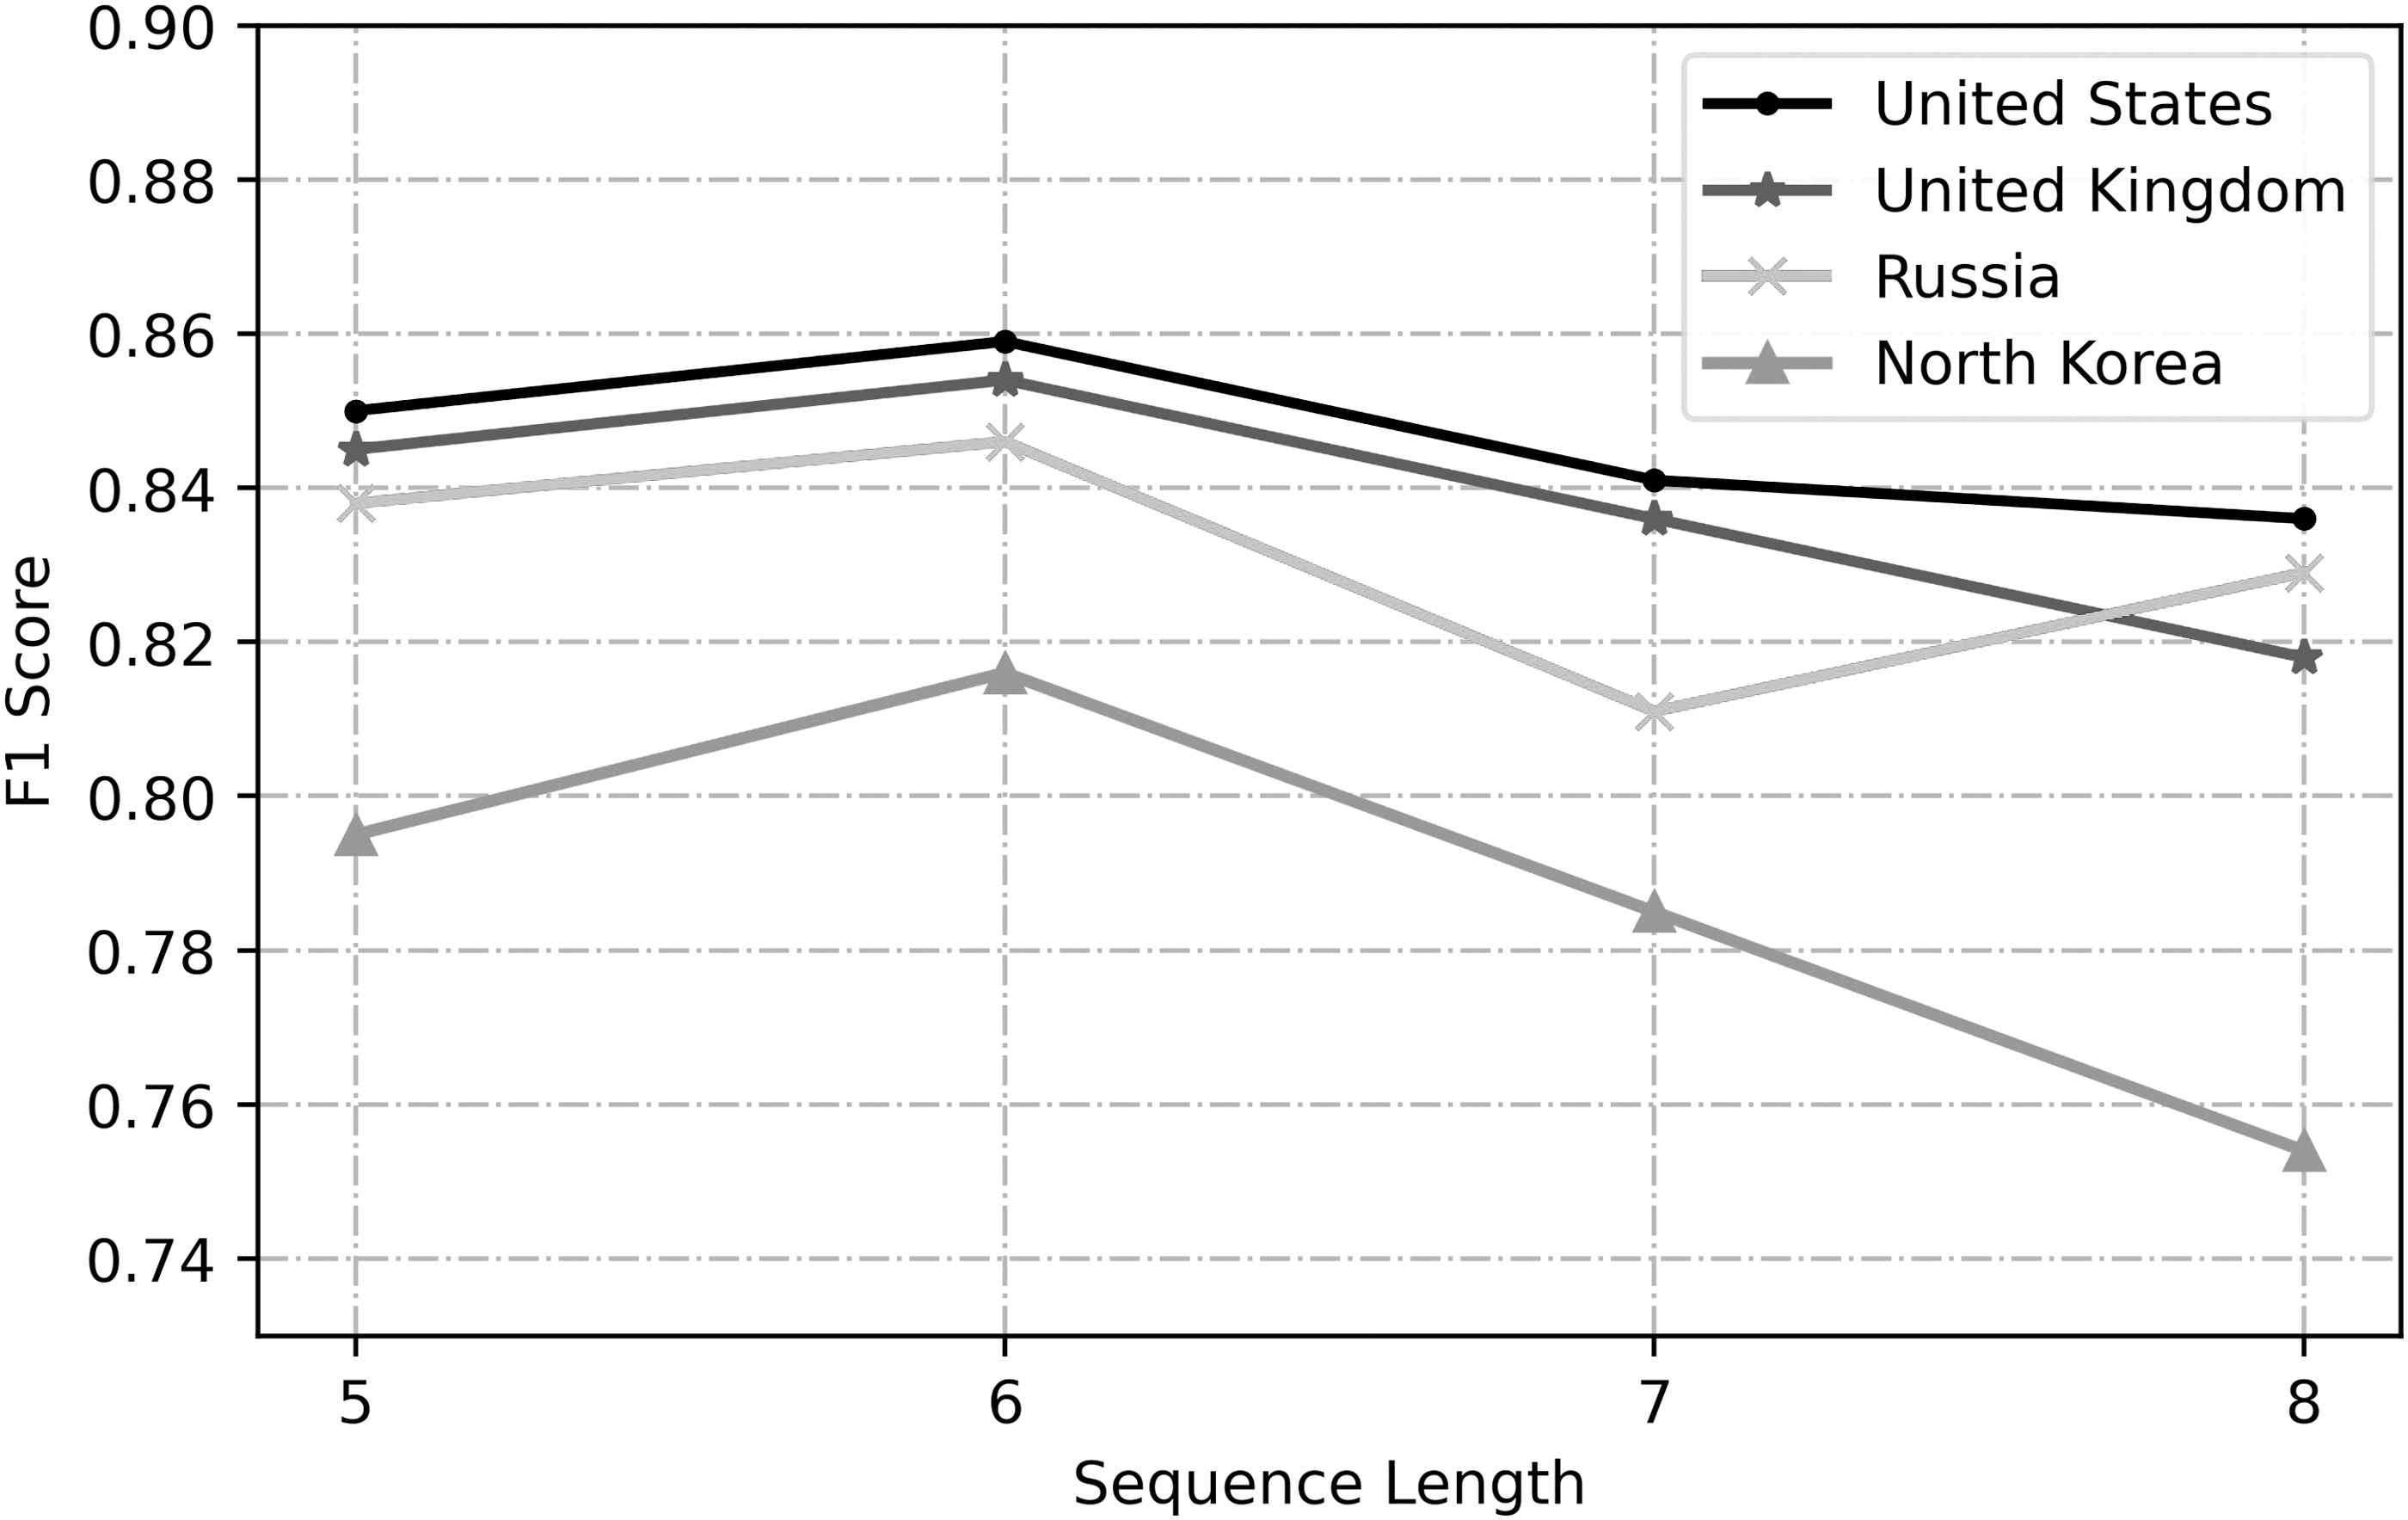
Analysis of the sequence length for the input data of our model on the validation set.
When the sequence length is 6, the F1 scores are the largest, and then they show a downward trend. For Russia, although the F1 score begins to increase when the sequence length is 8, it is still less than the F1 score when the sequence length is 6. When the sequence length is greater than 6, the F1 score of North Korea decreases rapidly. Therefore, the value of hyper-parameters of the sequence length L is taken as 6 in our experiments.
In addition, although the input sequence length has different effects on the prediction results, even if the optimal sequence length is not selected, the F1 score is approximately equal to 0.8. F1 is the harmonic mean of recall and precision of the classifier. These results also confirm our claim that the dynamic network can effectively model the dependence of the news and event graph.
Impact of multiple inputs
We investigate the contribution of different inputs in our Siamese Spatial and Temporal Dynamic Network by evaluating the performance in terms of the classification indicator on the validation set. Table 2 presents the evaluation result, and it is summarized as follows:
Analysis of our model on the validation set using a different set of inputs, including dynamic text graph sequence (N) and dynamic event graph sequence (E)
Best in bold.
The most important input is the dynamic text graph sequence. The model using the dynamic text graph sequence has the highest value of precision (0.67 in the United States, 0.653 in the United Kingdom, 0.656 in the Russia, and 0.715 in the North Korea), recall (0.819 in the United States, 0.808 in the United Kingdom, 0.810 in the Russia, and 0.845 in the North Korea), and F1 score (0.737 in the United States, 0.723 in the United Kingdom, 0.725 in the Russia, and 0.774 in the North Korea) than the model using the dynamic event graph sequence in four countries.
It can be explained by the fact that news data play a vital role in the evolution of social events. Almost all social events will be reported by the news media, and news records all the essential information of social events. Therefore, our model could extract hidden semantic features of social events that are contained in news to achieve reliable prediction.
The input of the dynamic event graph sequence helps to improve the performance of social event prediction (F1 increased from 0.737 to 0.859 in the experiment of the United States, growth rate is 23%, and other countries have similar improvement. The growth rate of F1 for the United Kingdom, Russia, and North Korea is 18%, 17%, and 5.4%, respectively). Our model not only extracts the semantic information of the social events from the news, but it also considers the changes of location and relationship between the event actors.
Compared with single-modal data, multimodal fusion of feature representations significantly improves the accuracy of social event prediction. The input combines the dynamic text graph sequence and the event graph sequence and has the highest value of precision (0.818 in the United States, 0.812 in the United Kingdom, 0.802 in Russia, and 0.765 in the North Korea), recall (0.904 in the United States, 0.901 in the United Kingdom, 0.896 in Russia, and 0.875 in the North Korea), and F1 score (0.859 in the United States, 0.854 in the United Kingdom, 0.846 in Russia, and 0.816 in the North Korea) in four countries.
Experimental results and discussion
We compare our method with other approaches on the test set, and the quantitative results are presented in Table 3. We employ the basic GCN model to replace the recurrent GCN that we proposed, and the LSTM cell is compared with recurrent neural network (RNN) and gated recurrent unit (GRU). Further, we compare our method with the other approaches that combine basic GCN, RNN, and LSTM.
Social events prediction performance on the test set
Bold values signifies the best values.
GCN, graph convolutional network; GRU, gated recurrent unit; LSTM, long short-term memory; RNN, recurrent neural network.
The GCN+RNN combines basic GCN and RNN to capture spatial and temporal correlations in social events. Each basic GCN of each time step processes the text graph or event graph at this time, and the basic GCN output is processed by RNN.
The GCN+LSTM is a variation of GCN+RNN; we change the RNN to LSTM, which is used to process the temporal information from the basic GCN layer at each time step.
The GCN+GRU is similar to GCN+RNN, and we replace the RNN module with a relatively complicated GRU unit.
Table 3 reports the prediction performance of our proposed Siamese Spatial and Temporal Dynamic Network in comparison to other methods for the task of forecasting social events. Our method outperforms previous methods on multiple metrics such as the precision, recall, and F1 score. At first, the effectiveness of LSTM in extracting temporal features is illustrated. The method of “GCN+LSTM” has the highest value of precision (0.726 in the United States, 0.708 in the United Kingdom, 0.696 in Russia, and 0.714 in the North Korea), recall (0.852 in the United States, 0.841 in the United Kingdom, 0.834 in Russia, and 0.845 in the North Korea), and F1 score (0.784 in the United States, 0.769 in the United Kingdom, 0.759 in Russia, and 0.774 in the North Korea) in four countries.
Further, we compare with GCN+LSTM, which also adopted the LSTM cell but with the basic GCN module, we obtain an improvement in F1 score (0.816 vs. 0.784 in the United States), recall (0.875 vs. 0.852 in the United States), and precision (0.765 vs. 0.726 in the United States); other countries have the same improvement. Using the dynamic recurrent GCN of multiple inputs makes our method to recover the long-term dependencies in the temporal dimension and the dynamic change of relationship between event actors in the spatial dimension.
Hence, we get the highest precision (0.765 in the United States, 0.739 in the United Kingdom, 0.728 in Russia, and 0.747 in the North Korea) and F1 score (0.816 in the United States, 0.794 in the United Kingdom, 0.786 in Russia, and 0.802 in the North Korea) for all the four countries. The result demonstrates our perspective that the Siamese Spatial and Temporal Dynamic Network that combines recurrent GCN and LSTM effectively extracts the hidden features of target social events from the constructed dynamic text graph sequence and event graph sequence for social event prediction.
We use a sparse representation for the adjacency matrix of the text graph and the event graph at each time step. Each stream of the Siamese Spatial and Temporal Dynamic Network has the same structure, including the recurrent GCN, LSTM cell with the length of 6, and the fully connected layer. The operation of the inverse matrix in GCN and state update of all nodes will rapidly increase the complexity of our model. Therefore, the Number of Floating Point Operations for one forward propagation is 30 × 109, and the number of parameters is 1.9 × 10⁵. However, <1 second is required for predicting the test.
We present a case study to prove the validity of our proposed method. That is, the evolution of the social events is modeled through the dynamic graph network, and then the spatial and temporal features are extracted to predict the social events. We select a target social event that occurred in Russia on April 7, 2019. Figure 5 shows the extracted dynamic text graphs in the history before the target event from news based on our model. In each graph, the nodes that are highly related to the target event are highlighted, and the thickness of the edge indicates the weight.

Extracted dynamic text graphs over time based on our model. The texts given next are summaries of the news about the event for the given day.
The target social event was a rally against landfill in the Arkhangelsk on April 7, 2019. In 2018, in the Lensky District of Arkhangelsk, the construction of the landfill at Shies Station started secretly. This project aims at importing and processing garbage from Moscow and has caused a large-scale protest from northerners, which are being discussed throughout Russia. In June 2019, this project was forced to be cancelled and Governor Igor Orlov, who actively defended the interests of investors, resigned.
Two days before this event, our model detected that the police began to use force against opponents of the landfill. Keywords such as opponent, against, and demolish are shown in the graph. One day before the target event, on April 6, an administrative offense report was drawn up against the organizer of the rally. The weighted thick edges “against-organizer” and “protest-action” show that there might be a negative collective social event. The repression of the police and the implementation of a series of administrative measures accelerated the outbreak of this event, whereas it lasted for a long time. Dynamic text graphs can be used to assist in social event prediction and to achieve accurate prediction results based on the evolution of the social event.
In the case study of the anti-landfill social event, we also analyze the evolution of the social event from a global perspective. As shown in Figure 6, all countries related to the target social event are connected to each other in the spatial dimension. Two days before the anti-landfill social event, related events occurred in many countries around the word. Based on the dynamic event graphs, our model heralds the outbreak of the target social event.

Dynamic event graphs over time from a global perspective. Nodes are event actors, and edges represent whether there is an event between the two countries.
Conclusion
Social event prediction plays a vital role in making decisions for policy makers, which is related to social stability and sustainable development. To model the evolution of social event, this article proposes a novel Siamese Spatial and Temporal Dynamic Network for predicting social events. Each stream of the Siamese Network has same structure, including recurrent GCN and LSTM cell. Multimodal data contain news articles and global events to construct dynamic graphs based on word co-occurrences and interactions between event actors.
For each stream, the input of dynamic graphs is first processed by recurrent GCN, and then the outputs at each time step are fed into the LSTM cell. The context information of news articles and events is encoded into graph representations, and then the spatial and temporal dynamic graph representations of two streams from heterogeneous historical data are fused to predict the occurrence of future social events for the target country based on binary classification.
Through a quantitative analysis of the experimental results on the GDELT and News dataset, it can be proved that we get the highest precision and F1 score for the United States, the United Kingdom, Russia, and North Korea. The result demonstrates our proposed Siamese Spatial and Temporal Dynamic Network, which combines recurrent GCN and LSTM and effectively extracts the hidden features of target social events from the constructed dynamic text graph sequence and event graph sequence for social event prediction, which could model the dynamic evolution of social events.
In addition, we take the rally against landfill in the Arkhangelsk as an example to conduct a qualitative analysis of our method. This proves that dynamic text graphs can be used to assist in social event prediction and to achieve accurate prediction results based on the evolution of the social events.
In future work, we plan to explore a few directions: (1) We will extract the key factors that affect the evolution of social events. As we all know, there are many factors that affect social events at multi-stages, such as entity interactions and policy change. This article only considers spatial and temporal dimensions, and it fails to achieve fine-grained social event modeling.
(2) We will consider long-term event dependency. In this work, we focus on short-term social event predicting and explanation. However, the evolution of social events can be related to activities in the past and changes in the future.
(3) Another important direction is to consider lightweight deep networks for predicting social events. In this work, we focus on precise forecasting and explanation, and the computational complexity is ignored. We must ensure our method is employed in real society.
Footnotes
Disclaimer
This article has been submitted solely to this journal and is not published, in press, or submitted elsewhere.
Author Disclosure Statement
No competing financial interests exist.
Funding Information
This work was supported by the National Natural Science Foundation of China under 61775175, 61771378, 61601355, and 62071359, and by the Key Research and Development Program of Shaanxi Province-Key Industry Innovation Chain (Group)-Industrial Field under No. 2019ZDLGY10-06.