




Abstract
Vehicle intelligent classification plays a vital role in the Intelligent Transport Systems. However, due to the dynamic traffic environments, it is difficult to ensure the classification accuracy. Therefore, this article uses a new pulse coherent radar (PCR) to collect road vehicle data, and a vehicle classification method of sparrow search algorithm extreme learning machine (SSA-ELM) based on big multimodal data analysis is proposed. First, the road vehicle data are collected by PCR, where the vehicle length, chassis outline, and height features are extracted as the sample data. Then, the ELM is utilized to learn these three modal features. According to the input feature data, the vehicle type is classified, including cars, sport-utility vehicles, and buses. Finally, the SSA is applied to optimize the initial weights and thresholds of ELM. Experimental results show that SSA-ELM has notable advantages in classification accuracy and convergence speed, compared with existing benchmark methods.
Introduction
With the rapid development of artificial intelligence, Internet of things, the fifth-generation (5G) mobile communication systems and other innovative technologies, 1 intelligent transport systems (ITS) play an increasingly important roles in smart cities, which can significantly reduce the energy consumption and improve the quality and interactivity of urban transportation systems. 2 Traffic information collection is the basis of ITS.3,4 Based on accurate traffic information, ITS can provide a variety of services for traffic management departments and residents, including traffic flow detection, self-parking, automatic driving, and other applications.5,6
Vehicle intelligent classification has been envisioned as an essential technology in ITS, and the accurate classification of vehicle types is required by many transportations.7,8 For example, the classification of vehicles on the road can help ITS to conduct effective traffic planning and avoid road congestions. 9 For instance, the automatic classification of vehicles on highways is helpful to improve the efficiency of the highway toll system and reduce the cost of toll agencies and government agencies. 10
In the autonomous driving scenario, the classification of special vehicles such as buses, ambulances, and police cars can better help to implement ITS priority scheduling and improve the flexibility of path planning for autonomous driving vehicles under exceptional circumstances.11,12 In addition, there may be other potential applications of vehicle classification, including safety studies, and self-service parking system design.13–15
At present, many vehicle intelligent classification methods based on different sensors have been proposed, such as induction coil, magnetic sensor, camera, piezoelectric sensor, LiDAR, and pulse radar.16,17 The induction coil technology is relatively mature, but the installation of the coil may damage the road surface, and deployment cost is high. The magnetic sensor has the advantages of low cost, low power consumption, and a long service cycle. However, it is vulnerable to magnetic interference from adjacent lanes or urban rail transit vehicles.18,19
Compared with the magnetic sensor, the camera can provide area detection and rich data, such as license plate numbers. However, its performance is easily affected by bad weather, night and vehicle shadow. In addition, outdoor video acquisition needs powerlines and communication lines. 20 Hence, the cost of installation and maintenance is high. The chosen radar sensors in ITS mainly are lidar and millimeter-wave radar in autopilot applications. 21 Lidar and millimeter-wave radars have long-range and high accuracy, but they are not suitable for traffic detection due to high power consumption, volume, and cost. 22
Compared with the aforementioned techniques, this article adopts a new type of pulse coherent radar (PCR) to collect vehicle data for achieving the vehicle classification. PCR is free from natural interferences such as noise, light, and magnetic fields. 23 When vehicles pass through PCR, the PCR-generated data can reflect the vehicle chassis profile and height features, which can be used for vehicle classification. Therefore, this article proposes a vehicle intelligent classification through using PCR data to train extreme learning machine (ELM).
First, the vehicle data collected in the natural road environment was transformed into the feature vector. Then, the sample data were used to train the ELM. Finally, for generating the training parameters randomly in the initial stage of training, we design a sparrow search algorithm (SSA) to optimize the limit learning machine. The proposed classification model outputs the vehicle type according to the characteristic vector of the PCR vehicle data. The main contributions of this article are summarized as follows:
A feature extraction method is designed to extract the vehicle length, chassis contour, and height features from the vehicle data collected on the road by the PCR. A new sparrows search algorithm is proposed to optimize the extreme learning method for vehicle intelligent classification. According to the input feature vector and the corresponding label training extreme learning, vehicles are divided into three types, such as cars, sport-utility vehicles (SUVs), and buses. The SSA optimizes the ELM's initial weights and bias parameters, then retrains the ELM with the optimized parameters.
The rest of this article is organized as follows. The related study is introduced in Related Works section. Problem Description section describes the problem. The classification model design is described in Classification Model Design section. The experiment results are discussed in Experiment and Result Analysis section. Conclusion section concludes the article.
Related Works
There have been many kinds of research works on vehicle classification based on different sensors. In Ref., 24 a group of magnetic sensors are placed on the roadside for vehicle detection and classification, in which vehicles are divided into four groups by estimating their magnetic lengths. In Ref., 25 a separate three-axis magnetic sensor is deployed along the road, using a two-dimensional convolutional neural network to convert each vehicle's magnetic field data into a two-dimensional image, dividing the vehicle into seven categories. A wireless magnetic sensor system was proposed in Ref. 26 According to the local magnetic field disturbance caused by different types of vehicles, the characteristics of the magnetic waveforms needed for vehicle identification and speed estimation are extracted.
In Ref., 27 the author installed a PCR sensor node in the middle of each parking space and realizes parking detection by feature extraction and multiple predictions of radar data. In Ref., 28 a support vector machine (SVM) vehicle low power radar classification method based on energy and width features was proposed. First, the motion trajectory of the target is extracted by image processing method. Then, the signal-to-noise ratio is improved by coherent integration, and the distance unit of the target is determined by the endpoint detection algorithm based on double threshold. Finally, all kinds of vehicles’ energy and width features are extracted, and the SVM classifier is applied to classify the vehicles into two categories: big cars and small cars.
ELM is a kind of single-hidden layer feedforward neural network (SLFN). 29 The authors in Ref. 30 proposed a system to classify vehicles using their extracted characteristics from traffic surveillance systems. Neural networks trained using ELM are applied to acquire well-performed systems with reasonable training time. Meanwhile, with the rapid development of swarm intelligence algorithms, such as the whale optimization algorithm (WOA), 31 the Harris algorithm (HHA), 32 and the SSA. 33 Many scholars began to study the improvement of ELM using swarm intelligence algorithms to make ELM produce better training results.34–36
With the development of artificial intelligence, 37 more and more deep learning algorithms have been applied to vehicle classification based on camera. 38 A vehicle classification system using depth convolutional neural network (D-CNN) was developed in Ref., 39 which was designed to quickly and accurately extract vehicle features. The experimental results have shown that the classification accuracy rate of the method reaches 89%. In Ref., 40 the author proposed a new mobile network-based vehicle detection method and integrates it into a Faster region convolutional neural network (R-CNN) structure.
Compared with the Faster R-CNN, the method improves the detection accuracy and saves computing resources. In Ref., 41 3D target detection and key point detection were integrated into a unified D-CNN, improve Faster R-CNN through multitask learning, and propose a three-dimensional based on a single image. The literature 42 proposed a real-time vehicle detection classification model based on YOLOV3. The model uses an end-to-end method to identify, positioning, and classifying vehicles in an image, with a classification accuracy of 95.05%.
Although there have been many works on vehicle classification based on magnetic sensors or cameras, it is difficult to solve the interference problems of magnetic sensors and cameras. Moreover, the previous lidar and millimeter-wave radar are not suitable for traffic information collection because of the high power consumption, size, and cost. The new low-power radar PCR is not disturbed by the magnetic field, sunlight, and weather, which is expected to make up the shortcomings of the current vehicle classification technology. Therefore, it is meaningful to investigate the vehicle classification method by exploiting the new PCR.
Problem Description
PCR is a new type of pulse radar working in the 60 GHz band, which can achieve the millimeter-level accuracy. PCR combines the high precision of coherent radar with the low power consumption characteristics of pulse radar. Similar to pulse radar it turns off the radio between pulse transmissions, and as in coherent radar it emits a pulse train, also known as a scan. As shown in Figure 1 PCR provides envelope service, which describes the energy-related data received by radar sensors at different distances.

The time domain transmitted signal from PCR. PCR, pulse coherent radar.
An envelope measurement is accomplished by transmitting a sequence of radar pulses and measuring the energy level from the time delay echo of the pulse transmission. PCR has the advantages of low power consumption, small size, low cost, with an area of only 29 mm2, and is not affected by natural interference sources such as noise, dust, color, direct, or scattered light. The data set used in this article comes from the PCR of Acconeer A111 to collect the information of cars, SUVs, and buses passing on the road. The specific feature extraction process will be described in detail in Feature Extraction Process section.
The A111 working in Envelope mode performs one measurement by transmitting a sequence of radar pulses and measuring the received pulses energy in different time intervals. Figure 2 shows the envelope data collected when a car passes through PCR. The Envelope data generated during the t-th time slot will be

Vehicle envelope data.
where
where
where
The design goal is to achieve the precise vehicle type classification when the vehicle passes through the radar. The vehicle type is obtained from the vehicle envelope data when a vehicle moves toward and away from PCR.
where Ci is the type of the ith vehicle, which is divided into three types, namely cars, SUVs, and buses.
Classification Model Design
The PCR is deployed in the middle of the roadway and it is assumed that the vehicles driving in a lane. PCR provides envelope data, supports high precision ranging, and can reflect the height and contour of vehicle chassis. When a vehicle passes PCR, the features of vehicle length, chassis height, and contour are extracted from the data generated by PCR. The extracted feature data is standardized and used as a sample set to train the ELM. The SSA optimizes the ELM's initial weights and bias parameters and then retrains the ELM with the optimized parameters. Figure 3 shows the flow of the proposed classification method, which is mainly composed of feature extraction, ELM classifier, and ELM initial parameter optimization.
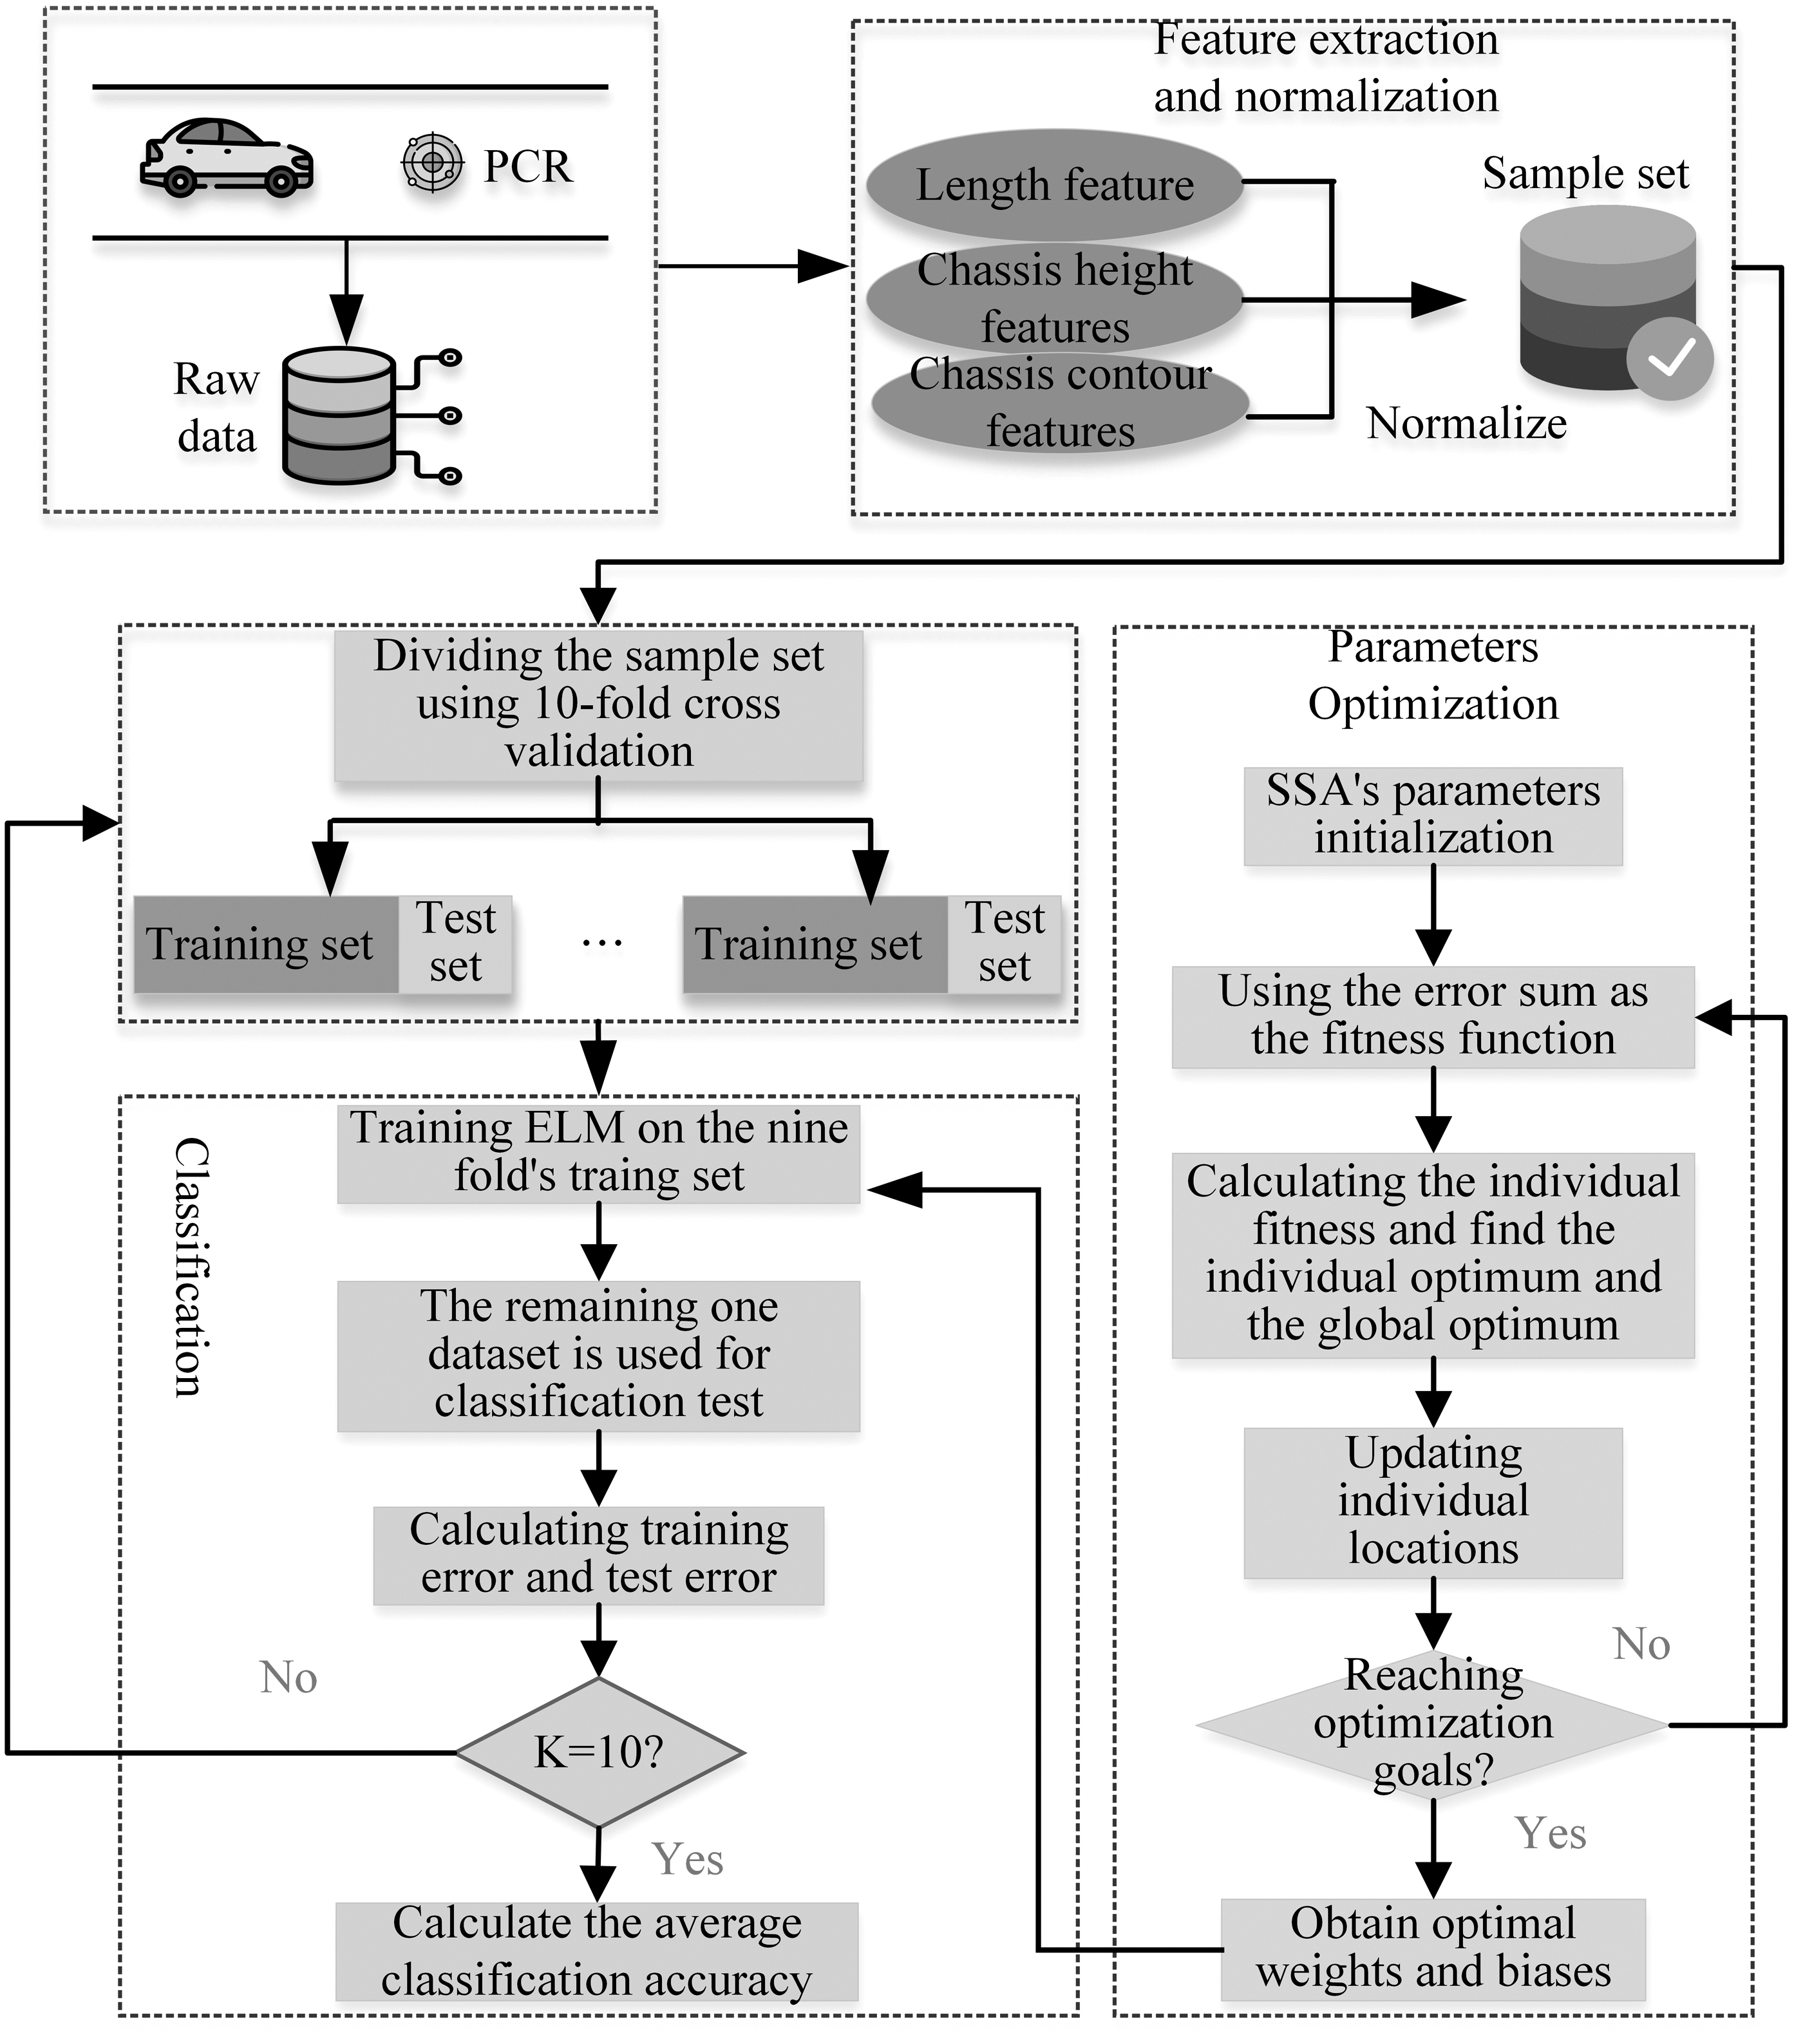
Flowchart of road vehicle classification.
Feature extraction process
Vehicle length feature extraction
According to the speed and vehicle sample, the vehicle length can be calculated by the following formula:
where l is the vehicle length, v denotes the vehicle speed, width stands for the total number of measured vehicle sample, and f is the measurement frequency.
Vehicle chassis contour feature extraction
According to the principle of the envelopment model, there is a reflector at the position of the wave peak. Since the data are collected during vehicle driving and the vehicle chassis is not uniform, the envelopment data measured in the vehicle samples generally have multiple peaks. The peak positions of envelope data are related to the heights and shapes of the vehicle chassis. In addition, the width of vehicle samples varies with the speed and length of the road vehicle. Therefore, it is necessary to match the size of the different vehicle samples for subsequent classification.
To save storage and computing resources, we fixed the width to the median of all sample widths rather than the maximum sample widths. In particular, when the sample width is less than the median, we use cubic spline interpolation on each row of the sample to extend the vehicle sample size to
Vehicle chassis height feature extraction
Owing to the multiple crests in the envelope data, it is not easy to calculate the chassis height accurately. Therefore, in this scheme, the vehicle chassis height is approximated by the maximum point
where hi is the sample height obtained from the ith measurement.
The most important feature that distinguishes buses from cars and SUVs is vehicle length feature. The most important feature that distinguishes cars from SUVs is vehicle chassis contour feature. The vehicle chassis height feature is mainly used to identify SUVs, because the chassis of SUVs is usually higher than that of other types of vehicles. Through the combination of these three modal features, vehicle classification can be more accurate.
ELM classifier
In ELM, hidden nodes are given randomly without iterative adjustments. Thus, it is only needed to learn the weight between the hidden and output layers. As a result, ELM has the advantages of few training parameters, high learning speed, and strong generalization ability when applied to classification tasks.
The ELM structure is in Figure 4 There is a training set
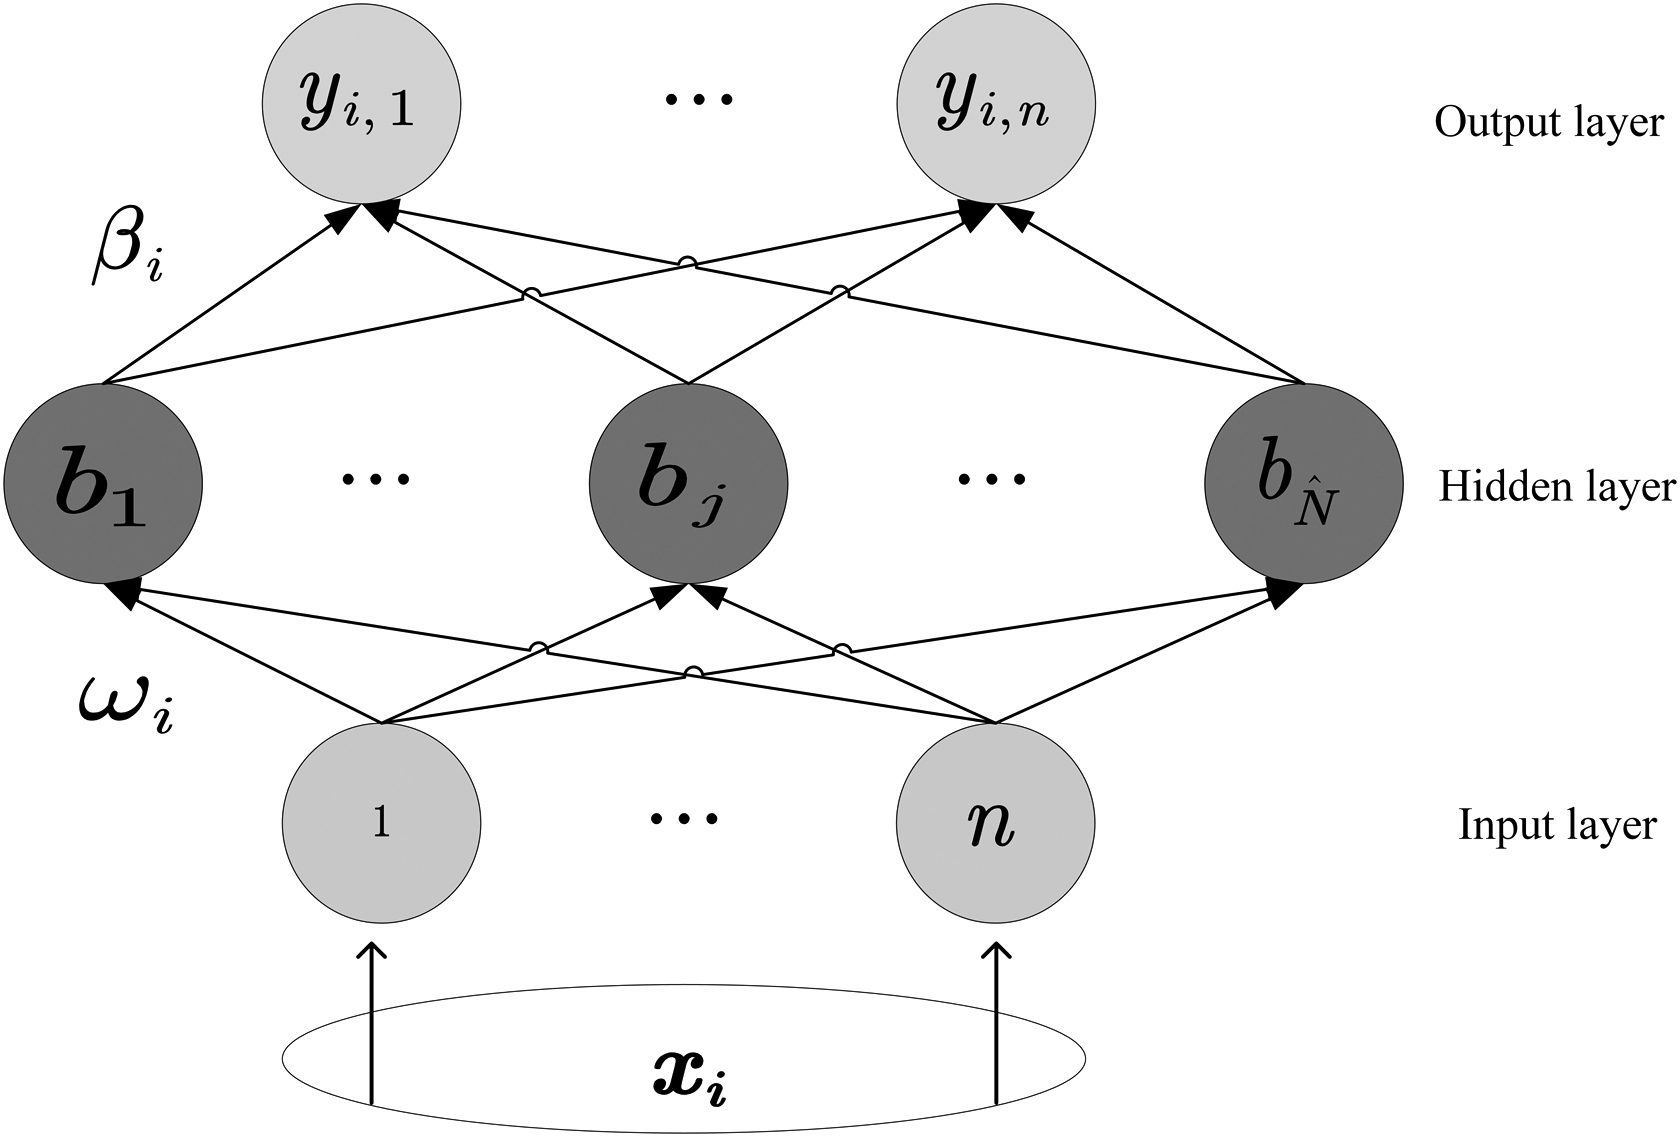
ELM architecture. ELM, extreme learning machine.
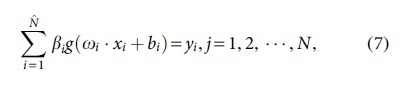
where
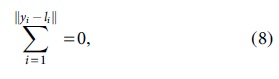
where yi is the output value of ELM model, li is the actual value of training sample. The smaller the error between yi value and li value, the higher the accuracy of ELM model.
The matrix form is expressed as
where H is the hidden layer output matrix:
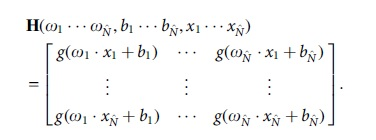
In ELM algorithm, once the input weights
where
After feature extraction in Feature Extraction Process section, we obtain the vehicle length, vehicle chassis height, and contour features. In this article, 1048 vehicle data were obtained, including 268 buses, 457 cars, and 323 SUVs. These data are normalized and divided into training samples and test samples. The three classification features are input data for training ELMs. Corresponding type tags are the output of ultimate learning machines. After training, we can get an ELM classifier for identifying buses, cars, and SUVs.
SSA-ELM classifier
SSA is a novel intelligent optimization algorithm proposed in 2020. SSA is mainly inspired by sparrow's foraging behavior and antipredation behavior. Some recent studies have demonstrated the advantages of SSA in convergence speed, convergence accuracy, and stability.
In the process of sparrow foraging, the group is divided into discoverers and participants. Location update model of discoverer will be

where
When the sparrows are aware of the danger, they engage in antipredation behavior. Generally speaking, the sparrows are aware of the danger account for 10%–20%. of the population. The mathematical model can be described as follows:
where
As we know from ELM Classifier section, the initial weights and thresholds generated each time are random. Most of these randomly generated values are poor, which makes some hidden layer nodes invalid, and further leads to poor prediction effect, lack of stability, and other problems.
To solve this problem, a sparrow search algorithm extreme learning machine (SSA-ELM) method is proposed. Using the excellent global search ability of SSA, the optimal hidden layer input weights and thresholds are found through iterative search. Then the classification model is obtained by training the ELM. Exploiting the SSA method to optimize ELM, the prediction results are more accurate without increasing the number of hidden nodes, and the generalization ability of the algorithm is improved. The process of the proposed method is shown in Figure 3. It consists of three parts: feature extraction, ELM classifier, and ELM initial parameter optimization.
The feature extraction part is carried out according to step Feature Extraction Process section. It is responsible for processing the original data collected by PCR into sample data composed of vehicle length feature, chassis height feature, and chassis contour feature. Standardized processing is also performed for ELM classifier training.
ELM classifier uses the selected sample set for training. Each time randomly selects nine samples for training, the remaining one as the verification set.
In the ELM initialization parameter optimization part, the SSA is used to search the best initial input weight and hidden layer deviation, and the fitness function is designed as the sum of the error rate of the training set and the error rate of the test set, to make the trained network have better results in both the test set and the training set, which can be expressed as follows:
where
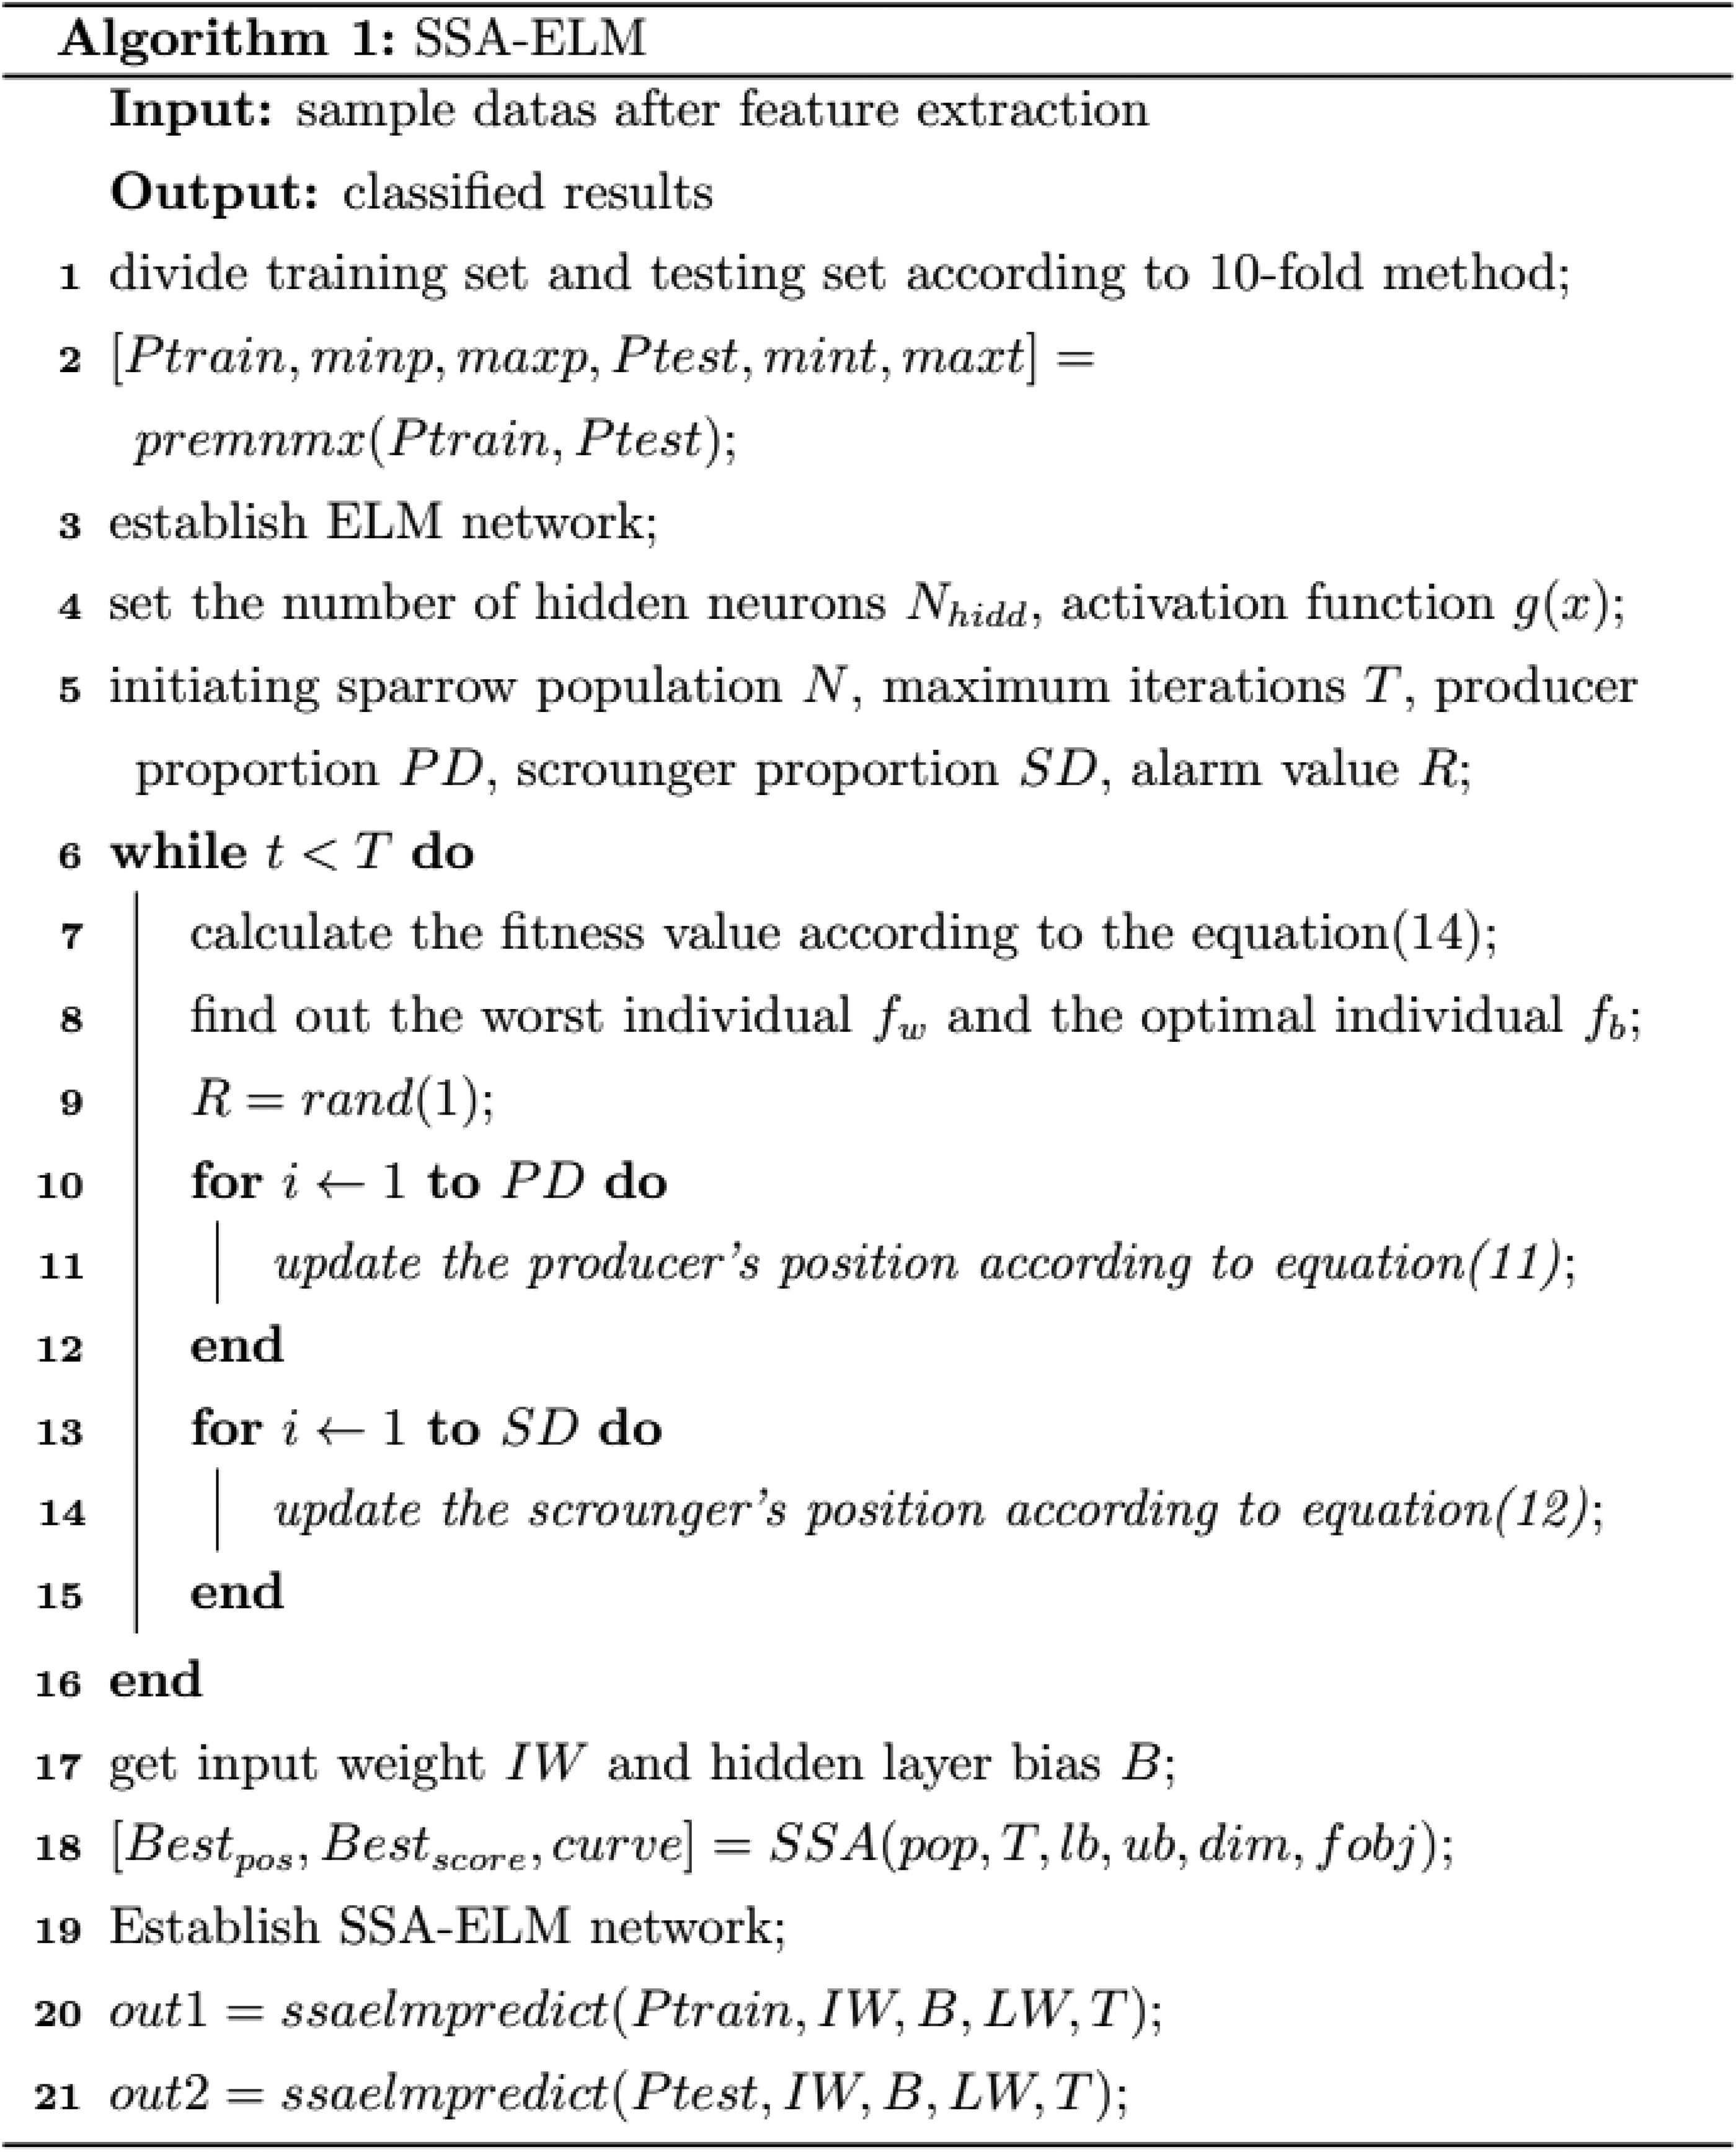
SSA-ELM, sparrow search algorithm extreme learning machine.
Experiment and Result Analysis
In this article, 10-fold cross validation is used to evaluate the classification method. The method randomly divides the sample into 10 equal parts, 9 of which for training and the other for testing. The process can be repeated 10 times, with different parts selected for training and testing each time. After averaging the test results 10 times, the test results of the algorithm on the whole eigenvector set are obtained.
To evaluate the effectiveness of the proposed method, a variety of algorithms are selected for comparison. CNN is a classical machine learning method. Particle swarm optimization-ELM is a classical ELM optimization method. In addition, two novel intelligent optimization algorithms, namely WOA and Harris hawks optimization, are compared. Classification accuracy (ACC), recall and training time were adopted as evaluation indicators. The simulation parameters are listed in Table 1. Besides, we have
TP is the number of samples belonging to this type and classified as this type. TN is the number of samples belonging to other type and classified as other type. FP is the number of samples belonging to this type and classified as other type. FN is the number of samples belonging to other type and classified as this type.
ELM classification performance
In Figure 5, we reveal the relationship between the number of hidden layer nodes and the classification accuracy. It can be seen that the classification accuracy increases with the number of hidden layer nodes. When the number of hidden nodes reaches 12, the classification accuracy reaches the highest value and keeps stable. Based on this observation, in the subsequent training process, we fixed the number of hidden layer nodes to 12, for ensuring the classification accuracy and avoiding the extra training time.
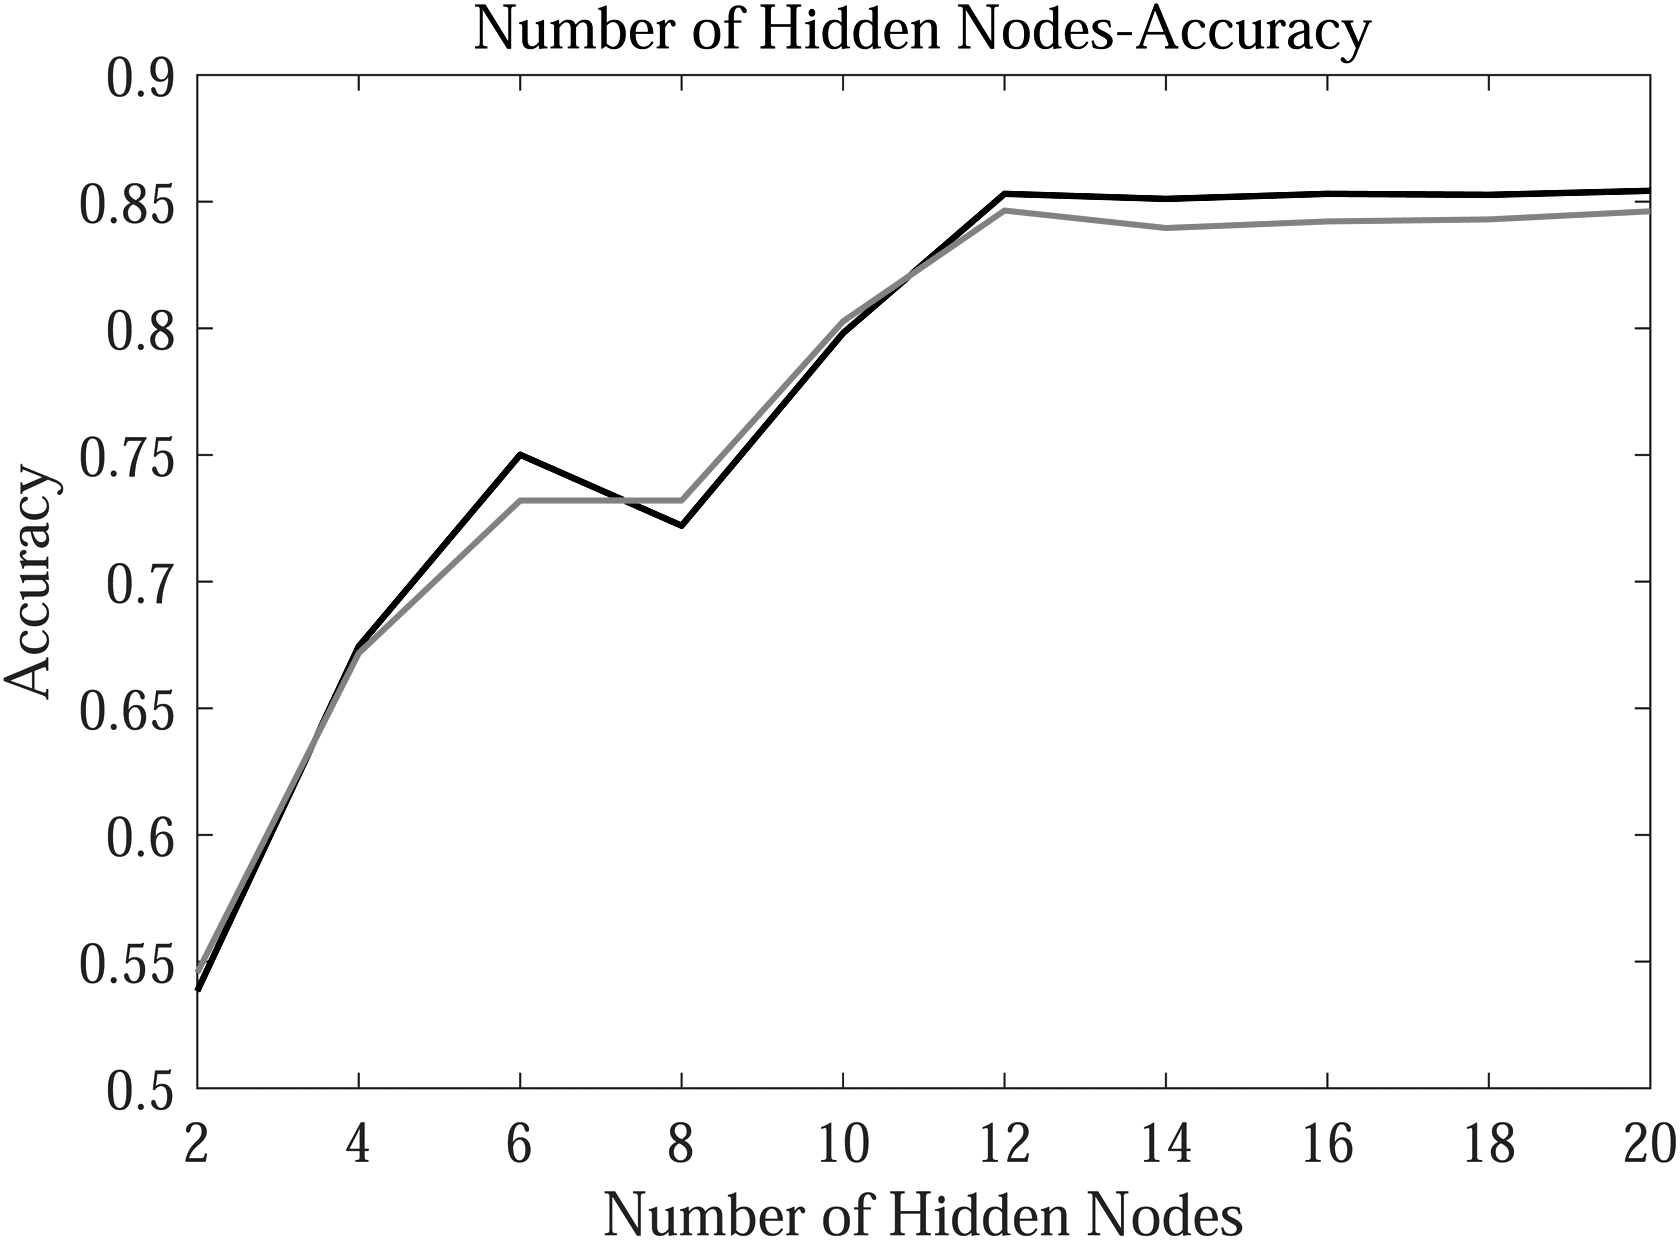
Classification accuracy versus number of hidden nodes.
Then, we plot the classification results of ELM in Figure 6 labels one to three represent buses, cars, and SUVs, respectively. The blue dots and the yellow dots denote the actual category and the classification result, respectively. When the yellow dots coincide with the blue dots, we can derive that the classification result is correct. It can be observed that there is more quantity of the SUVs classification error.

Classification results of ELM.
Figure 7 shows the classification results confusion matrix. Each row represents the classification results, each column represents the actual category, the total number of each row represents the number of output for the category, and the total number of each column represents the actual number of the category. The numbers in light red area represent the number of samples belonging to this type and classified as other types. For example, from the second row of Figure 7, it can be seen that 4 cars are misclassified as buses and 20 cars are misclassified as SUVs. As seen from the diagram, there are more misclassifications of cars and SUVs due to the similarity of chassis profile characteristics between cars and SUVs.
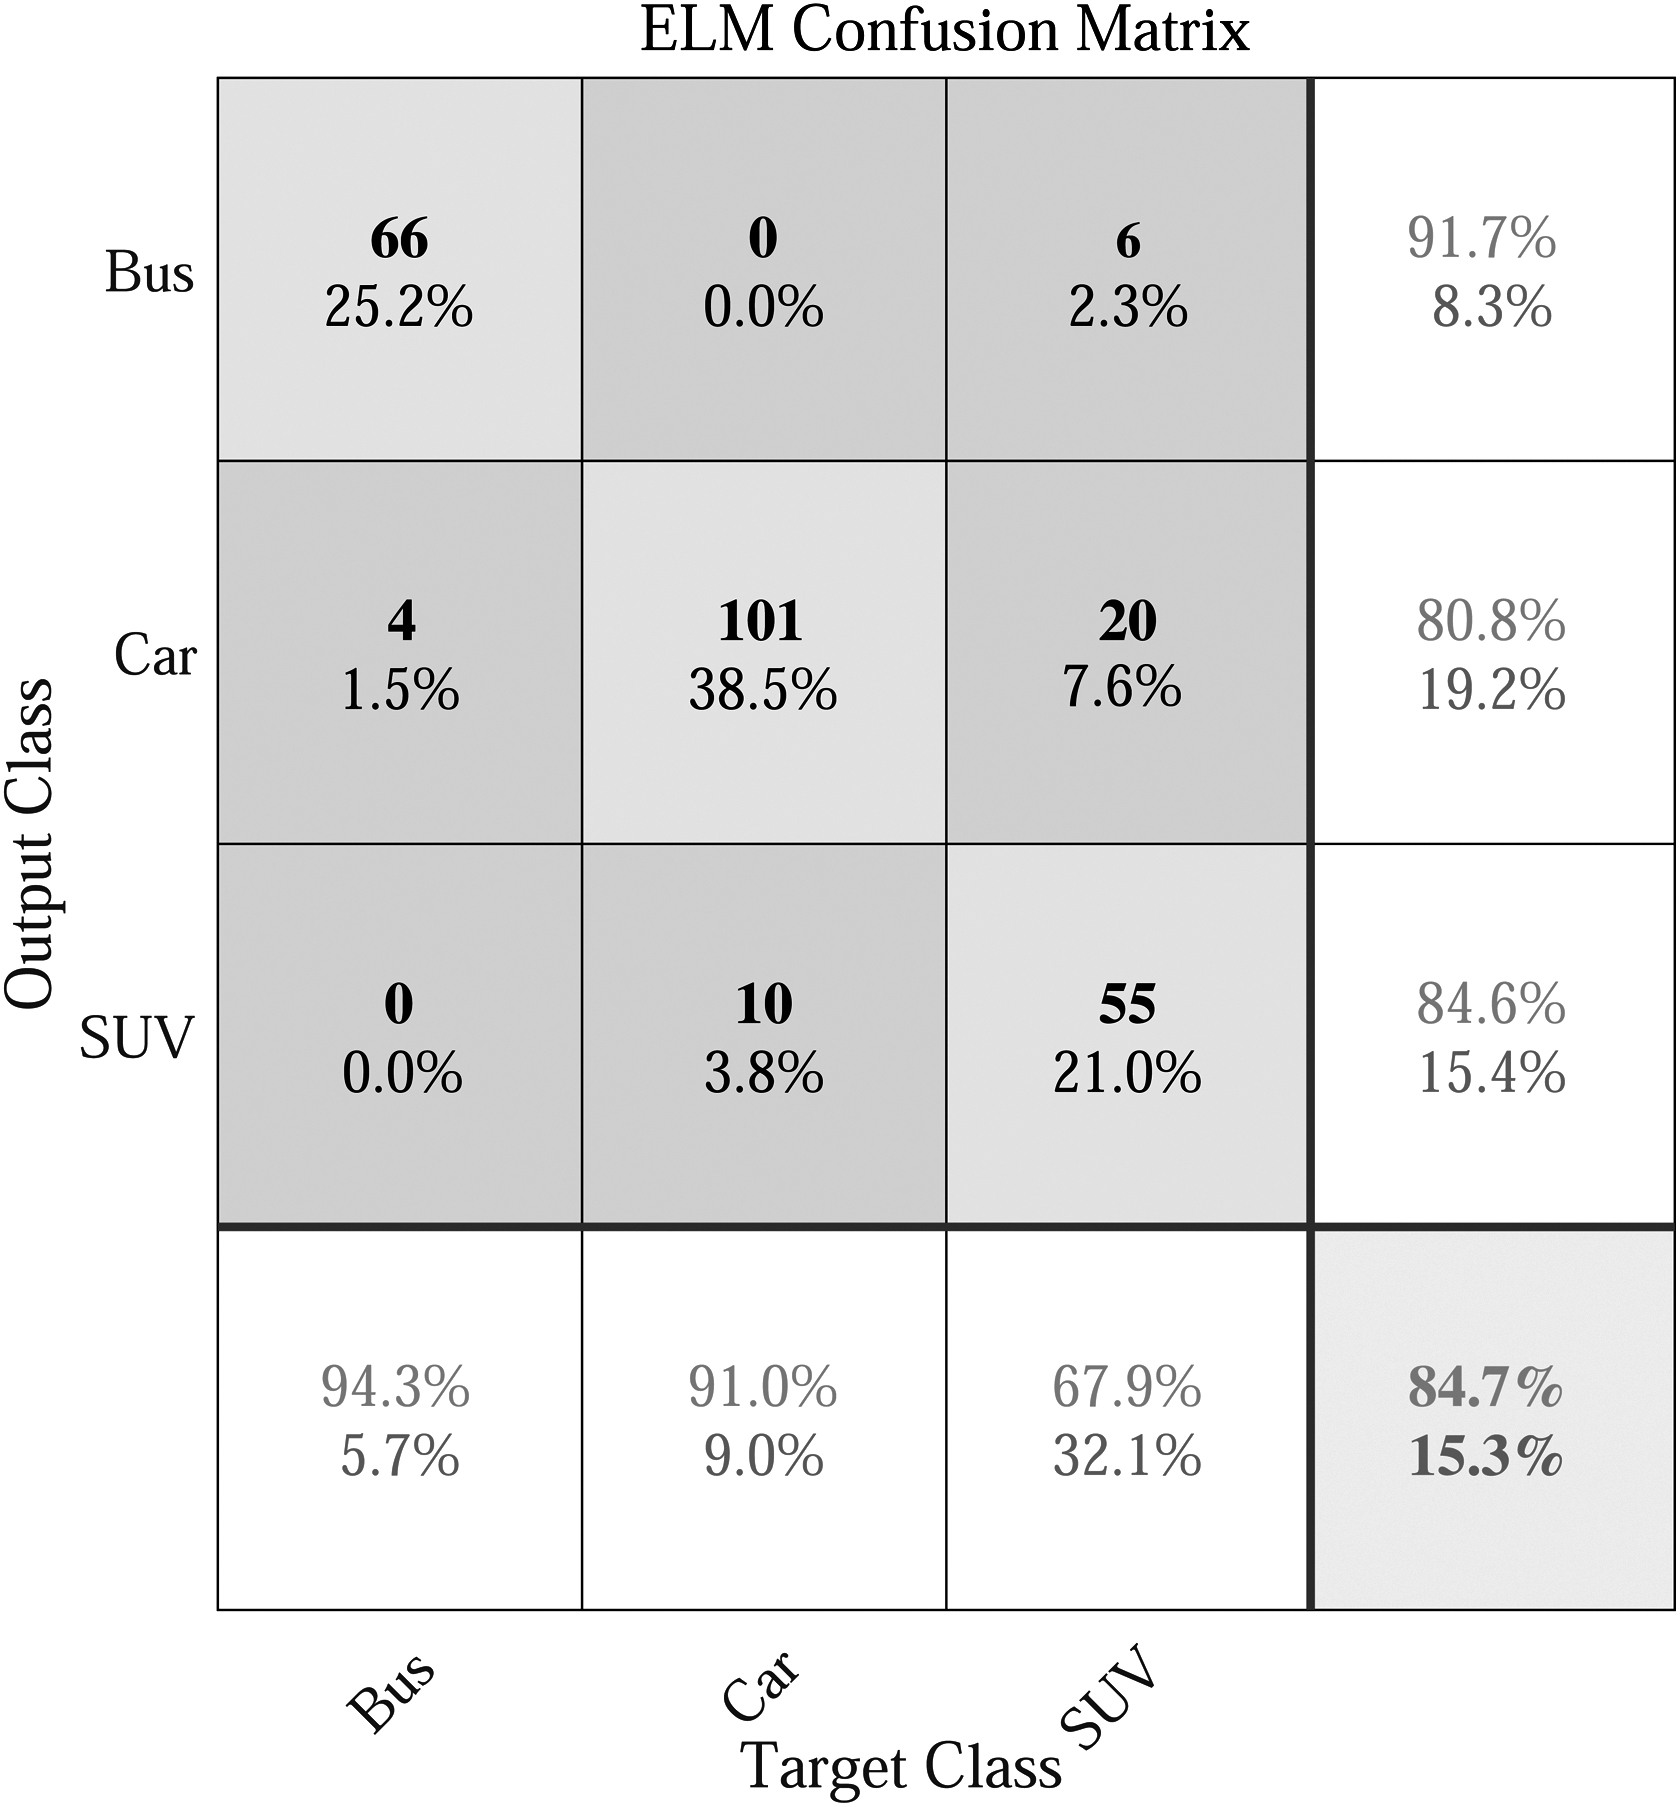
Confusion matrix of ELM classification results.
SSA-ELM classification performance
The result of vehicle classification using SSA-ELM is shown in Figure 8 As expected, the SSA-ELM method is able to achieve more accurate classification between cars and SUVs, when compared with the ELM classification method.
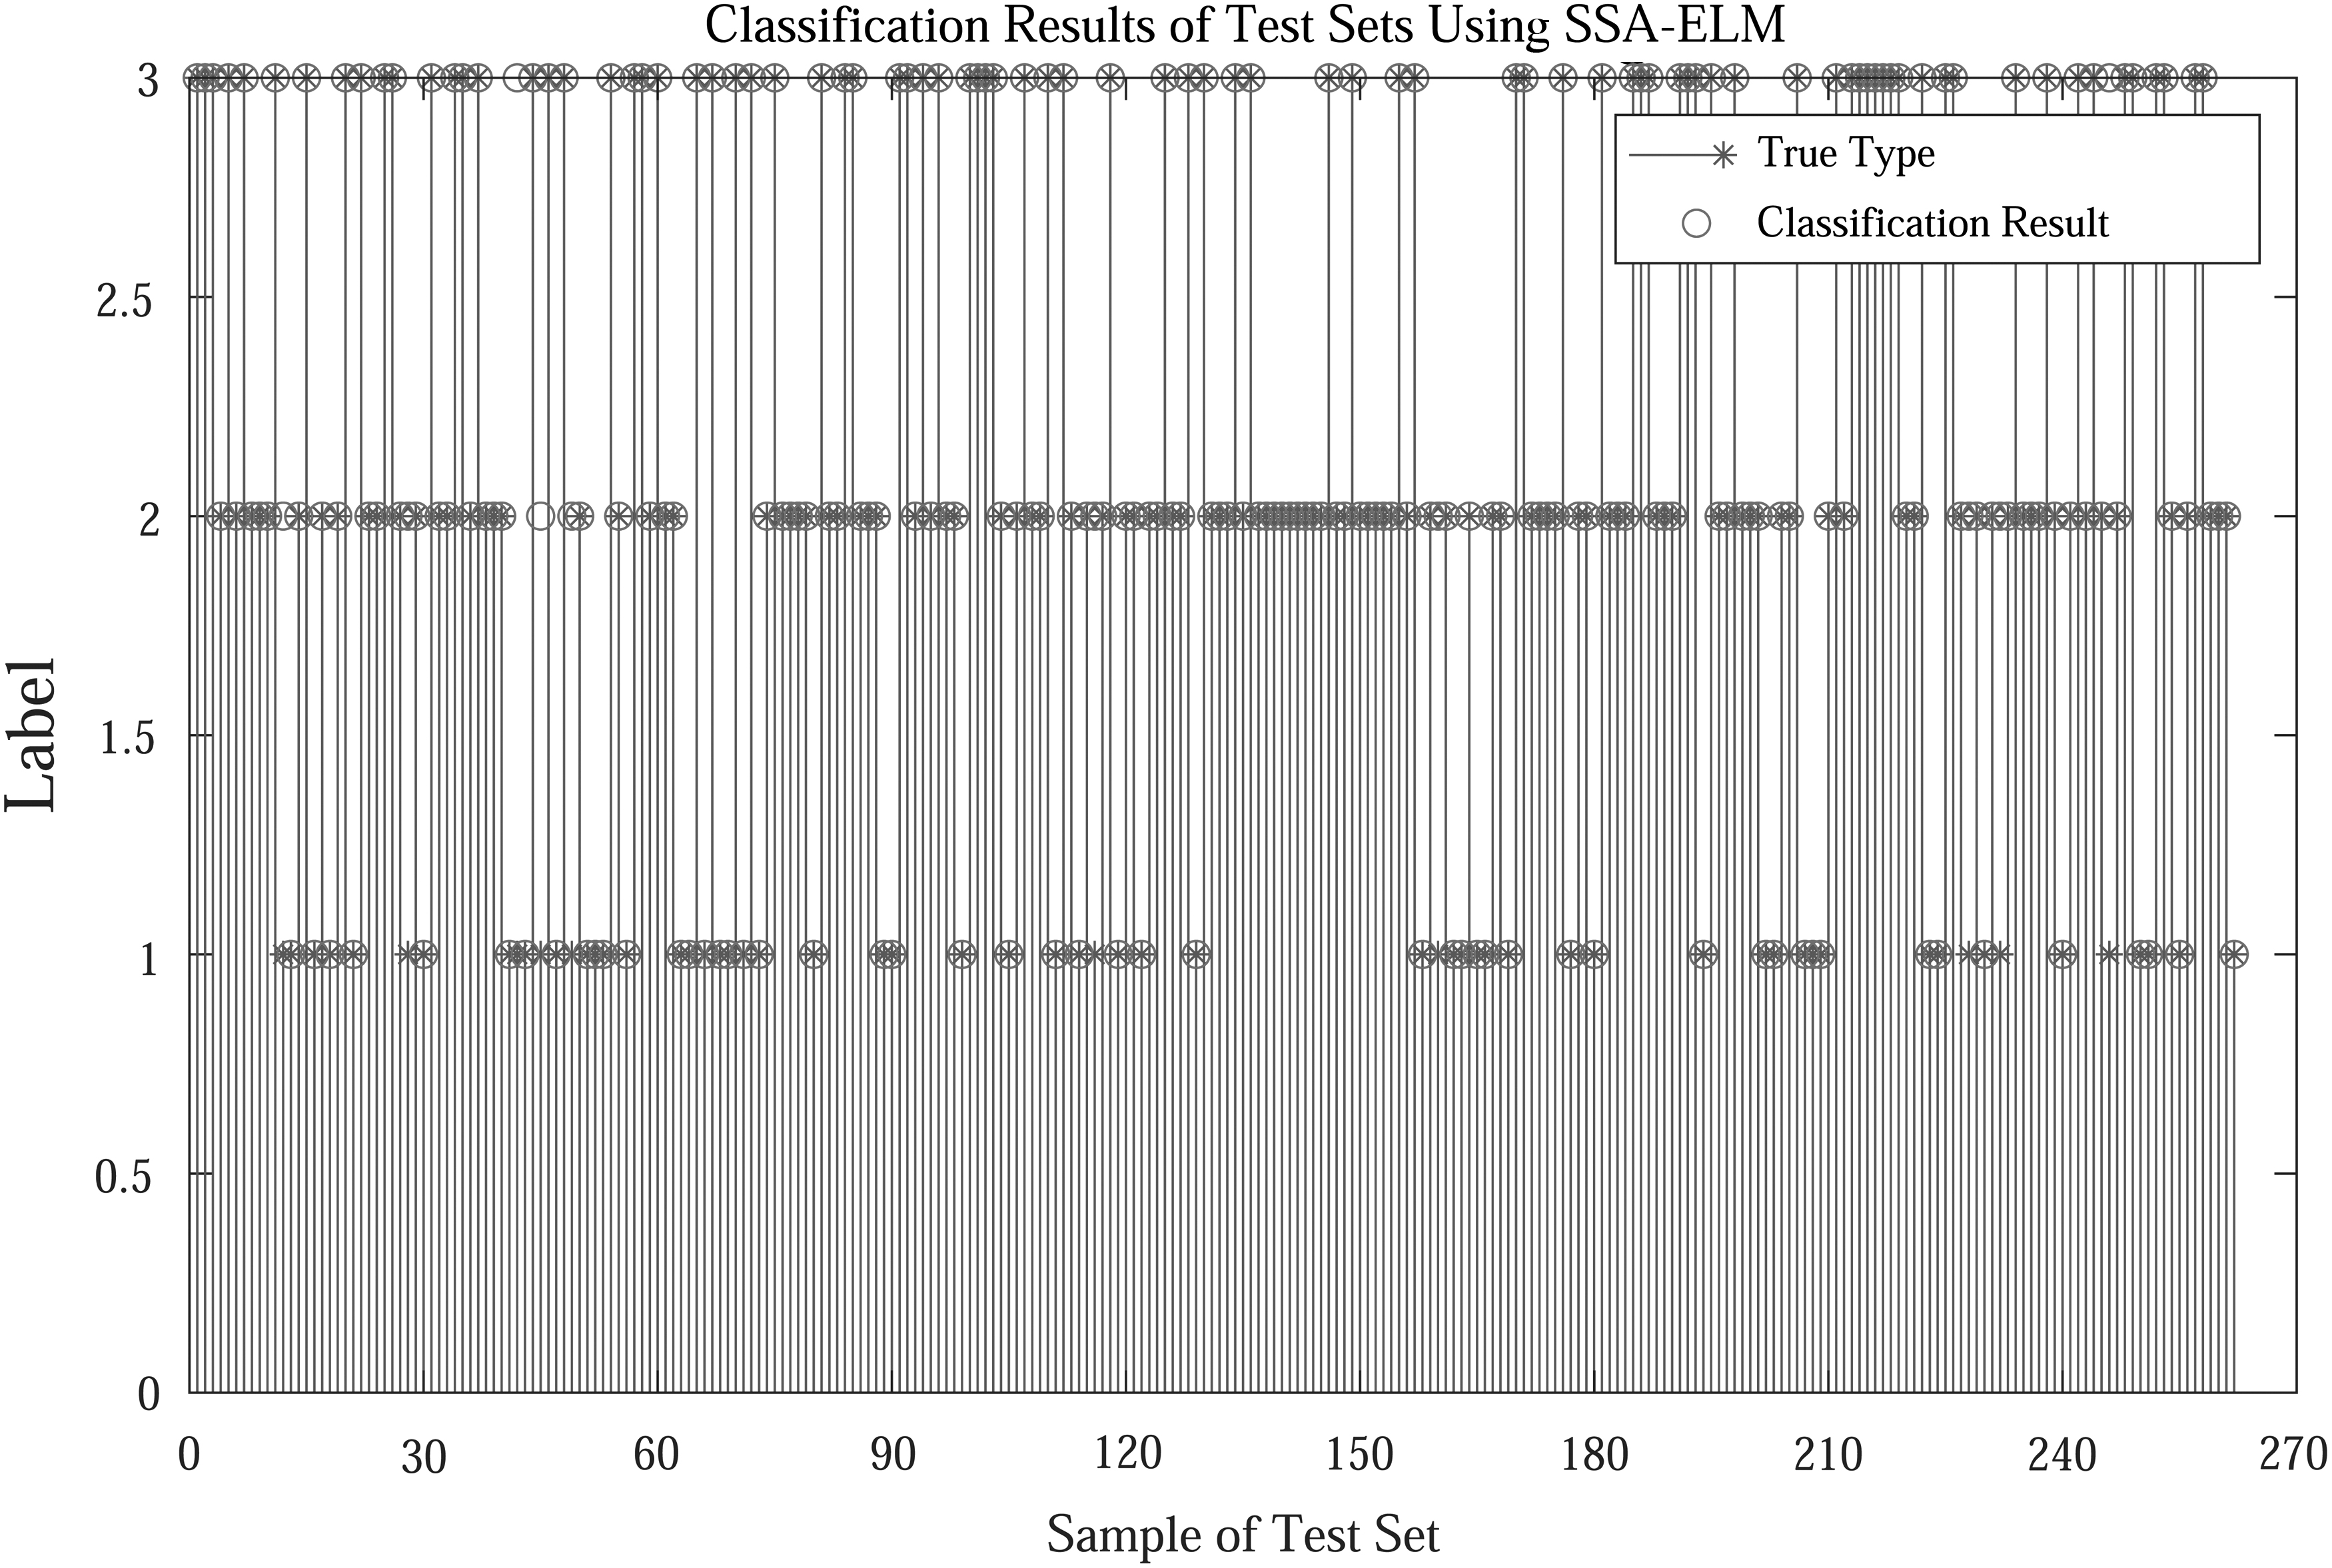
Classification results of SSA-ELM. SSA-ELM, sparrow search algorithm extreme learning machine.
Figure 9 is the confusion matrix for the SSA-ELM classification results. As shown in Figure 9, only eight SUVs were misclassified as cars, and the overall classification accuracy reaches 96.9%. Compared with ELM, the classification accuracy improved by 12%.

Confusion matrix of SSA-ELM classification results. SSA-ELM, sparrow search algorithm extreme learning machine.
Table 2 illustrates the classification accuracy of different algorithms. ACC represents the average classification accuracy of the algorithm.
CNN, convolutional neural network; ELM, extreme learning machine; HHO-ELM, harris hawks optimization extreme learning machine; PSO-ELM, particle swarm optimization extreme learning machine; SSA-ELM, sparrow search algorithm extreme learning machine; WOA-ELM, whale optimization algorithm extreme learning machine.
Figure 10 shows the convergence of four ELM methods. We observe that the convergence speed of WOA-ELM is the fastest, but its error is the highest. The other three algorithms tend to be stable after 25 iterations, and the error of SSA-ELM is the smallest. Considering the aforementioned indexes, the SSA-ELM method proposed in this article exhibits the best classification performance.

Convergence of four methods for optimizing ELM.
Conclusion
This article has proposed a road vehicle classification method based on sparrow search optimization extreme learning machine. First the vehicle length feature, chassis height, and contour feature have been extracted from vehicle data collected by the PCR. Then the three sets of feature vectors have been used as sample data to train the ELM model. Finally, the SSA has been utilized to optimize the initial weight and threshold parameters of the ELM. The experimental results have demonstrated that the proposed SSA-ELM method can achieve 12% higher classification accuracy as compared with the original ELM classification method.
In future study, some new features would be added to solve the problem of poor classification effect caused by the similar chassis profile between the car and SUV analyzed earlier. In addition, the number of particular types of vehicles such as police cars, ambulances, and fire engines will be increased. By effectively classifying the particular types of vehicles on the road, the intelligent transportation system can prioritize dispatching these special vehicles to save time for rescue missions.
Footnotes
Author Disclosure Statement
No competing financial interests exist.
Funding Information
No funding was received for this article.