
Abstract
Over the years, many studies have been carried out to reduce and eliminate the effects of diseases on human health. Gene expression data sets play a critical role in diagnosing and treating diseases. These data sets consist of thousands of genes and a small number of sample sizes. This situation creates the curse of dimensionality and it becomes problematic to analyze such data sets. One of the most effective strategies to solve this problem is feature selection methods. Feature selection is a preprocessing step to improve classification performance by selecting the most relevant and informative features while increasing the accuracy of classification. In this article, we propose a new statistically based filter method for the feature selection approach named Effective Range-based Feature Selection Algorithm (FSAER). As an extension of the previous Effective Range based Gene Selection (ERGS) and Improved Feature Selection based on Effective Range (IFSER) algorithms, our novel method includes the advantages of both methods while taking into account the disjoint area. To illustrate the efficacy of the proposed algorithm, the experiments have been conducted on six benchmark gene expression data sets. The results of the FSAER and the other filter methods have been compared in terms of classification accuracies to demonstrate the effectiveness of the proposed method. For classification methods, support vector machines, naive Bayes classifier, and k-nearest neighbor algorithms have been used.
Introduction
The gene expression data sets obtained by digitizing the microarray image data are in the form of a matrix containing the genes and expression levels. A typical setting is a small number of samples represented by thousands of genes. Dealing with this high-dimensional data set and classifying it directly is a difficult problem.1–3 So, dimensionality reduction plays a very important role since it reduces the number of genes using techniques such as feature selection and feature extraction. These approaches aim to reduce the high-dimensional feature space to low-dimensional representation, which aims for higher classification accuracy. Contrary to feature extraction, feature selection selects the subset of the features from the original set with minimal redundancy and maximum relevance to gain classification accuracy.
The classification of this data set will be disadvantageous in terms of computational time because it is high dimensional. Classification of this data set will be disadvantageous in terms of computational time because it is high dimensional. In addition, noise in gene expression, which is likely to be present in the feature set, adversely affects the performance of the classification. 4 Studies have shown that some genes carry no disease-related information and give misleading results for disease diagnosis.2,5,6 Therefore, the researchers have leaned toward the studies that have been developed using the different feature (gene) selection approaches to determine important genes in DNA microarray data sets. 7
Feature selection methods
Feature selection is defined in the literature in three main topics, namely filter, wrapper, and embedded methods.6,8
Filter methods, which are the methods we focus on in this study, are the statistical methods that are independent of the classifier and evaluate the features individually. In the literature, there have been many different studies related to filter methods, also known as statistical-based methods.7,9
Wrapper methods often use classification accuracy as an indicator when selecting the best subset of genes. These methods require a classification algorithm at each step of the feature selection process. Unlike filter methods, it is in interaction with classification algorithms. Because of working with thousands of gene data, wrapper methods are less preferred than filter methods since they have higher calculation costs.7,10–15
Embedded methods simultaneously perform gene selection and classification while selecting the best subset of genes. There are many embedded method studies used for gene selection in the literature.16–19 In recent years, hybrid methods that combine filter and wrapper methods have been advanced and frequently used as feature selection methods.5,8
When the studies in the literature are reviewed, it is seen that while the high-dimensional data are analyzed, the methods related to the search strategy are difficult to compute. Wrapper and embedded methods can only select an optimal feature subset by requiring a particular classifier. Therefore, when other classifiers are used, the selected features may yield worse results. In addition, these two methods are disadvantageous in terms of computational time compared with the filter methods.20–22 Therefore, in gene data sets with a large number of features, it may be more appropriate to use filter methods to select a feature subset.20–23 For these reasons, our study focuses on a filter-based feature selection, which is a statistical-based method and also constitutes an important part of hybrid methods.
Some of the commonly used filter methods are Fisher-score,7,24 chi-square (χ2), 25 information gain (IG), 26 mutual information, 27 correlation-based feature selection method, 28 and Relief-F.9,29
Related works
A related study proposed a sequential forward search method based on mutual information approach measurement between selected genes and class. 30 Another article used support vectors based on the t statistic for feature selection. 31 Unlike current statistical methods, a statistical method has been proposed in a study, an Effective Range based Gene Selection (ERGS), which defines an effective range of features for each class. 32 The basic principle of this effective feature selection approach is that more weight is given to features that clearly distinguish classes. A study used the BW ratio (between-class to within-class sums of squares) method based on Fisher's linear discriminant analysis in different gene expression data sets to perform the feature selection. 33
In a different article, also, an approach has been suggested, namely 34 “Improved Feature Selection based on Effective Range (IFSER)” by developing a lacking part of the algorithm called “Effective Range based Gene Selection (ERGS).” Another work on the issue proposed a novel filter feature selection method based on the maximal information coefficient (MIC) and Gram–Schmidt orthogonalization, named Orthogonal MIC Feature Selection. 35 Lastly, a study proposed an effective feature selection method, combining double Radial Basis Function kernels with weighted analysis, to extract feature genes from gene expression data, by exploring its nonlinear mapping ability. 36
One of the aforementioned studies 32 proposed a filter method by calculating effective ranges based on Chebyshev inequality for each feature, based on the overlap values of these effective ranges. While ERGS only considers overlapping area (OA), IFSER takes into account the case where a range of a class covers the range of another class (including area [IA]).
Our contributions
Our original contributions through this article are as follows:
The major deficiency of the ERGS and IFSER algorithms based on effective ranges is that they assign the same weight value to all of the disjoint ranges. We proposed a new feature selection approach named “Feature Selection Algorithm based on Effective Ranges” (FSAER), which distinguishes the disjoint effective ranges. FSAER has the advantages of ERGS and IFSER and it further defines a new total area that is needed for handling the disjoint areas. For gene expression data sets, there are thousands of genes, so some of them will include the disjoint area. Therefore, FSAER outperforms the original ERGS and IFSER, and some of the other current filter methods.
The rest of this article is composed as follows. A brief overview of filter methods is summarized in the Filter Methods: A Brief Overview section. The proposed feature selection algorithm is introduced in detail in the Proposed Feature Selection Algorithm section. Classification methods used for analysis are described in the Classification Methods Used for Analysis section. The Experiment and Results section reports experimental results on six well-known gene expression data sets and provides a comparative evaluation of the proposed algorithm. Finally, conclusions are provided in the Conclusions section.
Filter Methods: A Brief Overview
In the scope of this study, to show the effectiveness of the proposed algorithm, five different filter methods have been used for comparison. These commonly used five filter methods in the literature are χ2 statistic, 25 Relief-F,9,29 IG, 26 ERGS, 32 and IFSER. 34 The brief descriptions of these five filter algorithms are given as follows.
χ2 statistic
The χ2 filter method is based on χ2 statistics. The value of the χ2 statistic is computed for each feature individually. Each feature with numerical values must be discretized before computing χ2 statistics. For each i-th feature, the χ2 statistic is defined as follows.
32
where
where
In statistical analysis, the Cramer-Phi coefficient is used as a measure of association for nominal variables. It is possible to use this measure as a filter for feature selection. This coefficient is defined as follows:
As seen from Equation (3), this measure is obtained depending on the definition of
The features are selected based on the ranked values of the Cramer-Phi coefficient calculated with the χ2 statistic for each feature. A higher weight is given to the features where this coefficient is bigger.
Relief-F
Relief algorithm is a feature selection algorithm that is proposed for binary class problems. 37 While this algorithm can deal with discrete and continuous features, it cannot deal with incomplete data. Relief-F has been proposed as an extension of the original Relief algorithm to deal with noisy, incomplete, and multiclass data sets. 32 The basic logic of the Relief-F algorithm is to proportion features according to how well they can distinguish between the samples of different classes and how well they can cluster samples of the same class. 38
In this method, a relevance weight is assigned to each feature. Randomly, an “r” sample is selected from the “n” sample. The relevance values are updated depending on the difference between the nearest samples of the same (H) (nearest hit) and different classes M(C) (nearest miss of class C) with the selected samples (r). The features that discriminate the sample from the neighbors of different classes are given more weight. The weights are updated taking into account the average contribution of the nearest misses M(C). The average contribution also takes into account the prior probability of each class P(C). The update rule Xi, the weight of the i-th feature, is given in the following equation.
32
where
Information gain
IG is often used as a criterion for selecting features in decision trees. 26 A study used this method also as a criterion for gene selection. 25 IG is a measure based on entropy. Entropy is used to measure uncertainty in a variable. When all values of the variable are equal, there is no uncertainty and the entropy value is 0, but the entropy reaches its maximum value if the values of the variable are not equally distributed. 39 The IG value is often used as a filter for ordering genes when gene selection is made. The fact that a gene has a high IG value means that the gene provides more information.
For example, there is a data set with
If a
As a result, the IG value for a gene
Both IG and χ2 statistic methods have high performance in distinguishing the features. 38
Effective Range based Gene Selection
One of the studies, which offers a starting point for this article, proposed a filter method by calculating effective ranges based on Chebyshev inequality for each feature, based on the overlap values of these effective ranges. 32 ERGS works under the principle that a feature should be given more weight if decision boundaries among classes are very far away from each other, that is, classes can easily be distinguished. The decision boundaries of the classes are obtained by a statistically defined effective range. 32
Calculating effective ranges (
)
Assume, for a data set that has d features, the set of features is shown as
where pj is the prior probability of the j-th class and
It is taken as
The ERGS algorithm calculates the overlap value of the ranges given in Equation (10) for each feature. There should be little overlap between classes in highly distinguished features.
ERGS algorithm
The steps of the ERGS algorithm, for the i-th feature Xi, can be given as follows:
Calculate effective ranges (
Sort the effective ranges based on lower bounds (
Compute
where
4. Compute area coefficient (
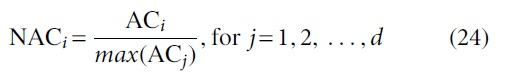
5. Compute normalized area coefficient (
6. Compute weight (wi)
7. Select the feature that provides
Some features range from 0 to 10, while others can range from 0 to 10,000. This means that for features with a higher data range, the OA can be greater. To override this effect, the OA is divided by the data range of the feature.
An example for illustration of ERGS algorithm
Mixed-lineage leukemia (MLL), a benchmark gene data set, contains 72 samples of 12,562 genes. 40 These samples consist of three types: acute lymphoblastic leukemia (ALL), MLL, and acute myeloid leukemia (AML). 32
In the ERGS algorithm, more weight is assigned to a gene if it has less OA. Using the ERGS algorithm, the weight for the gene with Gene Accession No. “32864_at” is computed as 0.90, which shows high weightage for this gene. This justifies the fact that there is no OA between AML and ALL types of leukemia for gene “32864_at,” as shown in Figure 1. It means that gene “32864_at” cannot have any ambiguity to classify AML and ALL types of leukemia. Therefore, it is shown in the example that the ERGS algorithm gives more weight to those features that are helpful for classifying the data accurately, that is, the feature should not lead to any ambiguity in the classification process. The features with higher weights also clearly describe the decision boundary in the classification process. 32
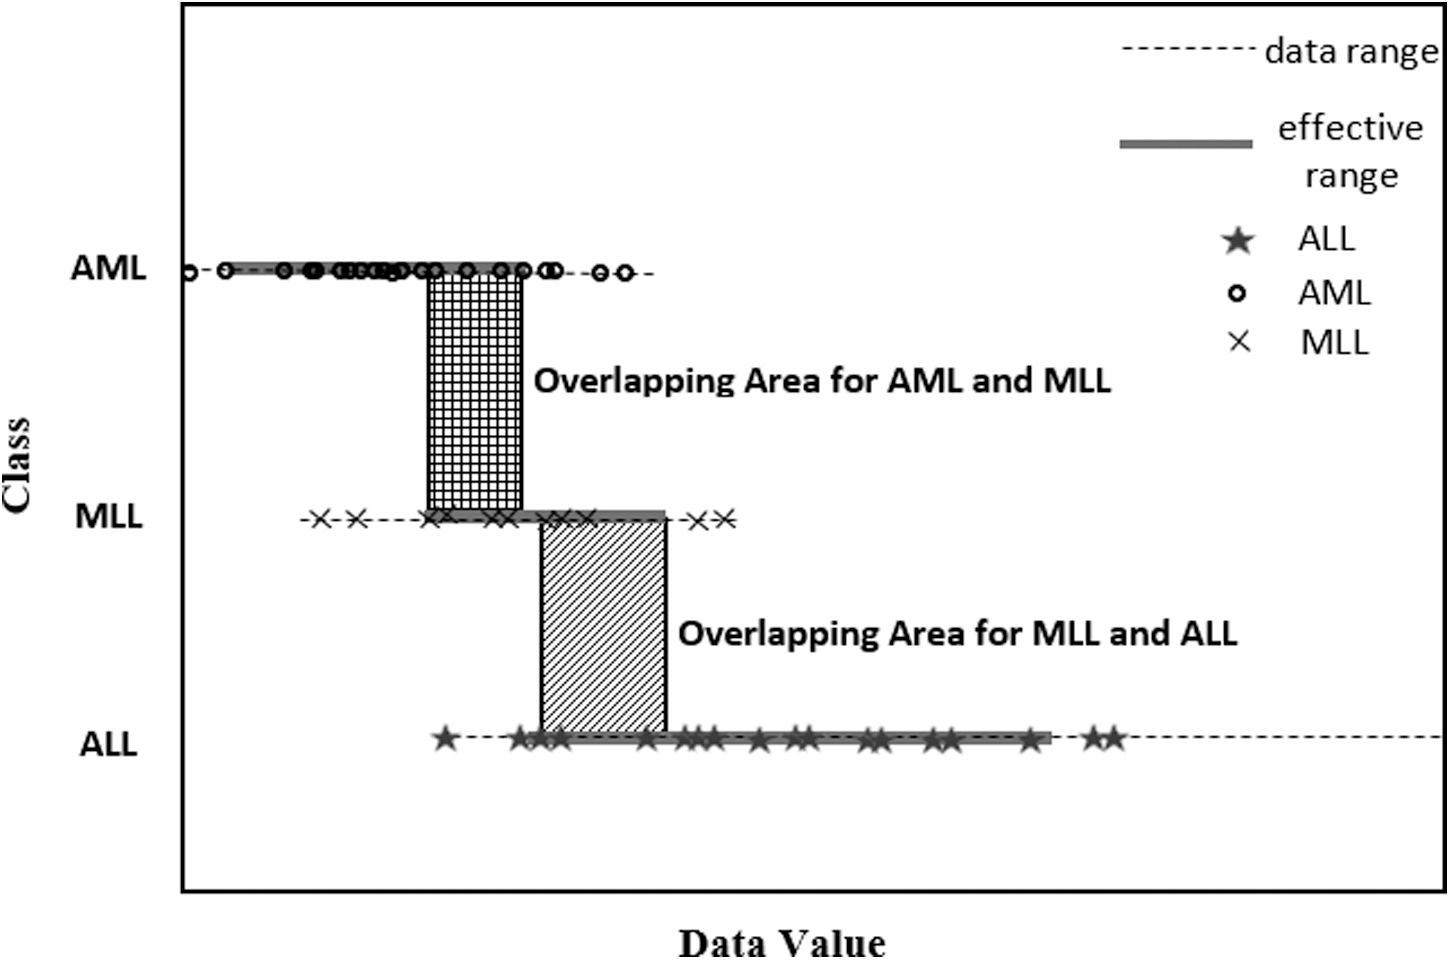
Data plot of MLL data set: Gene Accession No. 32684_at. 32 ALL, acute lymphoblastic leukemia; AML, acute myeloid leukemia; MLL, mixed-lineage leukemia.
Improved Feature Selection based on Effective Range
Wang et al. 34 have developed the ERGS algorithm to take into account the case where a range of a class covers the range of another class (IA). The steps of the IFSER algorithm, for the i-th feature Xi, can be given as follows.
Calculate effective ranges (
Sort the effective ranges based on lower bounds (
Compute
where
4. Compute
where
5. Compute
6. Compute
7. Compute the normalized Ni and Hi
where
8. Compute weight (wi)
9. Select the feature that provides
Proposed Feature Selection Algorithm
Motivation
The major deficiency of the ERGS and IFSER algorithms based on effective ranges is that they assign the same weight value to all of the disjoint ranges (Fig. 2c). The ERGS algorithm selects the feature by considering only the OAs defined in Figure 2a. The algorithm uses the same weight value for all of the ranges that correspond to Figure 2c, while partly taking into account the condition given in Figure 2b.
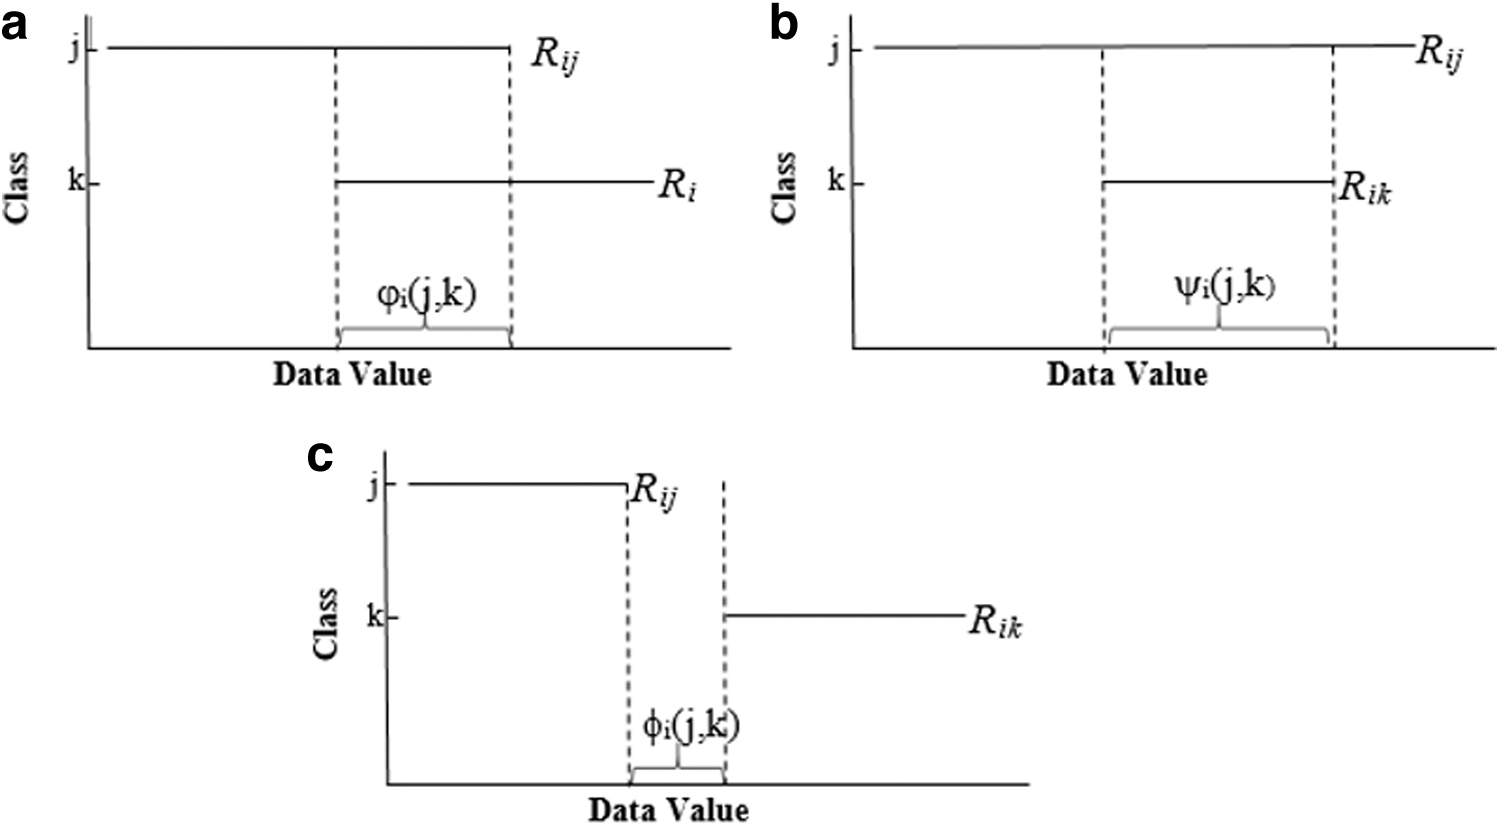
Situations of effective ranges relative to each other
The IFSER algorithm has made improvements in the ERGS algorithm, taking into account the state of Figure 2b, but this algorithm does not distinguish between the corresponding ranges in the case given in Figure 2c, just similar to ERGS.
Consider the Golub data to explain this situation through an example. Golub data is a data set consisting of 2 classes and 3051 features with 38 samples. 41 After calculating the effective ranges in this data set, the number of (a) overlap, (b) including, (c) disjoint situations given in Figure 2 is summarized in Table 1.
Number of (a) overlap, (b) including, (c) disjoint situations for Golub data set
As seen in Table 1,
As the Golub example shows, a data set may have many disjoint areas. Considering only Figure 2a and b when calculating the OA will assign 0 weights to all features in the disjoint area, causing us to ignore the better separation case in Figure 2c.
It would be wrong to say that all 187 features given in Table 1 have the same power in separating classes. The larger the disjoint area, the greater the weight of that feature should be.
In this study, we propose a new feature selection algorithm that distinguishes the disjoint effective ranges indicated by
Algorithm
The steps of the algorithm, for the i-th feature Xi, can be given as follows and finally can be summarized as in the form of a flowchart in Figure 3 and Algorithm 1.
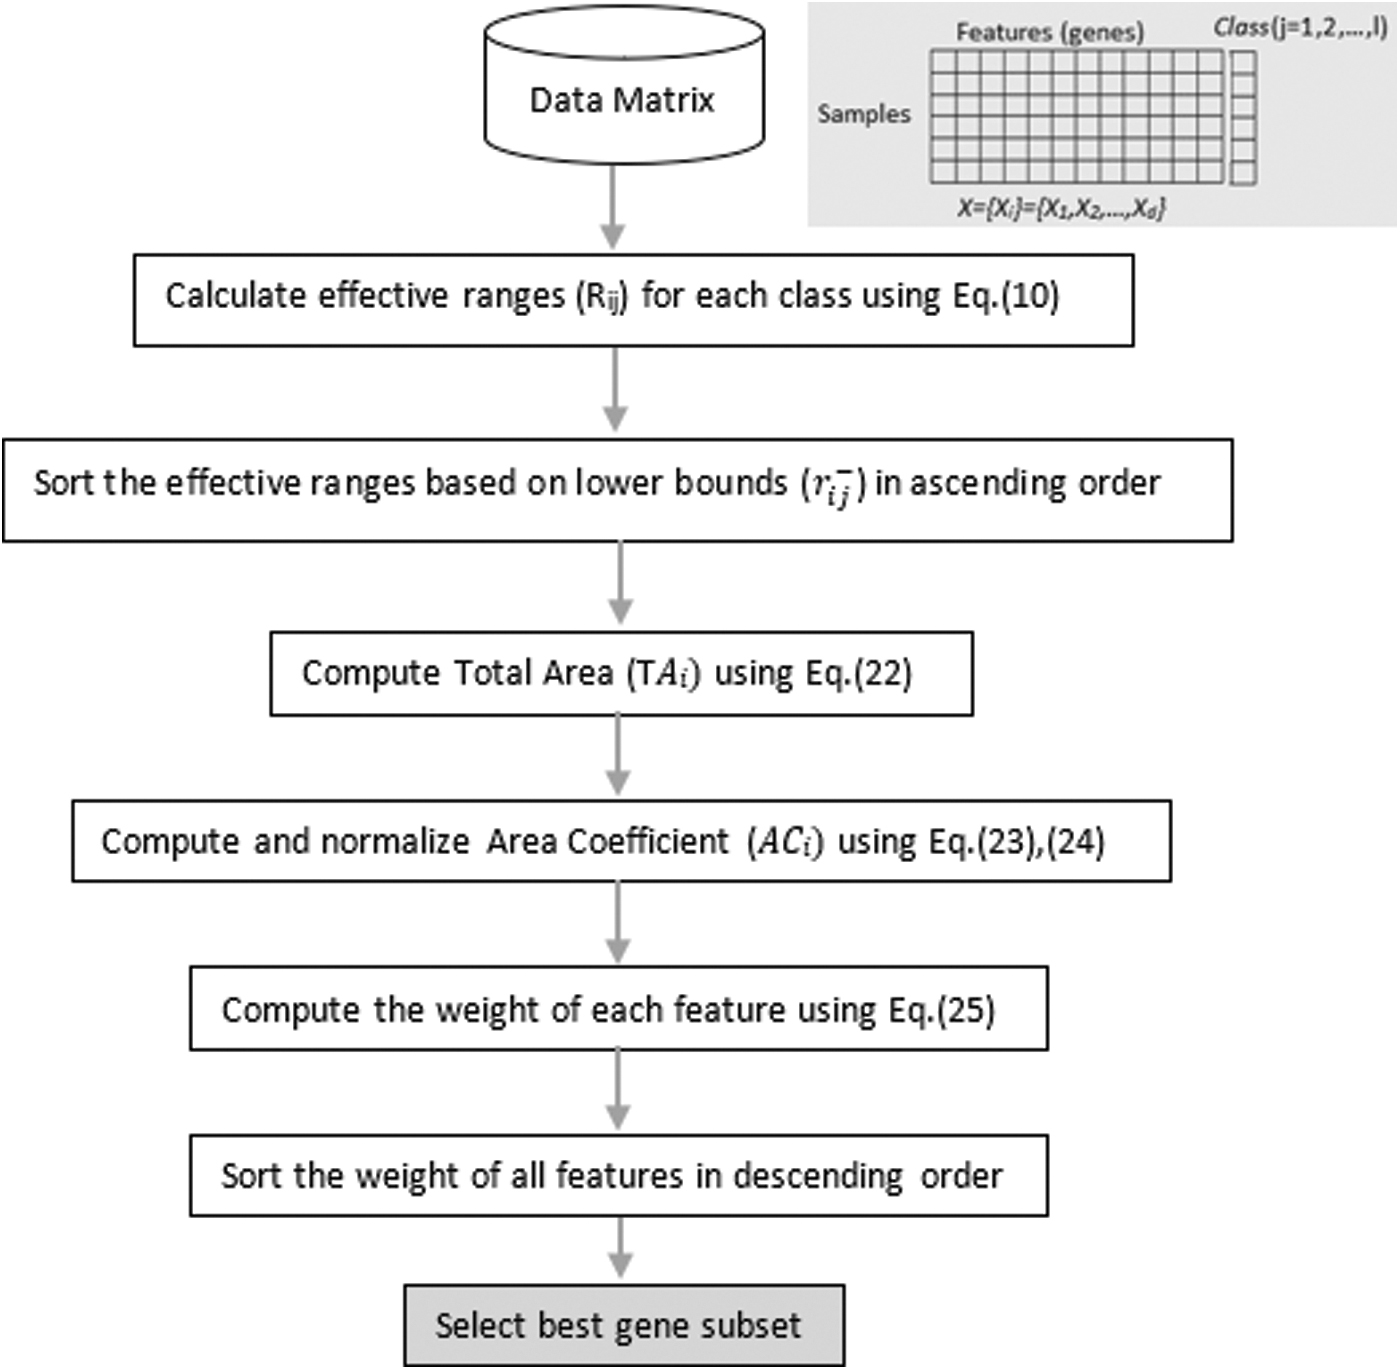
Flowchart of the FSAER. FSAER, Effective Range-based Feature Selection Algorithm.
Calculate effective ranges (
Sort the effective ranges based on lower bounds (
Compute total area (
where
4. Compute
5. Compute
6. Compute weight (wi)
7. Select the feature that provides
Classification Methods Used for Analysis
In this study, the results obtained for the proposed methods and other methods were compared in terms of classification accuracy using support vector machine (SVM), naive-Bayes classifier (NBC), and K-nearest neighbor (KNN) algorithm. A description of these methods is given below.
Support vector machine
SVM is a supervised learning algorithm, at basic, used to distinguish the data of different classes from each other using line, plane, or hyperplanes (i.e., decision bounds).42, 43 To create an optimal hyperplane, an iterative training algorithm is used to minimize the error function
Subject to the constraints:
where b is a constant, w denotes the coefficients' vector, and
Naive-Bayes classifier
The NBC is a classifier based on Bayes theorem, working according to probability principles, assuming independence. A study has found that this assumption is less effective than thought. 44
The probability of Bayes is the generalized version of the conditional probability for k discrete events. This probability can be defined as follows.45,46
where
K-nearest neighbors
KNN algorithm, which is used in cases where the independent variables are numerical (as in the case of gene data), performs classification according to the distances between the observations. The steps of the method can be summarized as follows.37,47
Step 1. Determine the k value (number of neighbors)
Step 2. Calculate distances between observations
Step 3. Sort observations in ascending order by distance
Step 4. Assign to class the most repeated in k-observation, which has the smallest distance
Experiment and Results
In this section, the performance of the proposed feature selection algorithm (FSAER) has been evaluated using six different well-known gene expression data sets, namely Leukemia_G, 41 Leukemia_Z, 48 Colon, 49 Leukemia_C, 50 Prostate, 51 and Small Round Blue Cell Tumors (SRBCT). 52 To show the effectiveness of the proposed algorithm, five different filter methods also have been applied to these six data sets. These are χ2 statistic, Relief-F, IG, ERGS, and IFSER.
SVM, NBC, and KNN algorithms have been used as the classification methods for the measurement performance of selected features (using filter methods).
The classification accuracies obtained by applying leave-one-out cross-validation (LOOCV) are presented in detail in Tables 3–5.
Algorithms, ERGS, IFSER, and FSAER, have been implemented in R language. Biocomb package in R has been used for χ2, Relief-F, and IG algorithms and Caret package in R has been used to obtain classification accuracies.
Data set description
Leukemia_G (ALL-AML)
Leukemia_G data set contains information of 72 patients, 47 of them are ALL and 25 of them are AML (Table 2). Bone marrow samples were obtained from each of the 72 patients at the time of diagnosis. This data set consists of 2 classes for 7129 gene expression profiles from 72 samples.
Characteristics and accessible sources of data sets
SRBCT, Small Round Blue Cell Tumors.
Leukemia_Z (ALL-AML_3)
Leukemia_Z consists of a total of 72 patients, including gene expression data set, 25 AML, 38 B cell ALL, and 9 T cell ALL. This data set consists of 3 classes for 7129 gene expression profiles from 72 samples.
Colon
Colon gene expression data set contains colon epithelial cell samples from 62 different colon cancer patients. Samples include normal biopsies collected from healthy portions of the same patient's colon and tumor biopsies collected from tumors. In this data set, which has 2 classes as tumor and healthy, there is 2000 gene information belonging to 62 patients.
Leukemia_C (ALL)
Leukemia_C gene expression data set contains information of 111 patients with T cell and B cell ALL. This data set has 111 samples and 2 classes and contains 12,625 gene information.
Prostate
Prostate gene expression data set consisted of 102 radical prostatectomy types, which were reported to be high quality, including 52 tumor prostate samples and 50 normal prostate samples. This data set has 102 samples and 2 classes and has 12,600 gene information.
Small Round Blue Cell Tumors
SRBCT gene expression data set has been derived from childhood cancer studies. In this data set, there are 29 samples with Ewing sarcoma, 11 with Burkitt's lymphoma, 18 with neuroblastoma, and 25 with rhabdomyosarcoma. In total, this data set consists of 4 classes for 2308 gene information from 83 samples.
The obtained results
The results obtained using the R language from the aforementioned methods are presented in Tables 3–5. In addition, Figures 4–6 display the classification results of six different methods in heatmap form.
Leave-one-out cross-validation classification accuracies (%) with naive Bayes classifier of six different data sets for different feature selection methods using 10–100 selected features
ERGS, Effective Range based Gene Selection; FSAER, Effective Range-based Feature Selection Algorithm; IFSER, Improved Feature Selection based on Effective Range; IG, information gain; NBC, naive Bayes classifier.
Leave-one-out cross-validation classification accuracies (%) with support vector machines of six different data sets for different feature selection methods using 10–100 selected features
SVM, support vector machine.
Leave-one-out cross-validation classification accuracies (%) with k-nearest neighbor of six different data sets for different feature selection methods using 10–100 selected features
KNN, k-nearest neighbor.
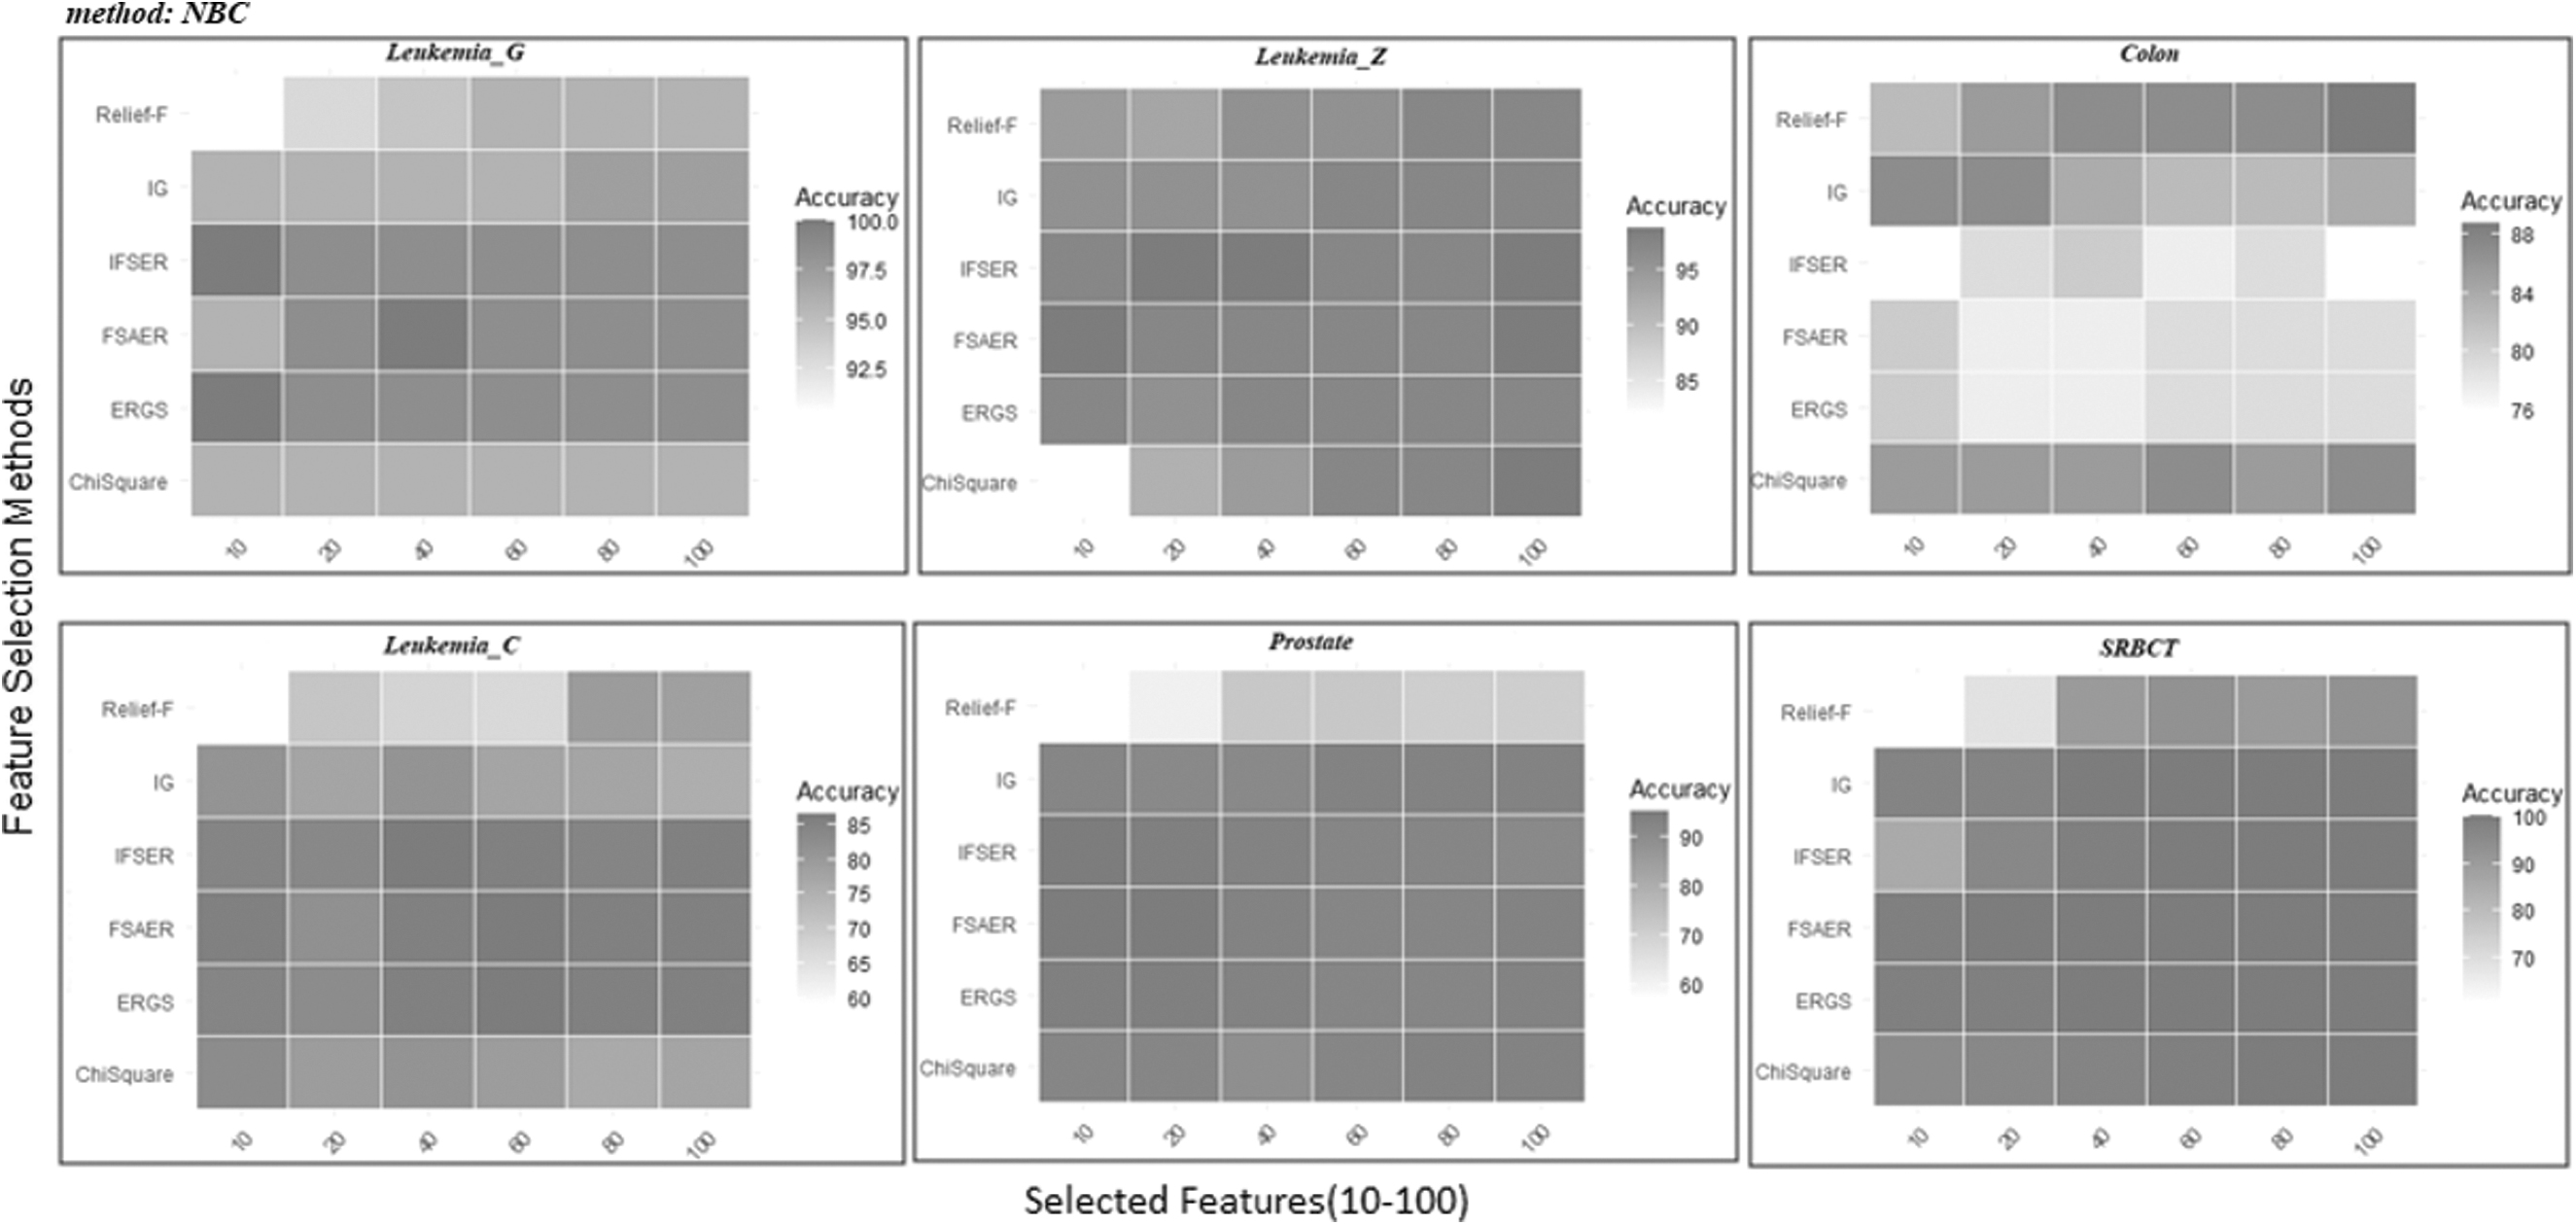
Heatmap for LOOCV classification accuracies (%) with NBC of six different data sets for different feature selection methods using 10–100 selected features. LOOCV, leave-one-out cross-validation; NBC, naive Bayes classifier.
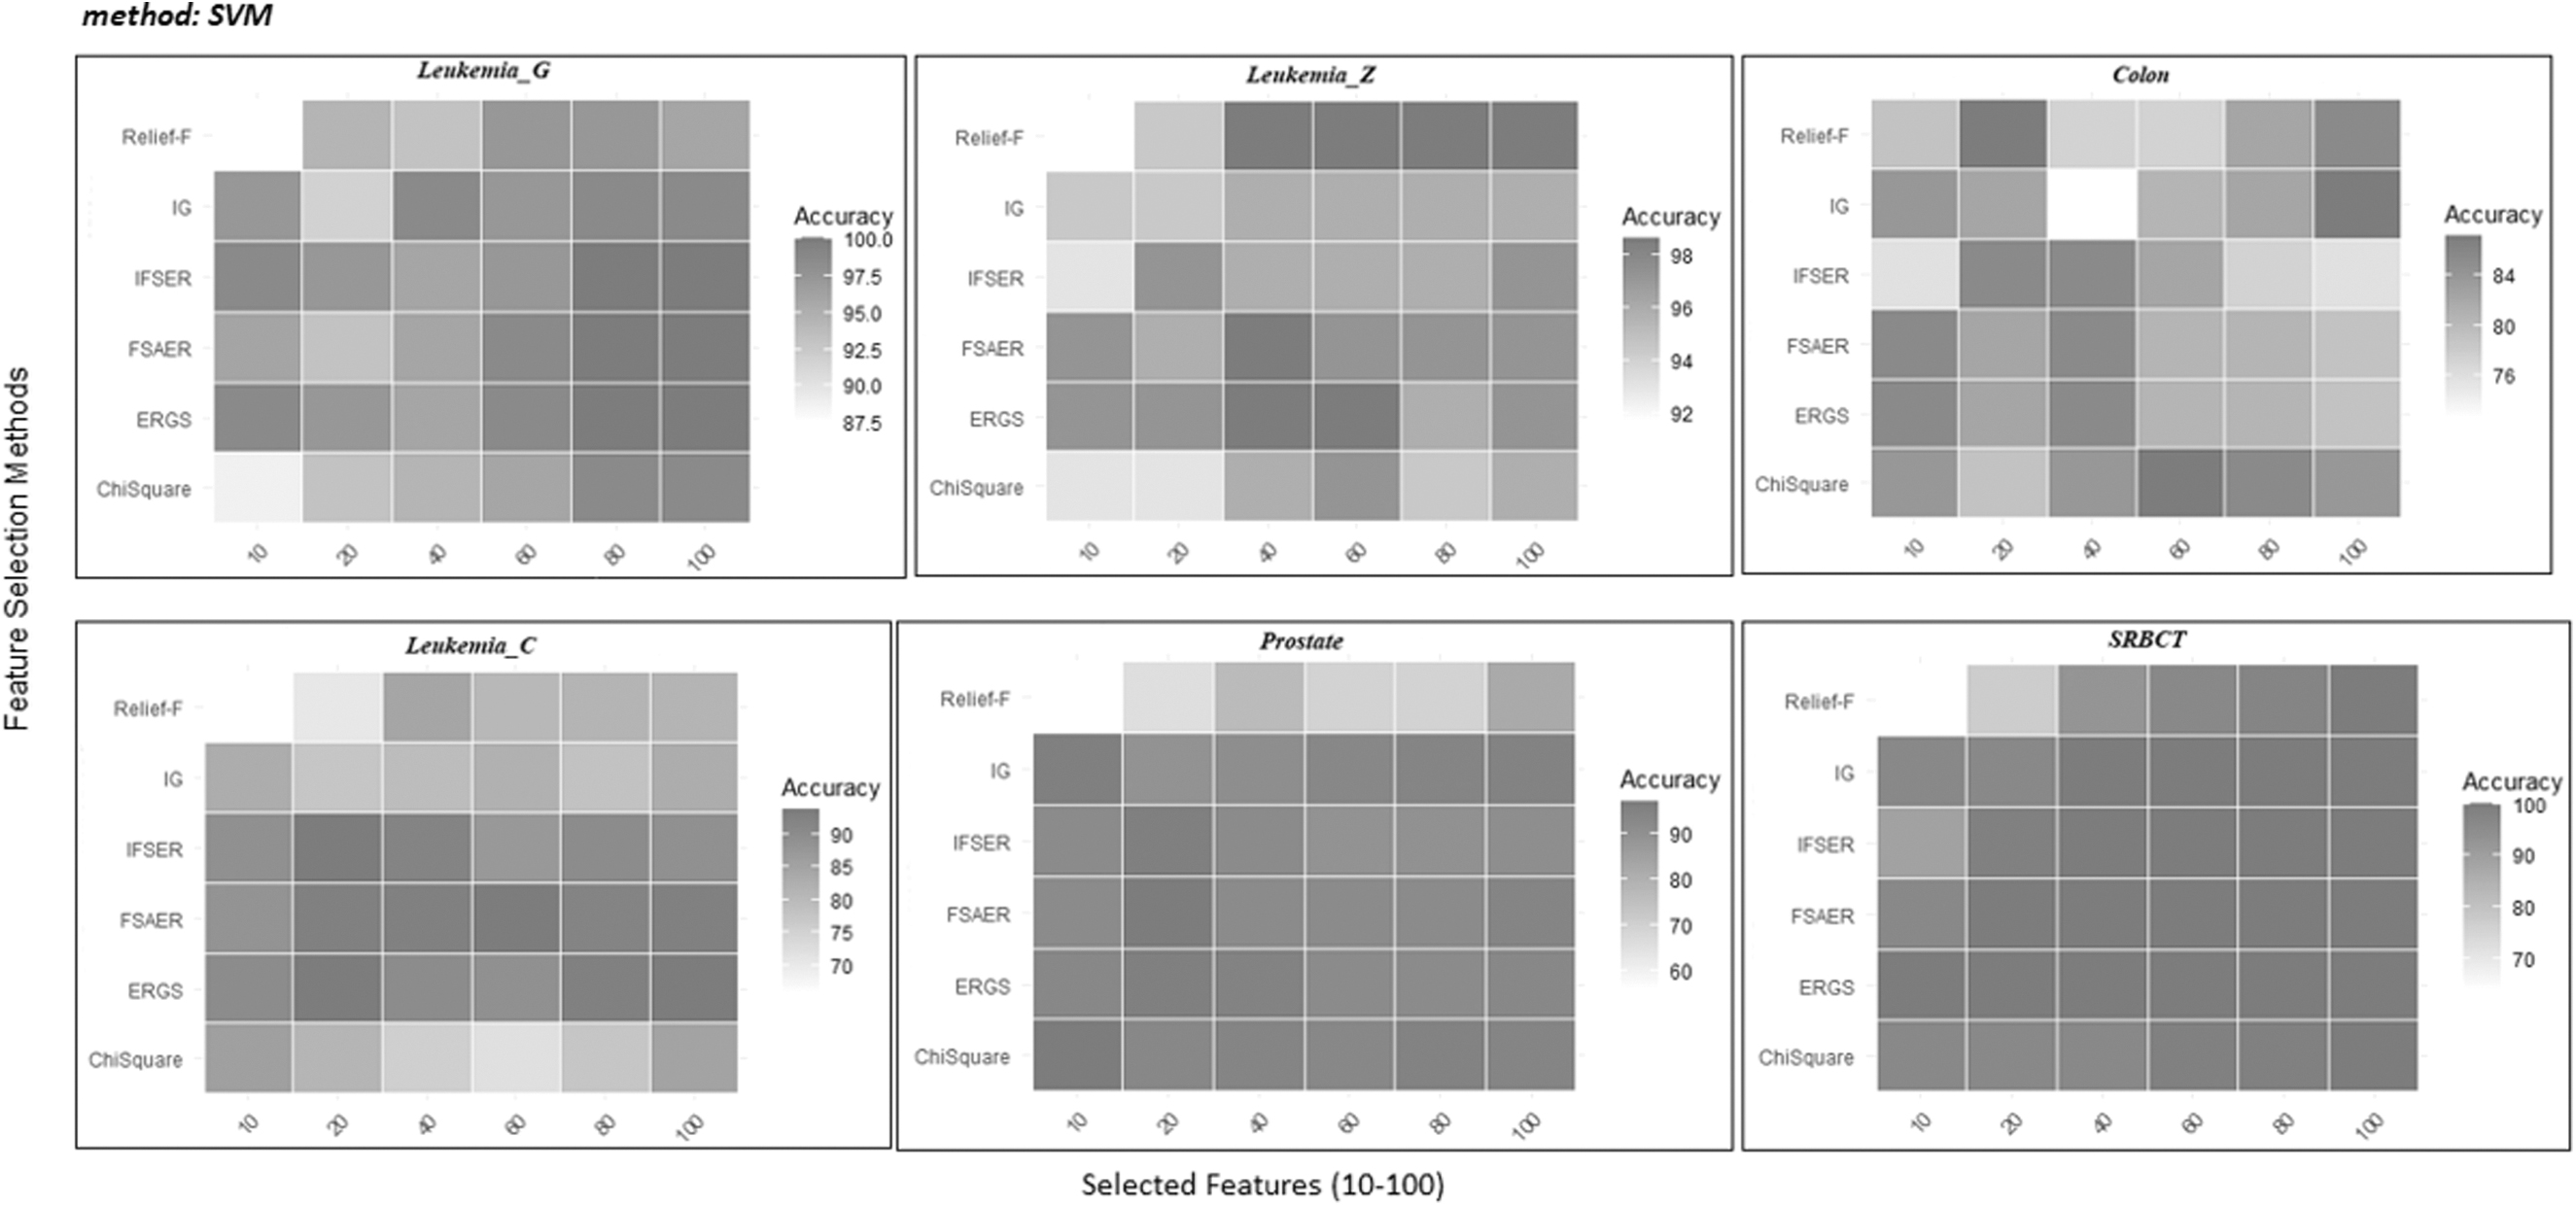
Heatmap for LOOCV classification accuracies (%) with SVM of six different data sets for different feature selection methods using 10–100 selected features. SVM, support vector machines.

Heatmap for LOOCV classification accuracies (%) with KNN of six different data sets for different feature selection methods using 10–100 selected features.
Comparative evaluation
To investigate the efficiency of the FSAER algorithm, the classification accuracy of the selected features using this algorithm has been compared with the accuracies obtained from other feature selection algorithms. For a better comparison, LOOCV has been used to calculate the classification accuracy.
On six different data sets, the classification accuracy was obtained from χ2 Statistics, Relief-F, IG, ERGS, IFSER, and FSAER methods for different numbers of selected gene subsets (between 10 and 100) and has been presented in Tables 3–5.
In addition, we could access gene accession numbers and gene descriptions of the selected genes. For Leukemia_G data, the top 10 selected genes by FSAER algorithm has are shown in Table 6. These results are commensurate with the clinically proven results.
The top 10 selected genes using Feature Selection Algorithm based on Effective Range for Leukemia_G data
Experimental results using NBC
Table 3 shows the classification accuracy of the different size feature subsets (10–100) obtained from the feature selection methods for six different gene expression data sets as a result of using the NBC.
When Table 3 and Figure 7 are taken into consideration, it is seen that the FSAER method has the highest accuracy rates for most of the data sets. To evaluate the results in detail, we examined the data sets in this table separately.
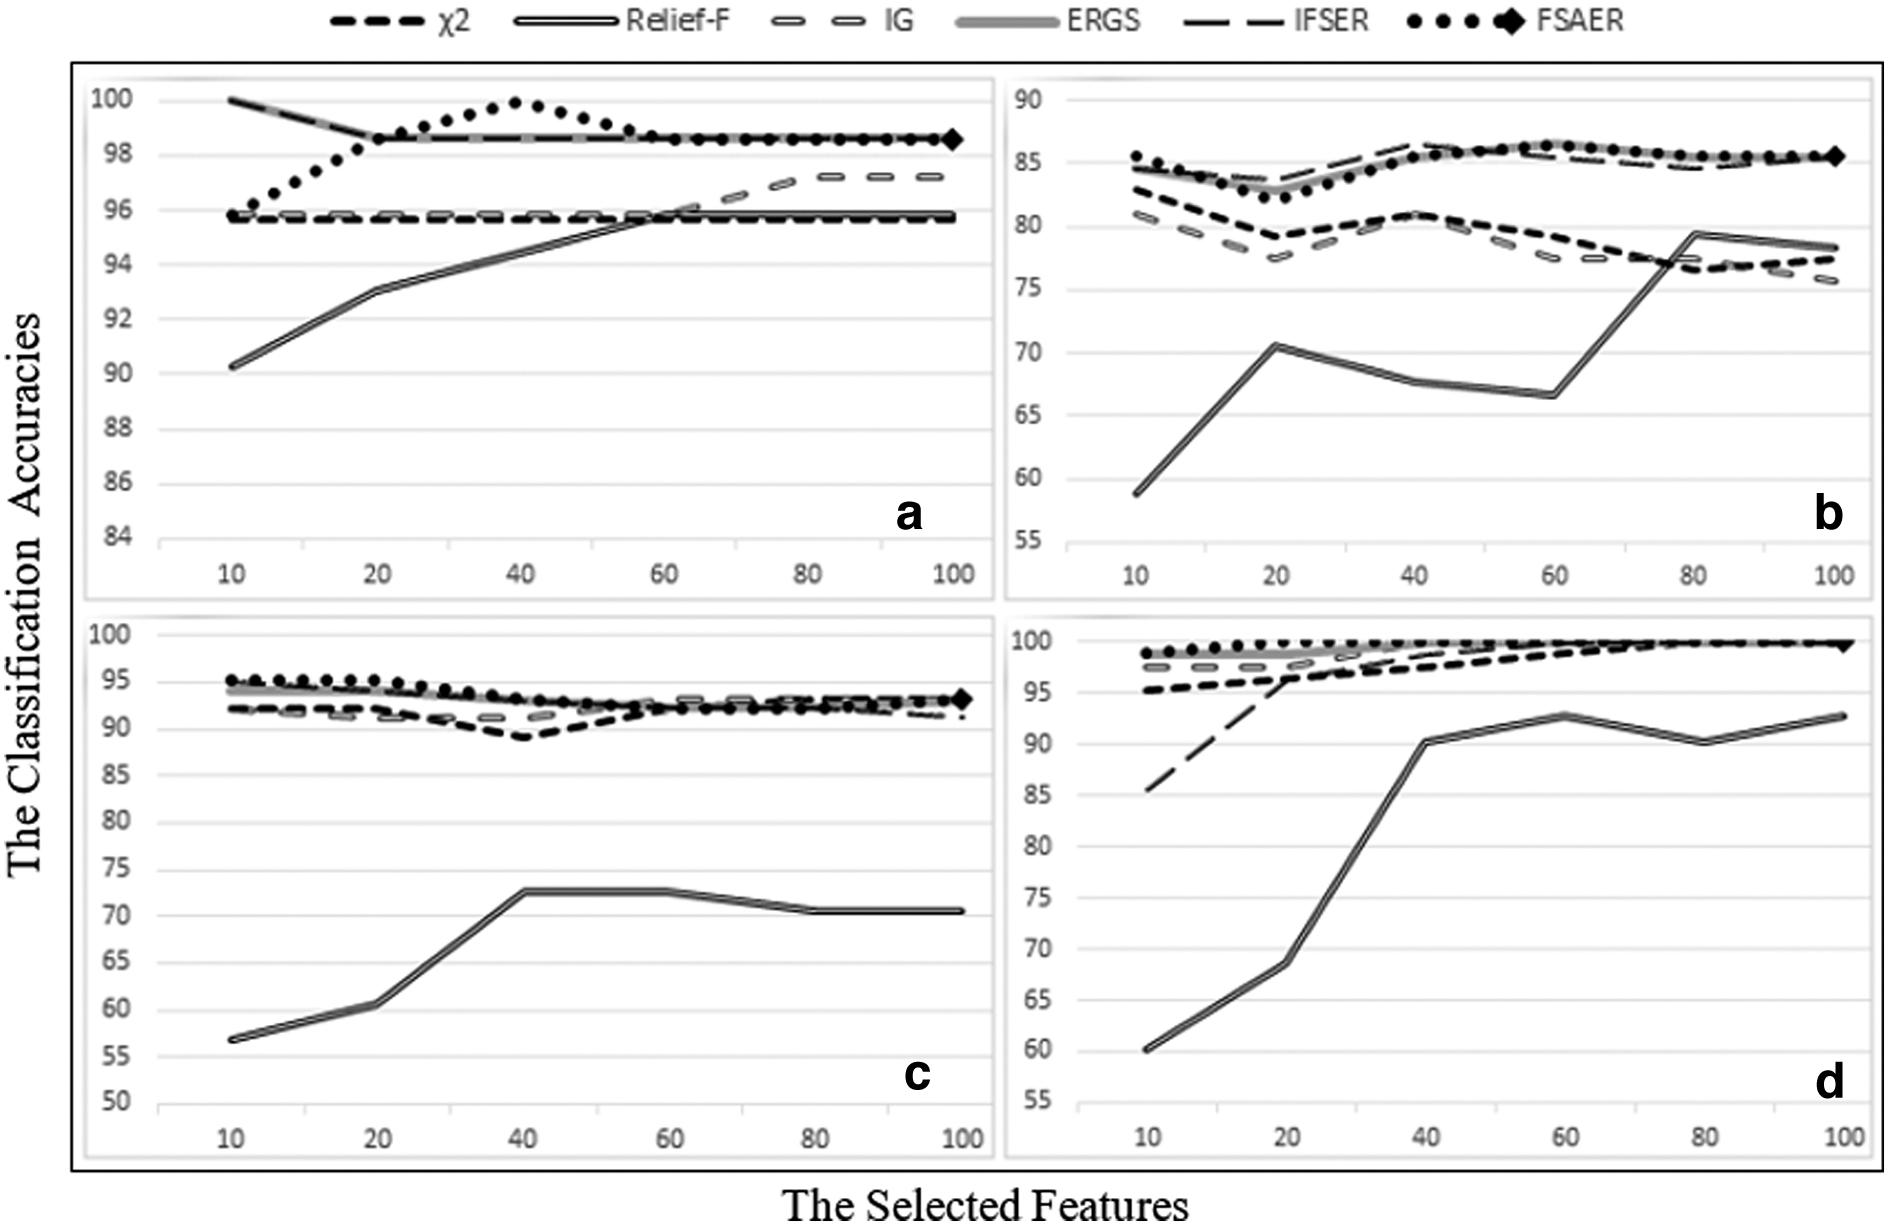
LOOCV classification accuracies (%) with NBC of
When the results obtained for the Leukemia_G data set are examined, it is seen that the FSAER method has the highest accuracy rate of 100% when 40 features are selected. In addition, the FSAER algorithm has yielded very good results compared with other methods when the selected feature sizes are 20, 40, 60, 80, and 100.
When the results obtained for the Leukemia_Z data set are examined, it is seen that the highest accuracy rate of 98.61% is reached when 10 and 100 features are selected with the FSAER method.
Leukemia_G and Leukemia_Z are two data sets of the same size, but their number of classes is different. When the results of two data sets are examined, it is seen that the FSAER method gives quite effective results for both two-class and three-class data sets. This shows that the method works effectively for both two-class and multiclass data sets.
The highest classification accuracy for the Colon data set has been provided by the Relief-F method, while the results of the FSAER and ERGS methods have been the same.
In the Leukemia_C data set, ERGS and FSAER have given the highest accuracy rate of 86.49% for 60 features. In the case of 10 features, FSAER has given better results than all other methods.
When the Prostate data set is examined, it is seen that the highest accuracy rate in the table is 95.10% when 10 and 20 genes are selected with the FSAER method. Although there is a decrease in accuracy rates as the size of the feature increases, the classification accuracy for FSAER in other cases is quite high.
When we look at the data sets, Leukemia_C and Prostate are more high-dimensional data sets compared with others. The results show that FSAER is quite successful. This suggests that the proposed FSAER method gives effective results when the data size increases.
In the SRBCT data set (4 classes), it is seen that the FSAER method reaches the highest accuracy rates regardless of how many genes are selected (10, 20, 40, 60, 80, and 100).
Experimental results using SVM classifier
Table 4 shows the classification accuracy as a result of using the SVM classifier with different size subsets (10–100) obtained from feature selection methods for six different gene expression data sets. Table 4 and Figure 8 show that the FSAER method often has for all data sets the highest accuracy rates.
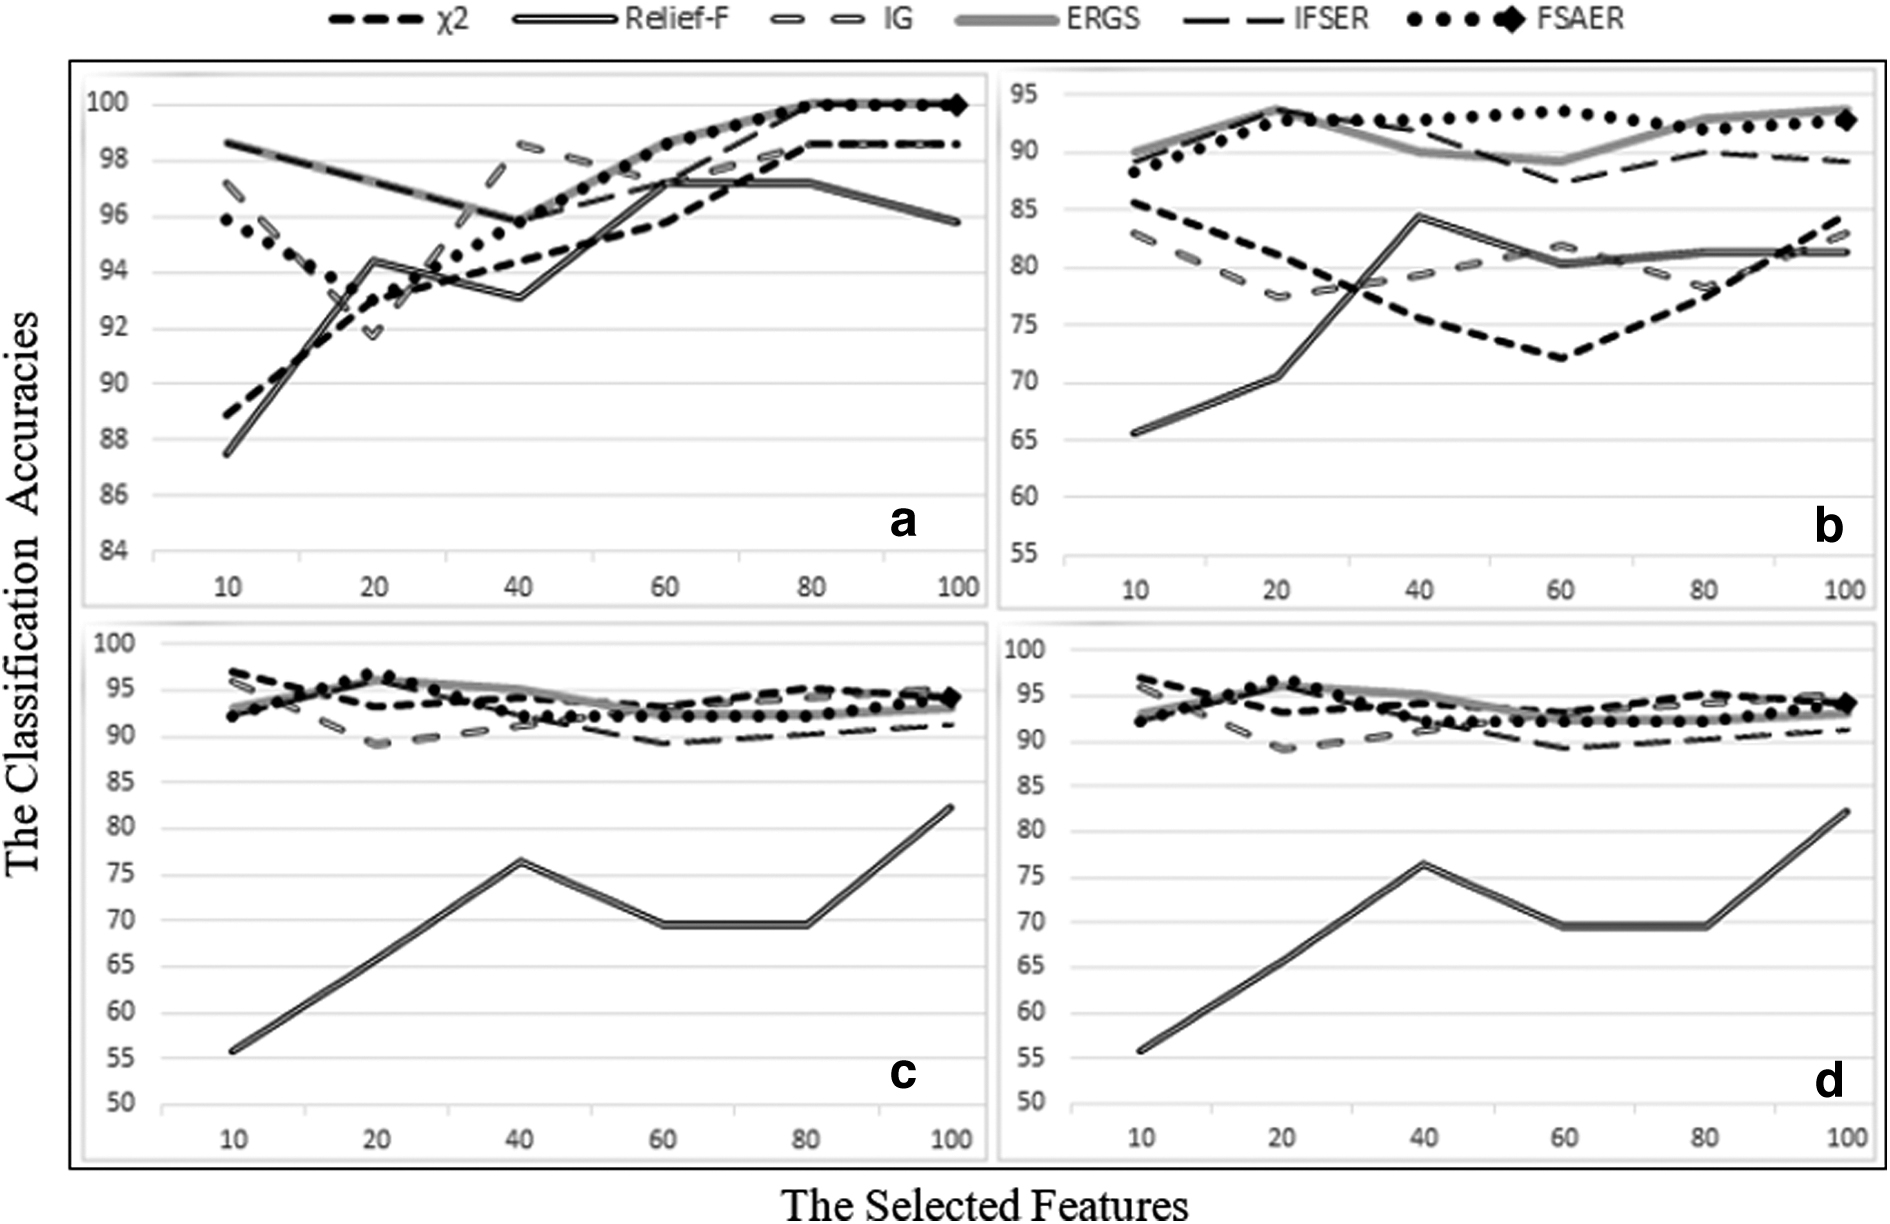
LOOCV classification accuracies (%) with SVM of
When the results obtained from the Leukemia_G data set are examined, it is seen that the highest accuracy rate of 100% is reached when the 80 and 100 features are selected with FSAER, ERGS, and IFSER methods. In addition, FSAER and ERGS methods have given the highest accuracy rate for the 60 selected features.
When the results obtained from the Leukemia_Z data set are examined, it is seen that FSAER and ERGS methods have the highest accuracy rate of 98.61% when 40 features are selected.
For the Colon data set, the highest accuracy rate of 85.48% is seen to be achieved when 10 features are selected with FSAER and ERGS methods. In addition, FSAER, ERGS, and IFSER methods have given the highest accuracy rate for selected 40 features.
In the Leukemia_C data set, when 20 features are selected, ERGS and IFSER methods provide the highest accuracy rate of 93.69%. When 60 features are selected, the FSAER method has the highest accuracy rate.
When the Prostate data set is examined, the χ2 statistics method reaches the highest accuracy rate of 97.06% when 10 features are selected. When 20 features are selected, the FSAER method reaches the highest accuracy rate.
When the results obtained from the SRBCT data set, which has four classes, are examined, ERGS and FSAER methods perform remarkably well.
Experimental results using KNN classifier
Table 5 shows the classification accuracies as a result of using the KNN classifier for different size subsets (10–100) obtained from the feature selection methods on six different gene expression data sets. Table 5 and Figure 9 show that the FSAER method often has for all data sets the highest accuracy rates.

LOOCV classification accuracies (%) with KNN of
When the results obtained from the Leukemia_G data set are examined, it is seen that FSAER and ERGS methods reach the highest accuracy rate of 98.61% when 60 features are selected.
When the results obtained from the Leukemia_Z data set are examined, it is seen that the FSAER method reaches the highest accuracy rate of 97.22% when 40 features are selected.
The highest accuracy rate for the Colon data set is 88.70%. FSAER and ERGS methods have reached this classification accuracy with 40 features. These two methods have the best accuracy together.
Conclusions
This study proposes a new statistical feature selection approach named FSAER. As an extension of the previous ERGS and IFSER algorithms, our novel method includes the advantages of both methods while taking into account the disjoint area.
By applying three classification methods (NBC, SVM, and KNN) using the features selected by FSAER to six different publicly available gene expression data sets, classification accuracies have been obtained and compared with previously known filter methods. As a result, the knowledge of “the selected feature subsets,” denoted on the charts, can be obtained. In this way, the genes needed to diagnose and treat the related diseases can be achieved.
The purpose of feature selection methods is to reduce the size of the features before classification in multidimensional data sets. The proposed method does this by assigning weight to the features. Therefore, this method is not only applicable to gene expression data sets but also to other multidimensional data sets.
In recent years, hybrid methods have been used for feature selection in the literature.53–58 We studied statistically based filter methods, which is a very important step in hybrid methods, to make a more effective contribution to this field. Our forthcoming studies will be on proposing hybrid methods, including the filter method we have improved.
Footnotes
Authors' Contributions
D.T.: Methodology (lead); writing—original draft (lead); software (lead); and writing—review and editing (equal). B.A.: Methodology (supporting); writing—original draft (supporting); software (supporting); and writing—review and editing (equal). Ö.Y.: Methodology (supporting); writing—original draft (supporting); and writing—review and editing (equal).
Author Disclosure Statement
No competing financial interests exist.
Funding Information
No funding was received for this article.