
Abstract
Understanding engagement patterns of users in online platforms, may it be games, online social networks, or academic websites, is a widely studied topic with many real-world applications and economic consequences. A holy grail in this area of research is to develop an automatic prediction algorithm for when a user is going to leave the platform and devise proper intervention. In this work, we study online recreational games and propose to model the engagement patterns of players through an unsupervised learning framework. We think of engagement as a continuous temporal process, measured along specific axes derived from gaming users' data using principal component analysis. We track the overall trend of the projection of the data along the significant principal components. We find that the geometric variability of the trajectory is a good predictor of the users' engagement level. Users characterized by a time series with large variability are users with higher engagement; namely, they will continue playing the game for prolonged periods of time. We evaluated our methodology on two data sets of very different game types and compared the performance of our method with state-of-the-art black-box machine learning algorithms. Our results were fairly competitive with these methods, and we conclude that churn can be predicted using an explainable, intuitive, and white-box decision-rule algorithm.
Introduction
The availability of smartphones has led to the emergence of a large online gaming industry. Since its launch in 2012, the Google Play store is now home to more than 300,000 active applications, with over 250 billion downloads in total. Among these, less than 10 applications have achieved 5–10 billion downloads. For free games, these numbers are much lower; there are only 500 games with over 1 million downloads, and less than 20 games have achieved over 100 million downloads. Thus, gaming companies are faced with heavy competition and high rates of disengagement.
Disengagement is the process in which the player gradually loses interest in the game, leading to the final abandonment of the platform, which is commonly termed “churn.” Similar phenomena manifest in various fields such as online learning systems,1–3 e-commerce sites, 4 and community engagement during an environmental crisis. 5
Our work focuses on casual games, characterized by their simplicity and short sessions. 6 In the past, casual games such as Pinball were played in arcades and followed a pay-per-play revenue model. Later, users bought games such as Tetris and Minesweeper for their computers; some operating systems included these for their users. Casual games such as Snake and Bubble Shooter transitioned from computers to mobile phone interfaces, usually following a freemium pricing model that provides either in-game purchases or space for advertisements. 7 The casual gaming industry is especially susceptible to the problem of churn. This is largely due to the fact that casual games do not require many resources from the players. Skills are easily gained, levels are completed, and the overall trend to play a specific game passes. Thus, users are compelled to move on to the next popular game.
That being said, it is important for casual gaming companies to retain their users. It has been shown 8 that a high retention rate results in higher profit for game companies compared with acquiring new users.
It is particularly difficult to model user engagement in casual gaming, as the users play in their leisure times with seemingly random patterns. Although challenging, modeling individual behavior patterns that lead to churn allows game developers to devise better marketing strategies to improve user retention (e.g., sending push notifications or providing free items in games). By improving user retention, companies would significantly reduce costs since the acquisition cost for new users is much higher than the retention cost for existing users.
A major challenge in modeling user behavior in games is dimensionality: games range in complexity from relatively simple to very complex information systems featuring millions of users and thousands of possible user actions and system responses.9–11 Given the complexity of some games, having a data mining method that can reduce the complexity of the behavioral data sets and provide actionable insights is of great interest.12,13 Interpretability and reliability of results are vital, as decisions based on them affect the game design and eventually the revenue.
Although the importance of user churn prediction (CP) of games has been acknowledged and researched, many existing works seem to suffer from a methodological limitation, which was pointed out in various articles.14–16 Most studies define handcrafted features for predicting user churn, which are then fed to an off-the-shelf supervised learning algorithm.17–19 Such a pipeline does not provide an in-depth analysis of how these features were selected or their importance to the model's success. In general, prediction performance significantly varies depending on how features are defined.20,21 Furthermore, features selected for CP are, in many cases, application-dependent, which implies that current methods cannot be easily adapted to other domains.
In recent years, neural network (NN)-based algorithms were suggested to handle the problem of handcrafted features, and in some problems, these algorithms give state-of-the-art results (e.g., speech, image, and language processing). An NN-based algorithm was proposed in Liu et al. 15 to predict churn in casual games. There are two caveats in using NN-based algorithms: they require a lot of data for training; Liu et al. 15 trained on data from thousands of games from the Samsung Game Launcher platform. Another issue is interpretability. While there are algorithms that propose an interpretation of NN, such as Shapely values, 22 they often give local insights that help in understanding how the model made decisions for a single instance, rather than understanding the overall structure of how a model makes a decision.
The problem of disengagement is usually approached as a supervised classification of churned or returning players.17–19 While traditional machine learning algorithms are the standard for predictive modeling in mobile games, simple heuristics (similar to our unsupervised principal component analysis [PCA]-based method) provide several advantages as follows. They are easy to deploy as a simple rule system in the client device; they tend to have lower computational cost than machine learning-based models; and they are easier to explain to nonexpert decision makers and thus achieve organizational acceptance for them.
Our contribution
We study a universal pipeline for predicting churn in online games, which can be run both in supervised and unsupervised mode. A restricted version of this pipeline was introduced in Hershcovits et al. 23 and its usefulness was demonstrated in an e-learning platform. In this study, we elaborate on the pipeline, prove its usefulness in a more challenging platform, and explore different aspects such as robustness.
At the basis of our approach is the working hypothesis that diverse use of the system reflects high levels of engagement. This hypothesis is inspired by studies in e-learning showing that varying the pedagogical challenges posed to students and the skills required to meet the challenges positively contributes to students' motivation and retention.24,25
We infer the user's engagement level from temporal sequences of user data. We quantify the diversity of using the system (a game in our case) by the geometric variability of the trajectory of the user's temporal data. Since the time series is multivariate, it defies simple geometric patterns such as monotonicity. To overcome this problem, we project the time series onto the leading principal components (PCs) and examine the geometry after projection. The different geometries are illustrated in Figure 1, top panel.

(Top) Illustration of the geometric variability of the time series trajectory along the first principle component (PC1) axis in the Bubble Shooter game. Four different users are portrayed with monotonically decreasing (black), monotonically increasing (red), fixed (blue), and variable (green) trajectories. (Bottom left) The distribution of trajectory types in Bubble Shooter batch1 data set, along with the percentage of churners in each type. Churn rate is lower for variable trajectory. (Bottom right) Zoom in on the variable trajectories for Bubble Shooter batch1 data, and breakdown according to the number of times the trajectory changes trend (CC). Churn rate drops as CC increases. CC, change count; PC, principal component.
To get some intuition about how trajectory geometry correlates with user experience, consider, for example, a monotonically increasing trajectory. Such a pattern may suggest that the user is stressed by, for example, the increasing complexity of game episodes. Following this example, a monotone decreasing trajectory may point to boredom. The table in Figure 1 (bottom left) demonstrates how our working hypothesis manifests in the Bubble Shooter data set that we collected: users' trajectories are either monotone down or variable, and the gap in churn rates is consistent with our hypothesis. The second table in Figure 1 (bottom right) zooms in on the variable trajectories. The variable trajectories are broken down according to the number of times the trend changes. We see that the churn rate drops as the change count increases; that is again in line with our working hypothesis.
We evaluated our approach on data from two very different game types: a simple freemium Bubble Shooter game and a sophisticated massively multiplayer online role-playing game (MMORPG). The data for the Bubble Shooter game are an in-house data set to which we had exclusive access, and the second data set was used in an open competition. 26
We compared the performance of our simple, explainable algorithm to that of supervised “black-box” algorithms. In all cases, the performance achieved by our algorithm was in the same ball park (around 10% worse in F1 score) as the best supervised algorithm. For example, in the gaming competition, our unsupervised variant obtained an F1 score of nearly 0.5, arriving in the 9th place out of 13 teams. Our supervised variant came in the 7th place with an F1 score of 0.53. The competition winner, whose method was based on NNs and a plethora of carefully designed features, obtained an F1 score of 0.62.
To conclude, we propose a complete pipeline from raw data to modeling of engagement types, which can be trained both in supervised and unsupervised manners. Our method is general, and the suggested pipeline can be adapted to other data sets and domains where user engagement levels are of interest, providing an explainable white-box alternative to black-box algorithms.
We tested the robustness of our approach by changing the set of features with which our pipeline is trained. The different sets of features resulted in the same performance (see the Robustness section). As pointed out before, which features to choose, and how that selection affects the performance, is a wide concern; our methodology provides a way to deal with that problem by introducing another layer of abstraction over the selected features—the trajectories.
Defining Churn
Churn is seen as a loss of interest in the product (game in our case). The definition of churn varies depending on the relationship between the company and the customer. For example, a customer is often bound by a contract in the telecommunication industry. Hence, churn can simply be defined as not renewing the contract or asking to leave midway. Some of the MMORPGs are also based on subscriptions. Casual games, however, are widely based on freemium models where players might not return to the game for a few months or even for good without notifying anyone. In such an environment, it becomes impossible to have one single golden definition of churn.
Churn may be quantified by not using the product for a defined period of time, after which most customers do not return. The threshold value for the limit time after which a player is labeled as a churner may be chosen from the data, and in most works that study casual games, this value is typically between 7 and 14 days (e.g., Runge et al. 19 ). Figure 2 shows the distribution of active days per player in the Bubble Shooter data. Only 30% of the users played for more than 7 days.
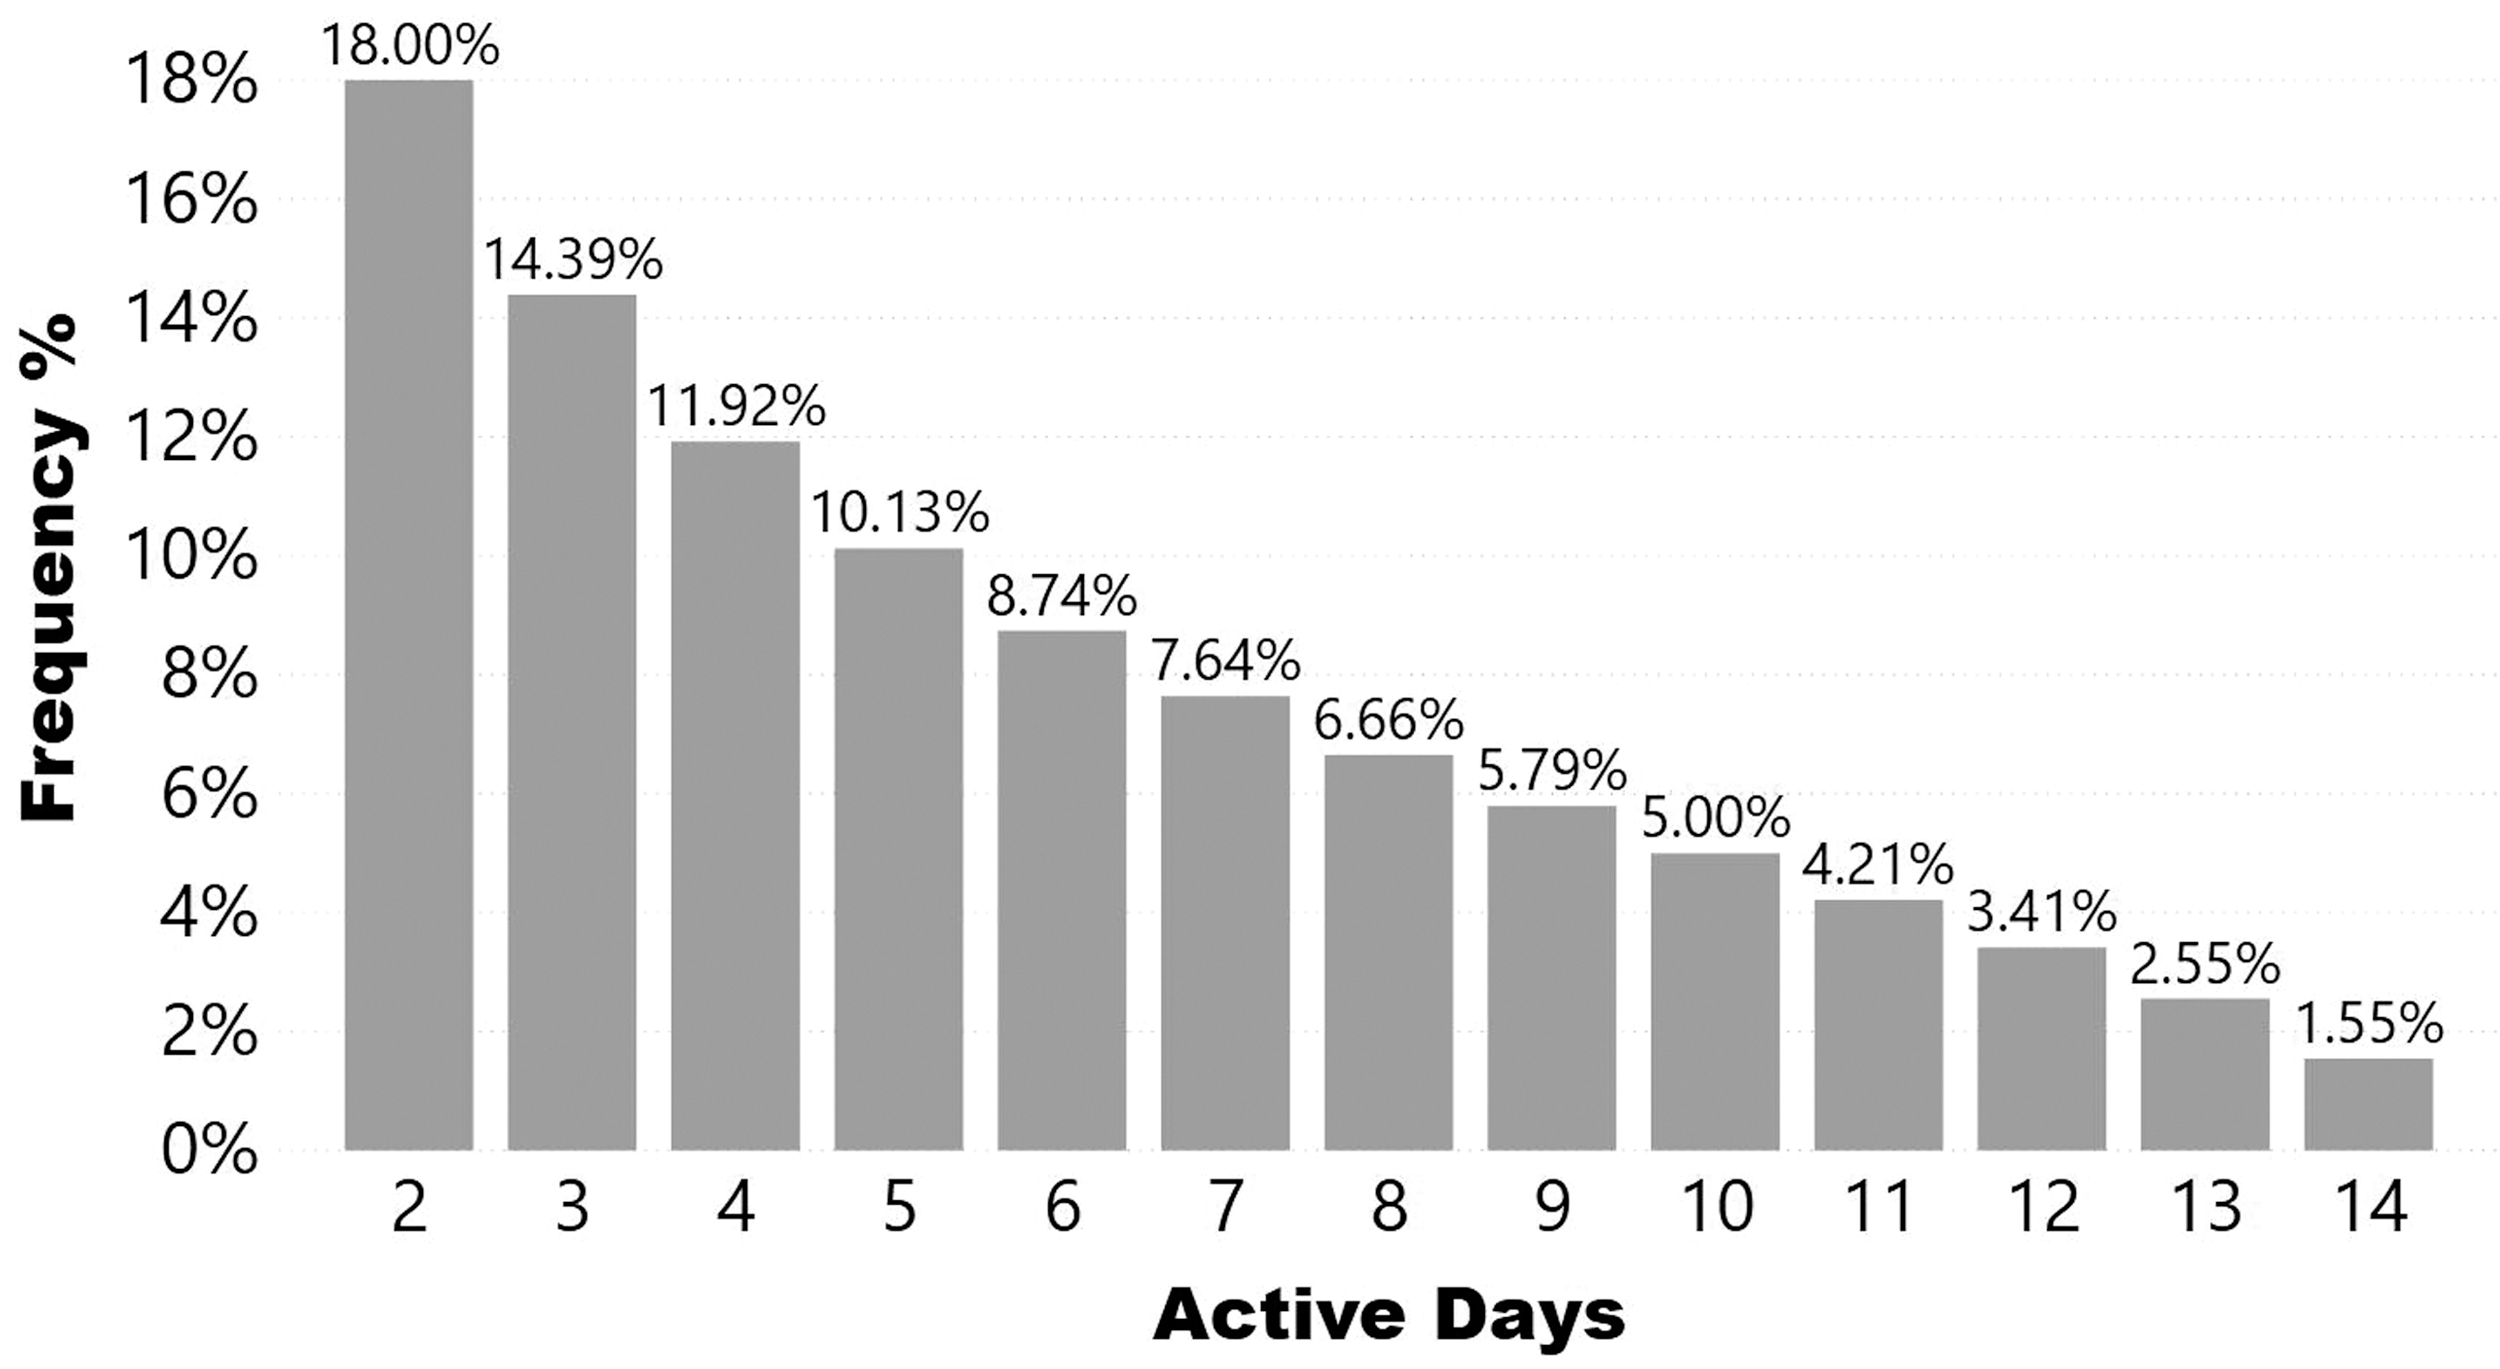
Active days' histogram over the first 14 days from installation of 66,767 Bubble Shooter game users. Data collected during July 2019. Only 30% of the users play more than 7 days.
Another definition of churn is that of soft churn from Hadiji et al., 27 which the authors claim to be more applicable for real-world settings. Players are labeled as churners if they have low activity. In the Discussion and Limitations section, we explain how our approach is compatible with this churn definition.
In this work, we adopt the prevalent binary definition of churn. We define a churner in terms of the observation period (OP) and CP period. An OP is a period for observing a user's play log data, from which features are extracted to predict churn. A CP is a period for determining whether a user actually churned or not. A churner is defined as a user playing the game at least once during the OP, and not playing the game at all in the CP period. Each individual player may have his own clock (namely, starting time), according to which the OP and CP are measured.
In most works, the OP and CP are defined back-to-back as one continuous time block. While it is likely that user behaviors leading up to the point of churn (e.g., deleting the payment method) would play a vital role in CP, predicting churn just before the point of leaving has a limited effect, as at that point, little can be done to prevent users from leaving. In this work, we tested both the prevalent back-to-back setting and the data sets with a gap of 3 weeks between OP and CP.
Our first data set (the one we collected) consists of two batches, one collected in July 2019 and the other in August that year. We chose OP to be the first 7 days of the user from the game installation date for the July batch, and the CP was the following 7 days (day 8–14). In the August batch, we chose OP to be 14 days from installation and CP to be the next 7 days. This allows us to check the effect of a larger OP on the results of the classifier. See Figure 3 for illustration.

OP and CP period for the Bubble Shooter game collected during July and August 2019. CP, churn prediction; OP, observation period.
Our second data set comes from an open competition. The training set had an OP of 6 weeks and CP of 5 weeks; 3 weeks separated the OP and the CP. There were two test sets, each consisting of 8 weeks of OP and 5 weeks of CP, again separated by 3 weeks. The test sets are 2 and 4 months ahead of the training set (see Fig. 4).
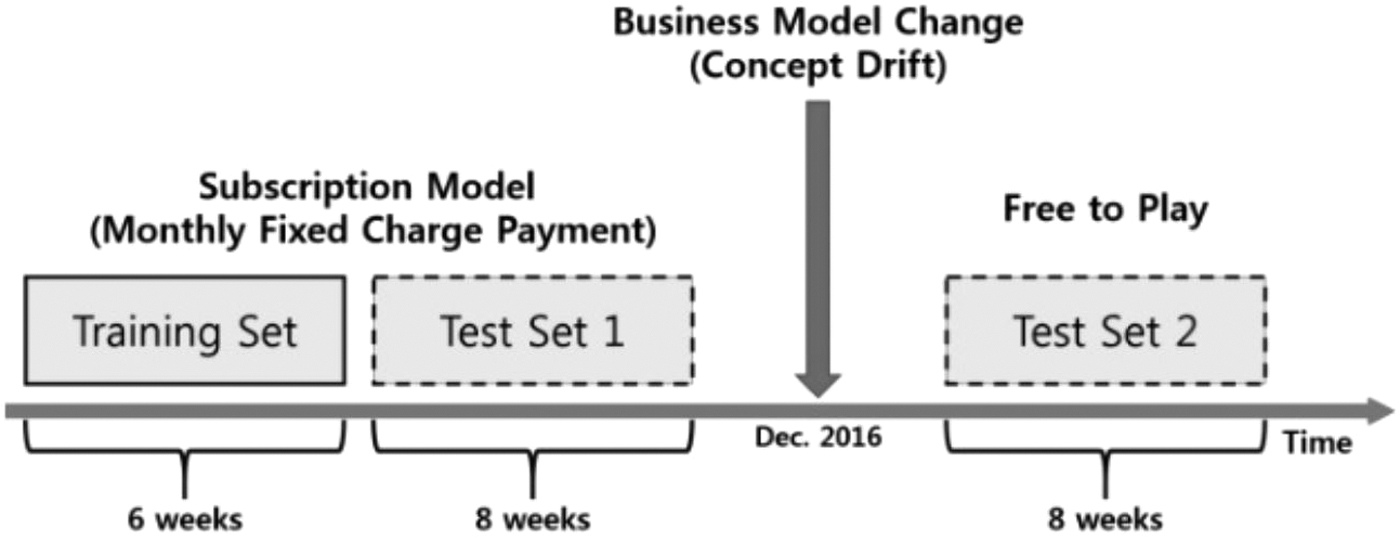
Description of the competition data, along with the change in business model between the two test sets. Figure taken from Lee et al. 26
Related Work
Predicting churn is a topic of interest in many fields, such as retail, 28 customer retention, 29 telecommunications, 30 and direct marketing. 31 With the recent rise of mobile phones and online gaming, attention has been drawn to predicting churn in the gaming industry. Most works extract handcrafted features from users' log data and apply supervised learning methods to predict churn.14,27,32
The problem of highly biased data has been addressed in F2P games by Xie et al., 18 where various supervised learning algorithms were tested. Predicting churn for high-value players has been discussed in Runge et al. 19 In Drachen et al., 33 users likely to churn rapidly after installing the game were studied.
A related problem to predicting engagement levels of users is identifying which players will become payers. As most of the casual game industry comprises the aforementioned F2P games, it is interesting to understand what parameters can predict whether a player will become a payer. A binary supervised classification model for “payer” and “nonpayer” was introduced, 34 and it was concluded that previous purchases, in-game interactions, and total time spent playing are strong indicators to determine future player purchase behavior.
Another line of work that is tangent to ours is players' behavior modeling, such as in Canossa et al. 35 where players' frustration was studied, and in Sifa et al., 36 where user behavior evolution in the Tomb Raider game was studied.
Hybrid models containing supervised/unsupervised methods have been applied to problems relating to the telecommunications industry. 30 Less work has been done for the casual gaming industry. Data from thousands of games from the Samsung Game Launcher platform have been used in Liu et al. 15 to train a supervised inductive model, based on NN-derived embedding, to capture the dynamics of a player in a mobile game.
Several works used a time-series-based approach to predict churn. Khodadadi et al. 16 propose a pipeline based on Temporal Point Processes and Recurrent Neural Networks to predict the user return time to the application. In Borbora and Srivastava, 37 users' behavior is modeled as three one-dimensional time series over three features. Each represents a different semantic direction: Engagement, Enthusiasm, and Persistence. The time series are then clustered, and clusters of churners are identified. In Zheng et al., 38 a sophisticated context embedding is combined with an long short-term memory (LSTM) network to predict churn, and in Castro and Tsuzuki, 39 a discrete wavelet transform is performed on the login time series of users, and the extracted frequencies are used as features for classification.
Our work departs from all these works in several key aspects. First, our time series is one-dimensional, but the PCs are a linear combination of all the features. Thus, we could circumvent the dimensionality problem while not compromising the data. Second, we do not use any black-box methods such as recurrent neural network or LSTM, making the method hard to interpret and explain to nonexperts. Third, we have a straightforward decision rule rooted in educational theory.
We may also compare our work with two supervised pipelines.15,37 In both cases, most of the pipeline is unsupervised (embedding in the former and clustering in the latter), and labels are used only in the last step. The F1 score achieved in Borbora and Srivastava, 37 although on other data sets, was between 0.5 and 0.58, which is similar to what we obtained (see Table 5). The average performance of the algorithm in Liu et al. 15 had both recall (0.78) and precision (0.32), similar to our method.
Gaming Data
We evaluated our approach on two data sets from two different games, one we collected ourselves and the other from an open competition. 26 The competition data set contained “practical contamination.” For example, a much longer time span (3 weeks) was given between the training data and prediction window, reflecting the time required to apply the churn prevention strategies to retain potential churners. Another contamination was a change in the business model. Specifically, the train and test data sets are each from different periods. Between the two periods, the business model of the game changed. This allows measuring the robustness of the model when applied to constantly evolving conditions.
Bubble Shooter game
This data set was collected from a mobile casual game of the Bubble Shooter type, for which we had in-house exclusive access. Bubble Shooter is a single-player mobile game. The game's goal is to clear the screen of colorful balls by creating groups of identical colors; see screenshot in Figure 5. It can be played either under a time limit or a shots limit (this article's data refer to the shots limit version). In the current mobile version, the player can use “boosters” (in-game items) to help him complete the level. These boosters are purchased using in-game currency (coins). In the game there is also a reward system that grants the user booster/coins depending on his completion of side-quests levels and other in-game features. The game is free to download and play, and revenue is made from in-app purchases or advertisements.

Bubble Shooter game screenshot taken from www.bubbleshooter.com
The data set consists of raw log data of 66,767 users collected in July 2019; for each user, a period of 14 days from the installation date was recorded. A second set consists of 70,756 users collected during August 2019. This time, 21 days were observed for each user from the installation date. The raw log data represent event interactions in the game such as starting and ending a level event, using in-app currency, total session time, and more.
The data set was labeled according to the definition discussed in the Defining Churn section. In July 2019, the OP and CP were both 7 days each. In August 2019, the OP was 14 days, and the CP was 7 days. The class distribution is shown in Table 1.
Class distribution of the evaluation data sets
Feature computation
We defined 17 features that belong to two categories: monetization and activity. Each feature is computed as an average over the days of the OP. Table 2 describes the features. Monetization-type features included any real money and/or in-game purchases and virtual currency transactions, and user daily currency balance. Activity-type features included daily counts of levels started/completed/failed or abandoned, in-game achievements, and rewards.
Description of features collected for every user in the Bubble Shooter game
Blade & Soul
Blade & Soul is an MMORPG-type game, published by NCSOFT in 2012, that features a combination of epic martial art actions with highly customizable characters (see Fig. 6). The game is played in a single mode where the player can experience numerous quests and dungeons and can be played player-versus-player in an arena mode. The latter pushed the game to gain global popularity. The data set we used was made available in a CP competition hosted for 5 months, from March 28, 2017, to August 25, 2017. More than 300 registrations on the competition's Google Groups were given access to the log data, and a total of 13 final submissions. 26

Blade & Soul game screenshot taken from NCSOFT's Twitter account.
The competition was designed to incorporate concept drift, specifically, a change in the business model, to measure the participant model's robustness. Consequently, the competition comprised two test data sets, each from different periods.
The training data consisted of 4000 users whose log data were collected from April 1, 2016, till May 11, 2016, and two test data sets consisting of 3000 users each. Figure 4 depicts how the three sets spread over the time line. The class distribution is detailed in Table 1.
Feature computation
The data provided for training and test consisted of 82 log events that were categorized into 6 different types: connection, character, item, skills, quest, and guild. The OP in the training set was 6 weeks long and 8 weeks in the test. The logs were quite sparse in terms of user activity. We located for each user the week where that user was most active and computed the features only over the log events in that week. We found this approach to perform better than computing features over the entire period's logs. The feature list can be seen in Table 3. In this case, the features belong only to the activity category.
Description of features collected for every user in the Blade & Soul game
Methodology
We describe the methodology for inferring user engagement from temporal sequences of a player's log data. The method consists of four stages: (1) extracting features from the user's data log, (2) computing PCA on that set of features and extracting the leading PCs, (3) the generation of a time series for every user by computing the user's score on the leading PC(s), and (4) users are labeled according to their time series pattern, where each pattern corresponds to the engagement level in the game.
Our method's pipeline is illustrated in Figure 7. We call our algorithm PCAT, which stands for PCA trajectories. Tables 2 and 3 list the features that we extracted from the gaming data that we have used in the evaluation of our pipeline [Step (1) in our pipeline]; the reader may get an idea of the type of features that are commonly used.

Our user CP pipeline, from raw data to labeling. Classification is done based on the geometry of the time series trajectory along one of the PCs.
Computing PCA and constructing time series
PCA is a popular technique for dimension reduction and feature selection with a wide range of applications involving multivariate data in many diverse fields such as engineering, biology, finance, and social sciences (see e.g., Anderson 40 and Jolliffe 41 ). Typically, PCA is used statically; namely, a low-dimensional snapshot of the distribution is obtained, and patterns are examined. We use the axes provided by PCA to generate a dynamic view of the system, from which the level of engagement is derived.
The PCs are linear transformations of the original set of features, chosen according to the maximization of the variance criterion. As such, the PCs provide a new coordinate system along which the data may be redrawn. The significance of every PC is measured according to the amount of variance along its direction.
A time series for user u consists of projections of its accumulated data on a fixed PC at a fixed frequency. Formally, for every user u at time t, we associate a vector
We further introduce a smoothing over the trajectories to filter out small variabilities in the trajectory that one would like to treat as constant. To that end, for each PC index i and time stamp tj, we compute the standard deviation (SD)
At every consecutive time steps Fixed if all steps are fixed. Monotone up if all steps are up (and similarity monotone down). Variable if there is at least one step up and one step down.
Note that the PCA is computed over all the points (players) in the training set, disregarding the labels (churn or not). Thus, this step is entirely unsupervised.
Classification using trajectories
We now describe the decision rule, which maps the trajectory type to a label: “churn” or “not churn.” We assume that we have already computed the PCs. We describe the rule with respect to the leading PC. However, it may be easily generalized to using multiple PCs as well. The decision rule is parameterized with a predefined threshold
Compute the user's trajectory in the OP along the leading PC.
If the trajectory is either fixed or monotone, such a user is labeled as “churn.”
Otherwise, count how many times the trajectory changed orientation (see Fig. 8 for an illustration).
If this counter is larger than
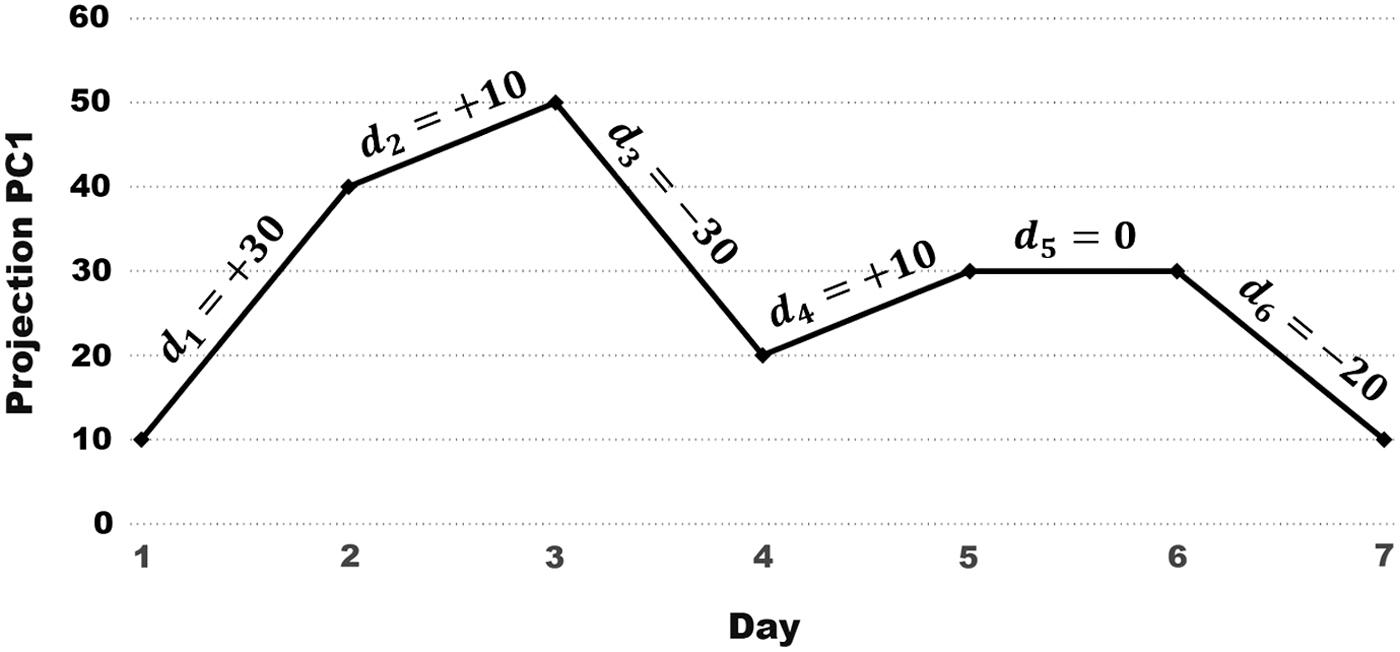
A user's 7-day trajectory along the first PC,
The hyperparameters
Meta-features and logistic regression
In the “Classification using trajectories” section, we described a decision-rule-based algorithm for labeling a user as churn or not. This approach straightforwardly encodes our working assumption about the diversity of using the system as a telling sign of higher levels of engagement.
In this study, we suggest an alternative classification algorithm, which is more opaque but still relies on the computed trajectories.
Compute the user's trajectory in the OP along the leading PC.
Extract from the computed trajectory a host of features: the total area under the trajectory's curve (AR); the number of times that the trajectory changes trend (CC = change count); and the total variability (TV) of the trajectory. The computation of TV is explained in Figure 8.
Train a supervised-learning classifier C with these features.
We use the notation
Results
In this section, we report the evaluation of our pipeline, in various configurations, on the two data sets above.
Train-test setup
The Bubble Shooter game consists of two batches, July and August 2019 (Fig. 3). Each bath constitutes a separate train-test pair (batch1, batch2). We split each batch into half of the users that are used for training and the other half for testing (about 35,000 users in each of the train-test sets). Features were computed only from the OP, and labels were computed according to the activity in the CP. PCA was computed over all the users in the training set, regardless of their label. The only step in the training where labels were used, if at all, was to set the two hyperparameters
For the Blade & Soul game, the training and testing data sets were prepared by the competition organizers. In addition to splitting the users into train and test, the time periods are different, as portrayed in Figure 4. The training set was collected in March–April 2016, and testing was done in two batches, July–September 2016 and December 2016, until February 2017.
Computing PCA
The 17 × 17 covariance matrix for the Bubble Shooter game data was computed, and PCs were extracted. All the users in the train set were used, and only data from the train's OP were taken into account.
The leading PC explains 39.49% of the variance. Using the Kaiser-Guttman criterion,
42
PCs that explain less than
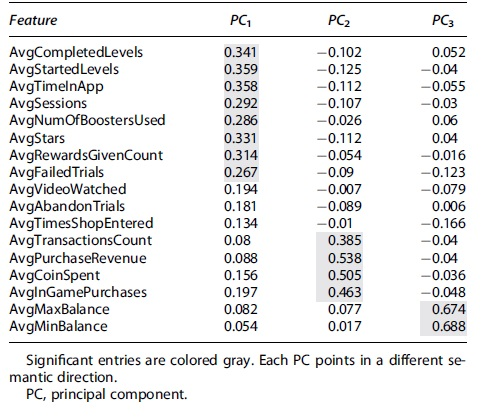
Feature weights for PC1, PC2, and PC3 of the Bubble Shooter data
Evaluation of our pipeline on the Bubble Shooter gaming data
Results sorted in ascending F1-score order.
AR, area under trajectory curve; CC, change count; LR, logistic regression; TV, total variability.
For the Blade & Soul game, we computed the 11 × 11 covariance matrix; here, the first PC explained 58.7% of the variance, and the top five PCs passed the Kaiser-Guttman criterion.
Table 4 shows the feature weights for
PC1: The features providing the largest contribution to PC1 are from the engagement/activity feature category: the average number of started levels, time spent in the app, number of sessions, number of stars, the count of rewards given, and the number of failed trials.
PC2: Here, the top largest features belong to the monetization category and include an average count of transactions made within the game, the user's purchase revenue, the number of coins spent, and the number of in-game purchases.
PC3: The largest entries correspond to the user's average maximal and minimal coin balance per day.
The top three PCs point in different directions (activity, monetization). We can proceed with our pipeline by choosing one of them (or combining several). Experimenting with each of the PCs, we found that classifying by trajectories along PC1 gave the best results. Adding information from trajectories along other PCs resulted in a minor improvement.
We repeated the PCA computation for the Blade & Soul game. Similar to the Bubble Shooter game, trajectories along the leading PC were the most informative. Nevertheless, a logistic regression over the area under the trajectories' curve along the top five PCs gave the best result (Table 6).
Evaluation of our pipeline on the Blade & Soul gaming data
Results sorted in ascending F1-score order. We also report the results of three competitors in the original competition (first place, middle, and last, 13th place), table 3 in Lee et al.
26
Classifiers' results
We tested the two pipelines that are described in the Methodology section: PCAT, which classifies according to predefined rules about the trajectory types, and
We tested PCAT with various configurations of the smoothing parameter
We trained a data-driven black-box learning algorithm to benchmark our theory-driven white-box approach. Concretely, we trained a random forest classifier over the nonaveraged data features, namely the 17 × 7 = 119 features of the 7 OP days. We used Python's sklearn with the following parameters. For batch1: max_depth = 6, min_samples_split = 10, n_estimators = 500, min_samples_leaf = 5; for batch 2: max_depth = 8, min_samples_split = 15, n_estimators = 800, min_samples_leaf = 5.
Table 5 presents the results of all these methods for the Bubble Shooter game for the two batches, July 2019 and August 2019. The OP for batch1 is 7 days and for batch2 is 14 days. The CP is 7 days for both. The measures we report are precision, recall, and the F1-score on the churn class (the minority class), as this was also the measure used in the Blade & Soul competition and also in the previous work that we compared against.15,37
As evident from Table 5, the best result of PCAT for batch1 is obtained with smoothing parameter
The best result of the supervised version
For batch2, both PCAT and the random forest do better in terms of F1-score compared with batch2. This is because the OP has increased from 7 to 14 days. The gap between the supervised and unsupervised versions of PCAT and between
Including the feature AR (the volume of activity) in
In Table 6, we see the results obtained in the Blade & Soul competition data set.
26
Recall that this data set is more challenging in two aspects. First, the OP and CP are separated by 3 weeks, and second, there was a business model change in the time span between test1 and test2. We compared the performance of PCAT with other participants in that competition; all of them used state-of-the-art machine learning (ML) models, including NNs, deep NNs, and different variants of random forests. On the contrary, we used a lightweight white-box and an easily explainable method, anchored in educational theory. Had we competed in this competition,
Also, note that our method performed just as well, and perhaps slightly better, on test2, which was collected after the business model change. This fact testifies to the robustness of our method. In addition, the optimal choice for
In the article, following the competition, the authors emphasize that proper data preprocessing was highly important in achieving high prediction performance. The winner, Yokozuna Data, used the most various features among participants. They used daily, entire period, time-weighted, and statistical features. We, on the contrary, made little effort to engineer features. The crux of our method lies in the fact that regardless of the features, as long as they are reasonable, the PC trajectories give sufficient information for classification. Indeed, we proved this point by overtaking half of the competitors.
Finally, let us note that in both games, the recall is often considerably higher than the precision across all algorithms we tested or cited. This phenomenon may be explained by the nature of gaming and the definition of churn. The recall is relatively high because the signature of churners is easy to pick up. However, some nonchurners, probably lightweight users, have a similar signature. Suppose a user played the game once within the OP and once within the CP. Such a user has a clear churner signature in the OP, but since he played once in the CP, he is labeled as a nonchurner. Other churn definitions, such as “soft churn” from Hadiji et al., 27 may lessen this effect.
Robustness
Most of the articles that propose a CP pipeline, design ad hoc handcrafted features. In addition, it is not straightforward to decide to what extent the pipeline's success depends on the exact choice of features. More generally, prediction performance may significantly vary depending on how features are defined.20,21 Furthermore, some features are relevant to a certain game or platform, but not to another. All this precludes the transferability of the pipeline to other games or even similar domains, thus limiting its usefulness.
Our method alleviates such concerns by adding another abstraction layer: meta-features are derived from the trajectories rather than using the original features. To demonstrate our method's robustness, we run the following experiment where we change the set of features with which the covariance matrix is computed and on which PCA is applied. We find that such changes barely affect the performance of the pipeline (in fact, it improves the performance).
We carried out the robustness test for the Bubble Shooter game. We randomly chose 9 features out of the 17 and followed the same testing scheme in the Results section. We repeated this three times. Table 7 reports the performance of PCAT with
Evaluation of PCAT on the Bubble Shooter gaming data with hyperparameters
Three different subsets of features are examined. Features are numbered according to row number in Table 2. The before-last row gives the result for
Discussion and Limitations
We studied a pipeline for predicting churn based on the time series along PCs to model engagement patterns of players in online games. Engagement is a cornerstone of flow, 44 a term in psychology that describes an experience so gratifying that people feel it is worth their while, even if there is no real reward. Flow consists of eight elements, from being a task that can be completed, through the ability to convey a sense of control over actions, to the alteration of the person's sense of time for the duration of the experience. The gaming research community readily adopted the term flow, as the eight elements can immediately be translated to game concepts such as concentration, control, and immersion 45 ; all are different facets of engagement.
In this article, we explored a facet of flow—the diversity of engagement. We quantified this dimension through the geometric variability of the time series trajectory along the PC axes (monotonically increasing/decreasing, constant and variable trajectories). We found that the trend of the data projection along the significant PC is a good predictor of the engagement level (in this study, the level was binary “churn” vs. “not churn”).
A well-observed fact is that the volume of activity is a good predictor of engagement. However, the volume of activity is a relative measure that is rarely transferable between games and even between different time windows within the same game. On the contrary, variability is a unitless universal measure. Indeed, our method proved useful in predicting churn for two very different types of games: a casual fermium simple game (Bubble Shooter) and a sophisticated MMORPG (Blade & Soul). In both cases, the same pipeline was used, while the underlying raw features were not engineered in any particular way. In both cases, a competitive result was achieved with respect to a supervised black-box algorithm.
As for the limitations of our method, the first and most obvious limitation is that the performance of our pipeline is inferior to the best supervised ML algorithm. In other words, there may be a price to pay for simplicity, generalizability, and explainability. Second, we have not checked our method on data sets where the majority class is the churner. In this case, the PCs may be less informative, and then PCA should be computed on the nonchurners only, ridding us of the unsupervised mode. Finally, we tested our method only on two games. Further exploration of additional games and other domains is called for. Unfortunately, at this point in time, such an exploration may not be readily executed since gaming data are rarely shared.
Future work will study more nuanced connections between the trajectory type and the engagement level. We focused on a binary definition of churn. However, engagement is a continuous variable, and other churn definitions, such as soft-churn, 27 may be more suitable in some settings. We expect that we can usefully match trajectory types to a multiclass definition of churn.
Footnotes
Authors' Contributions
I.W.: Software (lead); methodology (equal); conceptualization (equal); and writing (supporting). D.V.: Writing (lead).
Author Disclosure Statement
No competing financial interests exist.
Funding Information
Support for D.V. was partially provided by Israeli Science Foundation grant number 1388/16.