
Abstract
The stock market is heavily influenced by global sentiment, which is full of uncertainty and is characterized by extreme values and linear and nonlinear variables. High-frequency data generally refer to data that are collected at a very fast rate based on days, hours, minutes, and even seconds. Stock prices fluctuate rapidly and even at extremes along with changes in the variables that affect stock fluctuations. Research on investment risk estimation in the stock market that can identify extreme values is nonlinear, reliable in multivariate cases, and uses high-frequency data that are very important. The extreme value theory (EVT) approach can detect extreme values. This method is reliable in univariate cases and very complicated in multivariate cases. The purpose of this research was to collect, characterize, and analyze the investment risk estimation literature to identify research gaps. The literature used was selected by applying the Preferred Reporting Items for Systematic Reviews and Meta-Analyses (PRISMA) and sourced from Sciencedirect.com and Scopus databases. A total of 1107 articles were produced from the search at the identification stage, reduced to 236 in the eligibility stage, and 90 articles in the included studies set. The bibliometric networks were visualized using the VOSviewer software, and the main keyword used as the search criteria is “VaR.” The visualization showed that EVT, the Generalized Autoregressive Conditional Heteroskedasticity (GARCH) models, and historical simulation are models often used to estimate the investment risk; the application of the machine learning (ML)-based investment risk estimation model is low. There has been no research using a combination of EVT and ML to estimate the investment risk. The results showed that the hybrid model produced better Value-at-Risk (VaR) accuracy under uncertainty and nonlinear conditions. Generally, models only use daily return data as model input. Based on research gaps, a hybrid model framework for estimating risk measures is proposed using a combination of EVT and ML, using multivariable and high-frequency data to identify extreme values in the distribution of data. The goal is to produce an accurate and flexible estimated risk value against extreme changes and shocks in the stock market. Mathematics Subject Classification: 60G25; 62M20; 6245; 62P05; 91G70.
Introduction
The stock market is heavily influenced by global sentiment, which is full of uncertainty. This global uncertainty is currently threatening both the economies of several countries and the capital market sector. It is important to note that the severe acute respiratory syndrome (SARS), the Middle East respiratory syndrome (MERS) pandemic, the coronavirus disease 2019 (COVID-19) pandemic, the conflict between Russia and Ukraine, as well as the trade war between the United States and China are examples of negative global sentiment creating uncertainty conditions in the stock market. The shocks caused by the SARS, MERS, EBOLA, and COVID-19 diseases affected the market significantly, showed higher volatility for all financial indices, and had a negative spillover effect on global markets.1,2 It was also discovered that the COVID-19 pandemic greatly increased the uncertainty of the U.S. market and the economy as a whole. 3
The geopolitical issues associated with the Russian–Ukrainian conflict also intensify the risk of commodity market volatility as observed with the agricultural, metal, and energy markets. The conflict is affecting the stock market, specifically the economic and financial sectors, 4 and also presenting significant spillover from geopolitical risk to the renewable energy stock market and oil market uncertainty. 5 Moreover, the trade war between the United States and China also creates uncertainty and affects the movements of the stock markets in the two countries as indicated by the joint movements recorded in mainland China, Hong Kong, and the United States after the release of the United States–China trade news.6,7
The identification of uncertainty shocks is highly dependent on event constraints, 8 and global sentiment has been discovered to have a huge impact and ability to create uncertainty in the world's economy, thereby leading to the collapse of several countries' economic sectors. The condition usually creates fear and doubts among investors in relation to their investment activities and also makes it difficult to identify the best decision. Therefore, investors need the appropriate process, analysis, and methods to mitigate uncertainty before making an investment decision. This means investing in uncertainty requires the support of an effective risk management system to achieve the target while minimizing the possible risks.
A very popular method of predicting the level of risk associated with stock investments is the Value-at-Risk (VaR) model. 9 This method is considered important because when the stock market is in a state of uncertainty or has high volatility, the measurement of risk level using the assumption of normality of distribution becomes less accurate. 10 Moreover, the risk level in stock return data with high volatility and heteroskedasticity at variance values is usually determined using the VaR approach of the Generalized Autoregressive Conditional Heteroskedasticity (GARCH) model11–13 and the Autoregressive Moving Average-GARCH (ARMA-GARCH).14,15 However, these methods cannot accurately detect extreme values in the loss function of the data and often fail to provide a precise risk measure during periods of extreme stock price fluctuations. 16 In this case, the VaR method with the extreme value theory (EVT) can be used to estimate the risk on investment against data that contain heavy tail patterns in stock return data.17–19
The combination of several models usually performs better than the application of a single model, and this is the main direction in stock price forecasting. 20 It was confirmed that the hybrid method is a precise alternative with the ability to produce accurate performance compared with a single model. 21 Several previous studies focused on the calculation of investment risk using a combination of the EVT and other models.
For example, He et al. 22 proposed a nonlinear ensemble methodology based on Multi-Resolution Analysis for VaR Estimates (MRNEVaR) and introduced multi resolution analysis using wavelet analysis to analyze the evolution of dynamic risk in the timescale domain better. The nonlinear ensemble approach used a neural network to determine the optimal ensemble weight and stabilize the prediction. Moreover, the performance of MRNEVaR was compared with the more traditional ARMA-GARCH VaR using the Kupiec test procedure and the Diebold–Mariano test during an empirical study in three major metal markets. The experimental results confirmed that the VaR estimate generated by MRNEVaR provided superior forecasts that are significantly more reliable and accurate than the traditional methods.
Jammazi and Nguyen 23 also proposed a wavelet-based extreme value theory (W-EVT) approach to predict portfolio VaR. The results showed that the W-EVT model provided an effective and powerful tool to measure extreme moments. It also improved the accuracy of VaR estimation as well as the prediction of crude oil price portfolios and U.S. dollar exchange rates after the noise was removed from the original data.
Moreover, He et al. 24 proposed a VaR mode decomposition (MD)-based risk forecasting model using several MD models and the quantile regression neural network (QRNN). The model used a semiparametric data-driven approach to calculate VaR by combining forecasts for normal and transient market risk exposures at different scales. Transient risk factors were extracted using a dynamically selected MD model, and the optimal scale was identified and modeled using the QRNN model. The VaR results estimated by the proposed VaR MD model showed higher levels of reliability and accuracy according to back-testing results in riskier market environments with increasing levels of complexity and volatility.
Zou et al. 25 understood that crude oil price exhibits more complex nonlinear behavior and poses a higher level of risk for investors than ever before. Therefore, the proposed multiscale approach to estimate VaR using a variational MD model was used to extract principal and model risk factors in multiscale domains. The risk factors were modeled linearly using the ARMA-GARCH model and nonlinear factors using the convolutional neural network to produce accurate price forecasts in the main market for crude oil. Furthermore, Omari et al. 26 combined conditional heteroscedastic models and EVT to examine the extreme tail behavior of stock indices of major economies before and during the COVID-19 pandemic using daily return data of stock market indices from 12 different countries. The study implemented a dynamic method to estimate VaR 1 day ahead with students, and VaR quantiles were estimated using the conditional EVT frameworks. The back-testing results showed that conditional EVT-based models consistently produced better 1-day VaR.
Xiang and Lin 27 proposed an unsupervised anomaly detection algorithm that combines the Gated Recurrent Unit (GRU)-based recurrent neural network (RNN) and EVT to develop a predictor framework through two-layer ensemble learning based on the GRU. The prediction errors were calculated and smoothed using the Exponentially Weighted Moving Average algorithm, while the EVT sets the anomaly threshold automatically. The results showed that the proposed detection algorithm is superior to the advanced anomaly detection approach.
This description showed that there have been several studies conducted to forecast the size of stock investment risk using the VaR method with the EVT and other methods. However, there is not much literature using EVT in combination with artificial neural networks (ANNs) or machine learning (ML). There has been no research using a combination of EVT and ML to estimate the investment risk. Therefore, this study conducted a systematic review of the stock investment risk forecasting model using the VaR hybrid method with the EVT, neural networks (NN), ANNs, and ML approaches. The purpose of this research was to collect, characterize, and analyze the investment risk estimation literature to identify the research gap in the selected literature.
Based on research gaps, the investment risk measurement model framework with a combination of EVT and ML with multivariable data input was proposed. By adopting the ML approach, the weaknesses of the VaR method for nonlinear cases and the complexity of the EVT for multivariate cases can be reduced.
It is hoped that the output of the model will produce more accurate and precise estimates of volatility in the analysis of the risk–return relationship than if using only daily return data. The study is beneficial to financial institutions, investors, brokers, financial corporations, investors, the government, and researchers.
Materials and Methods
Materials
Literature studies are activities associated with the collection, reading, and processing of library data to find theories or results of previous studies, analyze the relevance, and use them as a reference. Therefore, this study adopted the Preferred Reporting Items for Systematic Reviews and Meta-Analyses (PRISMA) due to its ability to provide clear guidelines for a systematic literature review. 28
PRISMA is a guide application normally used to evaluate and monitor the process of compiling a systematic review and meta-analysis for literature studies. 29 It is a systematic reviewer that has the ability to transparently report on the progress of study activities and previous findings over the past decade as well as to reflect on the advances in methods of identifying, selecting, assessing, and synthesizing study. 30 It is important to note that the stages involved in using PRISMA are in the form of a four-phase flowchart, which includes identification, screening, eligibility, and included studies. 31
Included studies are articles on the topic of forecasting or estimating stock investment risk under conditions of uncertainty, extremes, and nonlinear character. Some of these include the hybrid VaR methods, such as the EVT, ANNs, and ML. Moreover, the data used were articles published from 2012 to 2022 and obtained from online database sources with large repositories for academic studies including Scopus and ScienceDirect. The literature was collected by defining the eligibility criteria based on certain inclusions. The articles were searched through keywords that match the topic of this study and using the Publish or Perish software for the Scopus database and the search facility on ScienceDirect.com
Methods
The initial stage of this research is to identify the problem and determine the research objectives. Then, the PRISMA method was used for identification, screening, eligibility, and inclusion of the selected literature based on the search strategy.
Identification
The identification phase was initiated in this study with the definition of the eligibility criteria, which were based on the inclusion criteria (IC). This stage focuses on finding and selecting the literature that meets the predetermined criteria, such as inclusion, language, type of publication, and publication period.
The literature articles were identified by searching different online database sources with large repositories for academic studies and included studies in reputable international journal sources using predetermined keywords, titles, and abstracts. The articles generated from the search were transferred to the duplicate selection stage where duplicates were deleted to have just one from all sources.
Screening
Screening is the selection of articles based on the titles, abstracts, and keywords. The title is the sentence reflecting the entire content of a study with a focus on the study object, problems, methods, locations, goals, and objectives to be achieved. Meanwhile, an abstract provides key information about the background, study objectives, methods, results, conclusions, and implications of the findings; keywords are fragments of meaningful words from an article that serves to index the content. This means that these elements can be used to determine the relevance of an article to the concept being studied.
The screening was conducted manually to determine the articles that are relevant or suitable for systematic review. Subsequently, all the articles retrieved during the identification stage were read one by one, and those with titles, abstracts, and keywords that do not match the study purpose were deleted.
Eligibility
The eligibility stage was used to determine the ability of the articles to meet the IC previously defined, review the completeness of the literature, and explore the titles, abstracts, keywords, and lists of references related to the concept being studied. The process involved reading the content of the filtered articles to determine the compatibility with this study and those found not to be related were deleted. Moreover, the completeness of the literature attributes is an important factor, and the process was simplified by the availability of a DOI, a URL, and access to the full article. All the articles with access problems were subsequently deleted.
Included studies
The included studies stage focused on determining the number of articles in this study including all that passed through the identification, screening, and eligibility stages, which are considered relevant to the concept being studied. The articles were later analyzed using meta- and bibliometric analyses.
Furthermore, an analysis of the general characteristics of the literature and mathematical models of investment risk estimation in the capital market for reference in model development was performed. Research gaps were identified to fill the gaps, which would assist in developing future models. A bibliometric analysis was conducted using the VOSviewer application on the selected studies to determine the relationship between the words contained in the title, abstract, and keywords in the articles used as references. The purpose of this analysis was to identify shifts in topics and methods in the articles. Finally, the results of the study, a proposed model for estimating the investment risk in the stock market, and suggestions for future model development were reported.
Results
Study selection
The literature search was conducted in this study using the Publish or Perish 8 software and the search feature on the sciencedirect-com.web.bisu.edu.cn site, while the bibliometric analysis was conducted through the assistance of the VOSviewer software. The eligibility criteria used in the identification stage were based on the IC, and the first, IC1, includes the literature published in reputable international journals which are study articles, written in English, and sourced from online databases such as ScienceDirect and Scopus. The second, IC2, are study articles that use the EVT, NN, ANNs, and ML approaches to measure the level of stock investment risk to identify extreme values when data have high uncertainty and volatility as well as the ability to capture nonlinear relationships on high-dimensional variables.
The focus was on articles published from 2012 to 2022, and they were searched on September 22, 2022, from the aforementioned databases. The strategy adopted was selected keywords that matched the topic of this study, and these include (“value at risk” OR “VaR”) AND (“extreme value theory” OR “EVT” OR “neural network” OR “artificial neural network” OR “ANN” OR “machine learning”) AND (“stock market”). Moreover, the Boolean operator AND was used between keywords “Value at Risk” with keywords “extreme value theory,” “EVT,” “neural network,” “artificial neural network,” “ANN,” and “machine learning.” This is necessary to ensure that the literature that uses the VaR method with an EVT approach or EVT or neural network or ANNs or ML can be precisely selected.
Furthermore, the Boolean OR operator was also applied between the keywords “extreme value theory,” “EVT,” “neural network,” “artificial neural network,” “ANN,” and “machine learning” to broaden the search results. The use of the Boolean operator AND in the “stock market” keyword was to produce more specific results on the stock market only. The number of literature articles obtained using the aforementioned keywords in each database is presented in Table 1.
Search results by keyword
Table 1 shows that the number of literature articles obtained from the ScienceDirect database and Scopus database was 1184 and 93, respectively. Based on IC1, those published in a reputable international scientific journal were selected, degenerated, and put together in a file in the “.ris” format. Moreover, the systematic review steps conducted using PRISMA to obtain relevant and quality articles are illustrated in the four-phase flowchart presented in Figure 1.

PRISMA four-phase flowchart. PRISMA, Preferred Reporting Items for Systematic Reviews and Meta-Analyses.
Figure 1 describes the PRISMA four-phase flowchart starting from the first stage of identification that produced 1184 articles from both databases used, of which 149 were removed from the ScienceDirect source and 21 from the Scopus source, thereby leaving a total of 1107 articles. Moreover, it was also discovered that there were 24 duplicates that were deleted to have a total of 1083.
The manual selection process was subsequently conducted by studying the literature article one by one in its entirety based on the title and abstract with a focus on the suitability of the topic and purpose. A total of 847 articles were found to be irrelevant to the concepts being studied and were deleted, leaving 236 articles.
The eligibility stage was used to study the literature one by one as a whole to determine the completeness, suitability of the topic and purpose, as well as the methodology used while the screening stage focused on reading the abstract, keywords used, and the content of the article. The literature with suitable topics and applied VaR with different other approaches was subsequently selected, and this led to the selection of 90 articles and the removal of 146 articles.
The included studies stage was used to select the relevant articles after going through the eligibility stage, and this means that a total of 90 articles were available for meta-analysis. The articles were analyzed to determine their characteristics and later used for bibliometric analysis.
Characteristics
The data selection process, as illustrated in Figure 1, showed that 90 articles published in different years were obtained at the included studies stage, as indicated in Table 2.
Literature publication year
Table 2 shows the number of articles related to the investment risk estimation and the year of publication. The article index is the number of selected articles listed in this reference and observed to range from 32 to 121.
Figure 2 shows the number of articles published in the 2012–2022 period. In 2012, six articles were published; in 2013, it was the time when the number of articles published was the highest in this period, as many as 19 articles, and decreased to 5 articles in 2016. However, the number rose again to 12 articles in 2020 and declined again to 2 articles in 2022. This is the smallest number published in this period.

The number of article publications.
Reference is a collection of information related to the author, title, name of the publisher, date and year of publication, and pages of the scientific works. Its main purpose is to show the readers that the content of scientific works is based on true, reliable, and strong sources as well as to avoid plagiarism. The “cited” is the number of accumulated scientific works used as a reference. It shows the level of acceptance for science works by the wider community as well as an overview of their quality and study ideas. Moreover, articles that are quoted more are generally believed to be more complete, quality, and scientific to be worthy of being used as a reference. The age of publication also determines the number of citations but generally takes time for the publication to be cited. The 15 most cited articles are visually presented in Figure 3.

Fifteen articles with the most citations.
Figure 3 shows the 15 articles with the most citations. Article 69 written by Righi and Ceretta got the most citations. This article cited 86 citations. This article was published in the Journal of Economics and Business. In the second place is the article 38 written by Abad and Benito; this article was cited 85 times and was published in the journal Mathematics and Computers in Simulation. In the third place is the article 43 written by Singh et al., this article was cited 81 times and was published in the journal Mathematics and Computers in Simulation. Furthermore, in the 15th position with 47 citations is the article 46 written by Berger. This article was published in the journal International Economics.
Figure 3 shows that the article 91 written by Sahamkhadam et al. published in the International Journal of Forecasting has the highest Cites Per Year (CPY) score article, with a value of 18.5. In the second place with a CPY score of 12.3 is the article 69 written by Righi and Ceretta. Then, in the third position is the article 84 written by Muteba Mwamba et al. This article was published in the Pacific-Basin Finance Journal and received a CPY score of 10.6. It is important to note that the CPY score represents the cites/age of the article.
The origin country of the first author was also analyzed, and the findings are visualized in Figure 4.

Country of origin of the first author.
Figure 4 shows the country of origin of the first author in this research literature. The first position is China with the first 20 authors. The second position is India with six authors, and then, the third position is Australia and Taiwan with five authors each. This shows that this topic is very interesting to be studied by writers from around the world.
Visualizing bibliometric networks
The visualizing bibliometric networks (VBN) stage involved the application of the VOSviewer software for bibliometric analysis. The analysis focuses on a series of bibliographic data descriptions and investigations from the reference lists used in writing a new article. The benefit is to study the conceptual and nonconceptual structure of the literature list clearly and systematically. 122 Moreover, visualization is normally applied to determine the relationship between the data and the words contained in the selected articles, after which the results are to be processed to map the topics in those articles. 123 The topic mapping conducted in this study through VBN is presented in Figure 5.

Visualizing bibliometric networks.
Figure 5 shows that the VBN is divided into four clusters, and each is distinguished by color. Clusters 1, 2, 3, and 4 represent red, green, blue, and dark green, respectively. Moreover, the size of the circle on the VBN represents the frequency of a word in the relevant literature. A larger circle indicates a higher frequency. In cluster one, the dominant words are model, value, VaR, approach, shortfall, volatility, GARCH, historical simulation (HS), daily return, back-testing. This first cluster generally describes the investment risk estimation model using the VaR method with the GARCH, HS, and EVT approaches. The data used are the daily return. It is hoped that by combining several methods, it will be able to capture volatility, shortfalls, and extreme values in the data distribution, as well as produce good model outputs. Model validation uses the back-testing method.
The dominant words in cluster 2 with a green background are extreme value theory, EVT, generalized Pareto distribution, data, threshold, predict, and uncertainty. The words that appear dominant in cluster 2 describe the EVT approach that is dominantly used in predicting risk measures in conditions of uncertainty, namely the generalized Pareto distribution method. In this method, the extreme value is the value that exceeds the threshold.
While the dominant words in cluster 3 in blue are risk, return, portfolio, stock, and the Conditional Value-at-Risk (CVaR). In addition to VaR, the CVaR method is also recommended for calculating market or portfolio risk because it can capture tail risk.
While the dominant words in cluster 4 with dark green circle color are stock market, distribution, ability, fat tail, and risk management. Words in this cluster are related to words in other clusters, such as the word stock market is closely related to the word VaR in cluster 1, extreme value theory in cluster 2, and risk in cluster 3. Figure 6 shows a visualization of the association of VaR words with dominant words in other clusters.

Visualization of the relationship of VaR items and other items. VaR, Value-at-Risk.
From Figure 6, it can be seen that the investment risk estimation models using the VaR approach only use daily return data as the input model. In the era of the modern stock market, stock fluctuations are strongly influenced by many related factors and variables. Stock fluctuation data are not only based on daily data but are high-frequency data based on monthly, weekly, daily, hour, minute, and second frequency which must be observed. It was discovered from the chart mapping that several studies have used the VaR model with the EVT, GARCH family, Variance–Covariance (VC), and HS approach to measure the investment risk, while only a very few calculated VaR using the NN, ANNs, and ML approaches as indicated by their non-appearance in the VBN.
The absence of these words is associated with their small frequency in the selected literature. This means that there is a lack of study on hybrid methods of forecasting stock investment risk during uncertainty and high volatility conditions such as the combination of EVT with NN, ANNs, and ML. Adding ML technology to the investment risk estimation model makes the model performance better, and the model can support high-frequency data for model input data so that the model is more flexible to extreme market fluctuations.
Discussion
Risk is defined in terms of the probability of deviation from the objectives, and this can be stated to be very close to the definition of standard deviation in statistics. It is important to note that the variance of a random variable is the deviation of each data from its mean and divided by the mean, while the standard deviation is the square root of the variance. The financial sector often refers to the standard deviation as volatility, and this means that it is not the same as a risk, even though their definitions are very close. The standard deviation only describes the deviation from the objective and looks like an average. Moreover, two random variables can have the same standard deviation but very different return profiles. This is the reason the investment management risk needs to consider other aspects of the expected deviation distribution, not only the standard deviation.
When the market is in a state of uncertainty and high volatility, there are several extreme values contained in the data distribution, and this means that the level of risk cannot be measured based on only the standard deviation. In this condition, the data are not normally distributed, there is a nonlinear relationship between the variables, and the data distribution also contains extreme values.
EVT approach
The global financial crisis of 2007–2008 124 showed that the estimation of VaR using only distribution normality assumptions is less accurate. This is because they ignore dynamic risk management parameters to ensure minimum losses for decision-making in fast-moving stock variations. After the financial crisis, the stock market continued to fluctuate, along with events that led to extremes in the distribution of data. Meanwhile, the level of risk containing extreme values in the data distribution can be measured by combining the VaR method with the EVT approach during the uncertain and volatile stock market to capture heavy tail patterns in the data distribution and detect the extreme values.
EVT is a mathematical model that examines the deviation of data from the average value in the probability distribution to detect and study the heavy tail pattern of the distribution with extreme values. 125 It is normally used to model extreme events. 126 Moreover, extreme data are defined as data with a low frequency or rare occurrence but have a very large effect. The lack of available data in modeling makes the probability of extreme events difficult to identify. 127
The two methods that can be used to identify and detect extreme value movements include block maxima (BM) and peaks over threshold (POT).
128
The BM method uses the maximum value in the data based on a certain block or period, whereas the POT method uses values above a threshold. The basis of the EVT model focuses on the statistical behavior.
129
where
Theorem 1: If there exist sequences of constants
where G is a nondegenerate distribution function, and then, G belongs to one of the following type families.
for parameters
The three family types of limits that arise in Theorem 1 have distinct forms of behavior, corresponding to the different forms of tail behavior for the distribution function F of the Xi. These three types provide very different representations of extreme value behavior. In practice, only one of the three types is applied and then estimates the relevant parameters of the distribution. Therefore, the right method is needed to choose the most common type according to existing data. Finally, for this reason, a better analysis is offered by combining the three types into one model family that has a different distribution function of form, for a nondegenerate distribution function G, then G is the generalized extreme value (GEV) family of distributions. It also applies the Fisher–Tippett theorem on the extreme value sample data obtained based on the GEV distribution with a cumulative distribution function (CDF).35,74,83,87
where μ = location parameters,
In BM, the GEV parameter estimation uses the maximum likelihood estimation (MLE) method
130
to produce the location parameter values (
The BM method identifies extreme values through the maximum value of observational data grouped in a certain block or period. This approach yields only one extreme value in each block. This method requires large amounts of data, and the process of identifying extreme values tends to be inefficient. The reason is that every single block selects only one extreme data and ignores many other data.
The difficulty implicit in any extreme value analysis is a finite number data for model estimation. A model that is more efficient in using data is POT. The POT method uses more efficient data. The POT method identifies extreme data behavior patterns based on thresholds. Data that exceed the threshold are an extreme value. Let
for
Theorem 2 (Balkema and de Haan; Pickands):131,132 For a large class of underlying distribution function F, and large u, Fu is well approximated by the generalized Pareto distribution (GPD).
where Fu is excess distribution function, u is threshold, xF is the right endpoint of the underlying distribution F, and
where
The POT method is a way of identifying extreme data behavior patterns by determining the extreme threshold value. It is important to reiterate that the data that exceed the threshold are an extreme value. Meanwhile, the threshold value (u) is usually determined as optimally as possible to produce a minimum error rate toward having a parameter with a small bias and a small variance value. This is necessary because a threshold set too low normally leads to parameter estimates with a large bias, while those set overly high usually produce small extreme values obtained to the extent of having a large enough variance when estimating the model. This means that an appropriate method is needed in determining the threshold value to produce a small bias and have sufficient variance data. For practicality and ease of use, this can be achieved using the mean residual life plot or the percentage methods.
In the POT method, the GPD can be estimated using MLE to obtain the scale parameters (
then, the approximation
similar
similar
The high quantile estimator, the VaR, for
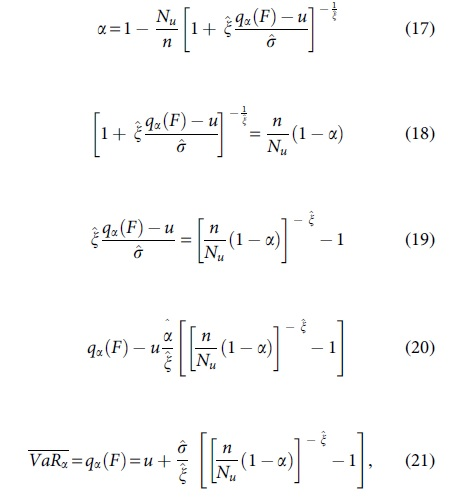
where  is the scale parameter, and
  is the shape parameter.
Relevant literature showed that risks estimated without considering the heavy tail pattern in the data distribution results usually produce less accurate forecasts. It was also discovered that the application of the Hybrid VaR method generally results in a more accurate forecast for investment risk estimation compared with models that ignore extreme data. The studies that focus on this hybrid model using the EVT approach describe the ability of the EVT to estimate the investment risk when the data contain extreme values due to high uncertainty and volatility, as listed in Table 3.
Investment risk estimation with hybrid methodology
AR-GARCH-t, autoregressive-GARCH-student-t; ARMA-GARCH, Autoregressive Moving Average–Generalized Autoregressive Conditional Heteroskedasticity; CVaR, conditional value-at-risk; EGARCH, exponential generalized autoregressive conditional heteroscedastic; ES, expected shortfall; EV, extreme value; EVT, extreme value theory; GARCH, Generalized Autoregressive Conditional Heteroskedasticity; GMV, global minimum variance; GPD, generalized Pareto distribution; HS, historical simulation; MC, Monte Carlo; Min-CVaR, minimum conditional value-at-risk; VaR, Value-at-Risk.
Table 3 shows that the estimation of investment risk using hybrid models with EVT, HS, Monte Carlo (MC), VC, and GARCH family approach provides more accurate models than methods that use distribution normality assumptions or those that ignore heavy tail behavior in data distributions when uncertainty and volatility are high. On average, the use of the VaR model with a hybrid approach is always superior in forecasting daily investment risk. It is also important to note that the study generally compares the Risk Metrics and GARCH methods with variations that do not consider heavy tail behavior in the distribution of data.
The VaR hybrid models that involve the combination of an EVT with BM, POT, HS, MC, VC, GARCH family, NN, ANNs, and ML methods in investment risk estimation are presented in Table 4.
Comparison of the main methods
ANN, artificial neural network; BM, block maxima; ML, machine learning; NN, neural networks; POT, peaks over threshold; VC, variance–covariance.
Table 4 shows that 64 articles used the main EVT method, and it was also observed that the researchers prefer the POT 42 with a total of 50 articles compared with only 7 for the BM as well as 7 that combined the 2. The main reason is that the POT uses available data more efficiently than the BM, which requires larger data to produce more accurate VaR estimation. 43 This means that the application of the BM and POT methods depends on the availability of data. The BM can be applied to fairly large data sets with non-overlapping block periods because it is easy to implement and provides more accurate results. Meanwhile, the POT has the advantage of modeling the available data more efficiently and can be more effective when the data set is limited.
The other methods apart from EVT and ANNs were used in 20 articles with most observed to generally include the GARCH family, HS, MCS, and VC. The VaR can be calculated using three methods, which are the parametric VC, HS, and MCS. The VC estimates VaR using parameters such as volatility, correlation, delta, and gamma and is considered accurate for linear patterns but less accurate for nonlinear patterns. Meanwhile, the MCS assumes that the data are normally distributed and have no limitations for the performance of simulations because more performance produces better results. This method is simulated by generating a random number to estimate the VaR value. The HS is a method that overrides normality assumptions and assumes that the conditions for changes in market prices today to tomorrow are the same as those for past changes. It is the simplest method because it only uses historical data.
The other approaches normally used to estimate the investment risks are ANNs, and ML, which are beneficial due to their ability to describe both linear and nonlinear models. These methods can produce estimates with high accuracy for nonlinear systems because they can detect nonlinear relationships between variables.
The ANN approaches and ML-based
ANNs is inspired by the way neurons in the human brain work to process large amounts of information using data sent by the human senses. The process is usually conducted by neurons, which act on the electrical signals passing through them and apply flip-flop logic such as the opening and closing of gates for signals to be transmitted. The term “artificial” is used because this neural network is implemented using a computer program that can complete several calculation processes during the learning process. The concept of a nonlinear model of neurons is illustrated in Figure 7. 134
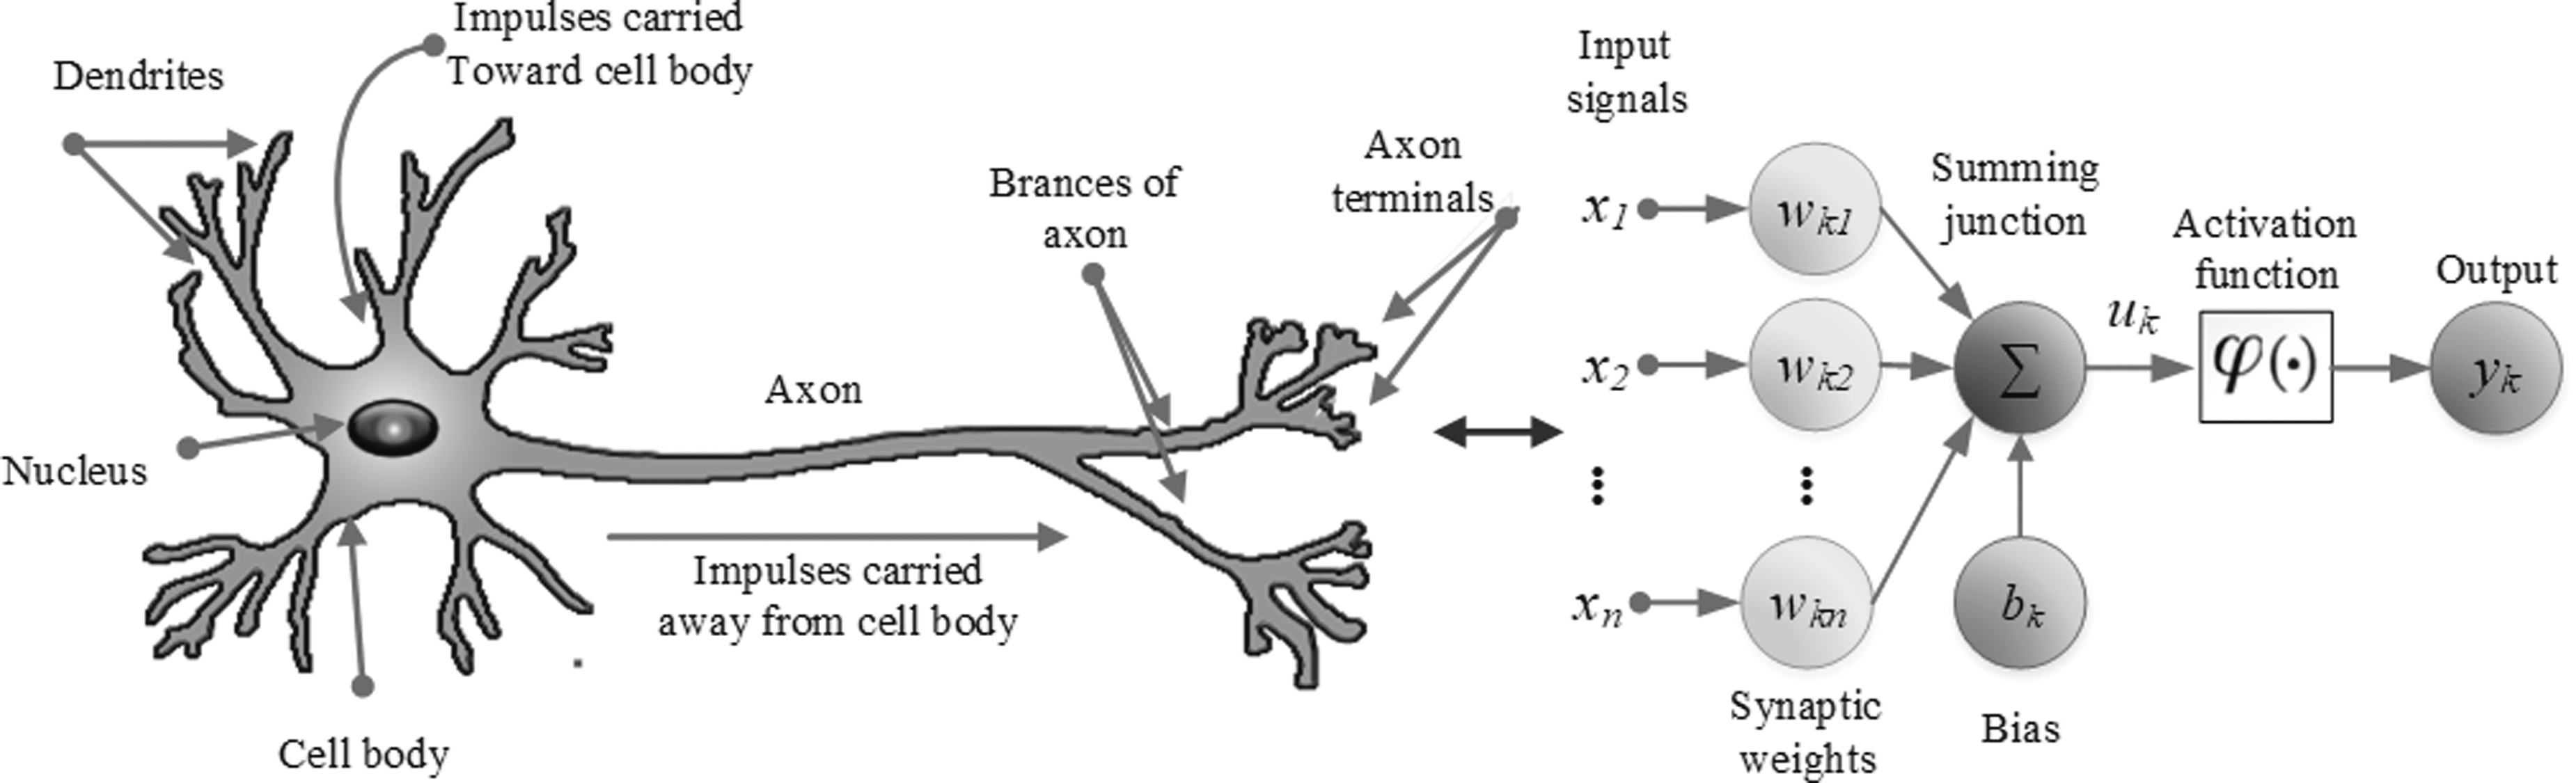
The concept of a nonlinear model of neurons.
The concept of ML was first published around 1920 by mathematical scientists, Adrien Marie Legendre, Thomas Bayes, and Andre Markov. They put forward the basics of ML and its concepts as the science of developing algorithms and mathematical models with the ability to study existing data and carry out certain processes according to the data they learn. The ML algorithm processes large amounts of historical data and identifies patterns with minimum errors to produce a model capable of predicting more accurate results.
ML is an algorithm used in the learning process, where the system performs learning based on data. It is important to note that the success factor of the neural network depends on the training network. 135 Moreover, the selection of an ML algorithm is based on the purpose or type of problem, computational resources, and the nature of the data. It is grouped into three, which include the supervised, unsupervised, and reinforcement learning algorithms. 136
One of the supervised types is ANNs, and those with multiple layers usually have one or more layers located between the output and input. These networks have one or more hidden layers, known as multilayer networks, where each layer of nodes receives input from the previous. Moreover, the output of the nodes in one layer is the input to the next, and the inputs to each node are combined using a weighted linear combination. ANNs in mathematical terms can be written with Equation (22).
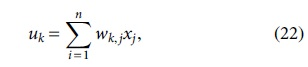
where
where yk is the output signal of the neuron,
The value of parameters
In recent years, ML has attracted increasing popularity in modern finance, and the rapid development of deep learning can make classifiers more powerful to solve nonlinear problems. 137 Modern investors face the problem of high-dimensional predictions, and thousands of observable variables are discovered to be potentially relevant to forecasting. 138 The emergence of new technologies and the widespread adoption of artificial intelligence (AI) techniques promise to make everyday tasks much smarter as well as to predict and anticipate changes. 139 ML is a branch of AI, mathematics, and computer science that focuses on using data and algorithms to imitate the way humans learn and gradually increase their accuracy.
The ML algorithm is trained through the use of mathematical and statistical operations to make classifications or predictions toward forecasting the market based on the nonlinear relationships between variables. This method demonstrates a remarkable ability to approach nonlinear systems and extract meaningful features from high-dimensional data. It also has the ability to assist or replace traditional forecasting methods due to its capabilities. 140 The five studies conducted on investment risk estimation models using the NN, ANNs, and ML approaches are presented in Table 5.
Study on investment risk estimation using artificial neural network approaches and machine learning-based
ARMA-APARCH, autoregressive moving average-asymmetric power ARCH; BR-RBFN, Bayesian Regularized-Radial Basis Function Network; CAViaR, conditional autoregressive value at risk; MAD, mean absolute deviation; PCC, pair-copula constructions; QARNN, quantile autoregression neural network; QRNN, quantile regress neural network.
Table 5 summarizes several studies on the topic of investment estimation when the stock market is influenced by the global sentiment that is full of uncertainty. This condition produces linear and nonlinear systems. Moreover, there is a problem of variable nonlinear relationships and high-dimensional predictions with multiple variables in forecasting investment risk. The long-term and short-term market volatility combined with the influence of linear and nonlinear complex information also makes the prediction of stock prices very important. 101 It was discovered that ANNs and ML have an excellent ability to approach nonlinear systems and extract meaningful features from high-dimensional data to produce good forecasting accuracy. 141
The models with NN, ANNs, and ML approaches are generally better than deterministic formulations in terms of capturing linear and nonlinear patterns. They also have the ability to explore nonlinear patterns in financial time series and are better at evaluating VaR than several competing models, including Risk Metrics, GARCH-EVT, autoregressive moving average-asymmetric power ARCH, conditional autoregressive value at risk, pair-copula constructions, and QRNN. 79
From the analysis described previously, there are several identified research gaps. One of them is the model that only uses daily returns as input data. The POT method with the GPD approach is more widely used than the BM method. The EVT approach will be more difficult in multivariate cases. Stock fluctuations are influenced by many factors, such as exchange rates, world crude oil prices, pandemics, social and political issues, and geopolitical issues. These variables must be considered in building a risk estimation model in the stock market. With the advancement and integration of computers in financial markets, and the rapid development of information technology, data sets containing detailed information about market transactions are becoming commonplace. High-frequency data generally refer to data that are collected at a very fast rate. Data collection every time new information arrives is carried out based on days, hours, minutes, and even seconds. Therefore, the EVT approach VaR method will be complicated in this case.
There needs to be a method that bridges between reliable models in univariate cases but requires multivariate data and high-frequency data. AI technology with the ML approach can handle multivariate and nonlinear cases. Multivariate data are processed using the ML approach to produce the output of a new univariate data set. The EVT approach with the POT method will identify the extreme values of the distribution of this data set to get VaR. Then, the CVaR can be calculated. CVaR is the conditional expected loss under the assumption that it surpasses VaR. The CVaR was recommended for calculating market, credit, and operational risk by the Basel Committee on Banking Supervision in May 2012. This model framework is a complementary combination of EVT and ML, using multivariate and high-frequency data. The goal is to produce an accurate and flexible estimated risk value against extreme changes and shocks in the stock market.
Conclusions
This study conducted a systematic literature review of the stock investment risk estimation model using the VaR hybrid method with the EVT, NN, ANNs, and ML approaches. The purpose of this research was to collect, characterize, and analyze the investment risk estimation literature to identify the research gap in the selected literature. The bibliometric analysis conducted in this study quantitatively and qualitatively described the literature based on the year of publication, number of citations, and origin country of the first author. The results were processed using the VOSviewer software to determine the topic mapping in the articles relevant to this study. This series of processes provides insight into the scientific study to assist in generating descriptions, comparisons, research gaps, and the results on investment risk forecasting models using the VaR hybrid method with different approaches.
The VBN results show that the VaR hybrid model with the EVT approach, the GARCH family, and HS is often used to estimate the investment risk. On the contrary, the application of ML-based investment risk estimation models is relatively low, and there has been no research using a combination of EVT and ML to estimate the investment risk. In general, existing models only use daily returns as input models, ignoring other variables that affect stock fluctuations.
Compared with the BM method for identifying extreme values, the POT method using GPD to model the tail of the distribution is more preferred. The main reason is that the POT method uses data more efficiently than the BM method, which requires larger data to produce a more accurate VaR estimate. The BM method loses a lot of data when identifying extreme values because only one data are selected in each block or period.
Research gaps are identified as a reference in the development of a model framework for estimating the investment risk in the stock market by combining EVT with ML. The input of this model is multivariable data and uses high-frequency data. Variables that affect stock fluctuations are considered in the estimation of investment risk. The ML approach is capable of handling multivariable and high-frequency data. By adopting the ML approach, the weaknesses of the VaR method for nonlinear cases and the complexity of the EVT for multivariate cases can be reduced.
Footnotes
Authors' Contributions
M.M.: Conceptualization (equal), methodology (equal), writing—original draft (lead), software (lead). Sukono: Supervision (lead), conceptualization (lead), methodology (lead), formal analysis (lead), writing—review and editing (lead). H.N.: Data curation (lead), conceptualization (supporting), methodology (equal), formal analysis (equal), writing—review and editing (equal). N.M.: Validation (lead), methodology (equal), formal analysis (equal), writing—review and editing (supporting), conceptualization (supporting).
Author Disclosure Statement
The authors declared no conflict of interest.
Funding Information
The authors received no financial support for the research.