
Abstract
Human genetic studies are using an increasing number of biobanked DNA samples, which require consistent measurements of DNA quantity and purity between multicenters or multilaboratories. In an attempt to standardize DNA quantitation protocols, a DNA quantitation project was performed, in which 16 technicians from 11 laboratories participated in measuring optical density (A260, A280, A230) of multiple DNA samples (N = 35) of known concentrations. We analyzed variations in the measurement of DNA quantity and purity and found that the mean interoperator coefficients of variation percentage for A260, A260/A280, and A260/A230 values among individuals were 21.9%, 7.4%, and 24.7%, respectively. In contrast, the mean intra-operator coefficients of variation percentage for A260, A260/A280, and A260/A230 values were 9.9%, 1.7%, and 8.3%, respectively. The variability in A260/A230 determination was much more sensitive to the method of DNA quantitation and the technical skill of the individual than those of A260 and A260/A280. In addition, a concentration of DNA of >100 ng/μL was found to reduce the variability of DNA quantity (A260) and purity (A260/A280 and A260/A230 ratios) indexes. This work emphasizes the need for standardization of DNA quantitation protocols for multicenter DNA work, as well as the importance of training and education of technicians at these centers.
Introduction
These large-scale research studies involved collaboration with multicenters or multilaboratories,1–3 which require consistency of DNA quantitation between laboratories. Some of these studies reported variability in DNA quantitation,4–7 a problem that could lead to inaccurate interpretation and integration of results.5,8,9 In the case of short tandem repeat analysis, the inaccuracy of DNA quantitation was related to signal variability and certain short tandem repeat measurement abnormalities.5,9 With the importance of consistent DNA quantitation increasing, DNA quantitation projects have been initiated by several biobanks, including UK DNA Banking Network and the Center for Integrated Genomic Medical Research.10–12
The routine measurement of DNA quantity or quality is usually performed by the comparative fluorescent gel method using ethidium bromide or Hoechest 33258 dye, UV absorbance spectroscopy, or instrumental fluorescent methods. Each method has a practical limit for quantifying DNA. Ethidium bromide and Hoechest 33258 dye are unsuitable for measuring low DNA concentrations 13 and fluorescent methods using PicoGreen are used in the measurement of dsDNA but cannot estimate the contamination of DNA by protein, phenol, or organic compounds.14,15 UV absorbance spectroscopy cannot distinguish dsDNA and ssDNA. In addition, the particular instrument used for different technologies can cause variability in DNA quantitation. 7 Among these DNA quantitation methods, UV absorbance spectroscopy is most simply and widely used in laboratories to determine the DNA quantity and quality based on A260, A260/A280, and A260/A230 measurements.
The National Biobank of Korea has collected human biological samples such as whole blood, serum, plasma, urine, and genomic DNA since 2001. Recently, the National Biobank of Korea was reorganized to be a central biobank to support 13 regional biobanks, which were established in medical university hospitals. To provide human biological samples of high quality, the National Biobank of Korea has invested in the ongoing development of the quality control and quality assurance programs and standard operating procedures. For this purpose, our study surveyed the variability in measurements of DNA purity and quantity by spectrophotometry between biobanks and commercial laboratories in Korea. We attempted to determine those factors important for consistency in the quantitation of DNA between laboratories. In this study, we showed that the variability of A260/A230 was more sensitive to the DNA quantitation method than those of A260 and A260/A280, and such variability of the DNA quantity and purity indexes can be reduced in DNA samples of >100 ng/μL DNA concentration. Thus, this work would help expand the knowledge of DNA quality control for multicenter collaboration.
Materials and Methods
DNA samples
DNA samples were extracted from Epstein-Barr virus (EBV) transformed B lymphoblastoid cell lines at the National Biobank of Korea. Samples were extracted using the Puregene genomic DNA purification kit (Qiagen), and the extracted genomic DNA was dissolved in Puregene hydration solution (Qiagen) and then diluted with the same to give concentrations of 10–500 ng/μL. The diluted DNA samples were dispensed in 1.5-mL microcentrifuge tubes to a volume of 20 μL. These samples were stored at −20°C until shipped.
Experimental design
Test sets of 35 DNA samples ranging in concentration from 10 to 500 ng/μL were prepared. To assess intra-individual reproducibility (within the same individual), 11 DNA samples in duplicate were included in the test set. The test sets, including 1 mL of hydration solution for blanks, were shipped on dry ice to each participating laboratory. The samples were thawed at 4°C overnight and then A260, A260/A280, and A260/A230 were measured 3 times. All but one laboratory used the NanoDrop (Thermo Scientific) kit for DNA quantitation, and one laboratory used a DU730 Life Science UV/Vis Spectrophotometer (Beckman Coulter). For DNA quantitation, undiluted DNA samples (1–2 μL) were directly applied to NanoDrop, whereas diluted DNA samples (1:100) were used in the DU730 spectrophotometer. The laboratories were allowed to use their own standard operating procedure.
Study participants
In total, 16 individuals from 11 different institutions participated in the DNA quantitation project. Participating institutions were grouped into group I (2 commercial genotyping service providers), group II (2 DNA extraction service providers), group III [6 regional biobanks participating in the Korea Biobank Network (KBN biobanks)], and group IV (National Biobank of Korea) (Table 1).
Data analysis
The variability in the estimation of A260, A260/A280, and A260/A230 was expressed as the coefficient of variation (CV), which is calculated as CV% = (standard deviation/mean) × 100. The assessment of variation for all samples of each participant was expressed as a standard deviation index (SDI), which is calculated as SDI = (the measured value of each participant – mean of total value)/standard deviation of total value. When SDI = 0, the measured value is identical to the mean of total value. Thus, when SDI was between 1 and −1, the measurement was determined to be acceptable. We also compared the nominal value with the measured value by the method described by Brown (2009), that is, R =measured value/nominal value. When R = 1, the measured value is equal to the nominal value.
Results
Interoperator variability
All participating institutions used absorption spectroscopy to measure the DNA quantity and purity (Table 1). Interoperator variability in DNA quantitation was assessed in 3 different ways: CV%, SDI, and nominal value. The overall mean CV% for the 35 DNA samples among 16 individuals was 21.9% for A260, 7.4% for the A260/A280 ratio, and 24.7% for the A260/A230 ratio. The A260 values indicating DNA concentration and the A260/A280 values indicating DNA purity showed lower interoperator variability than the A260/A230 values, as an alternate index of DNA purity.
The SDI for the analysis of the 35 DNA samples was calculated to graphically depict interoperator variability in DNA quantitation. As shown in Fig. 1, participants 7 and 11 showed higher variability in the determination of A260 and A260/A280 values than the other participants, whereas most participants, except participants 1, 6, 7, and 11, demonstrated considerably lower variability in their determinations of A260/A230 ratios. Interestingly, participant 7 performed DNA quantitation using traditional UV/Vis spectrophotometry rather than the NanoDrop instrument.
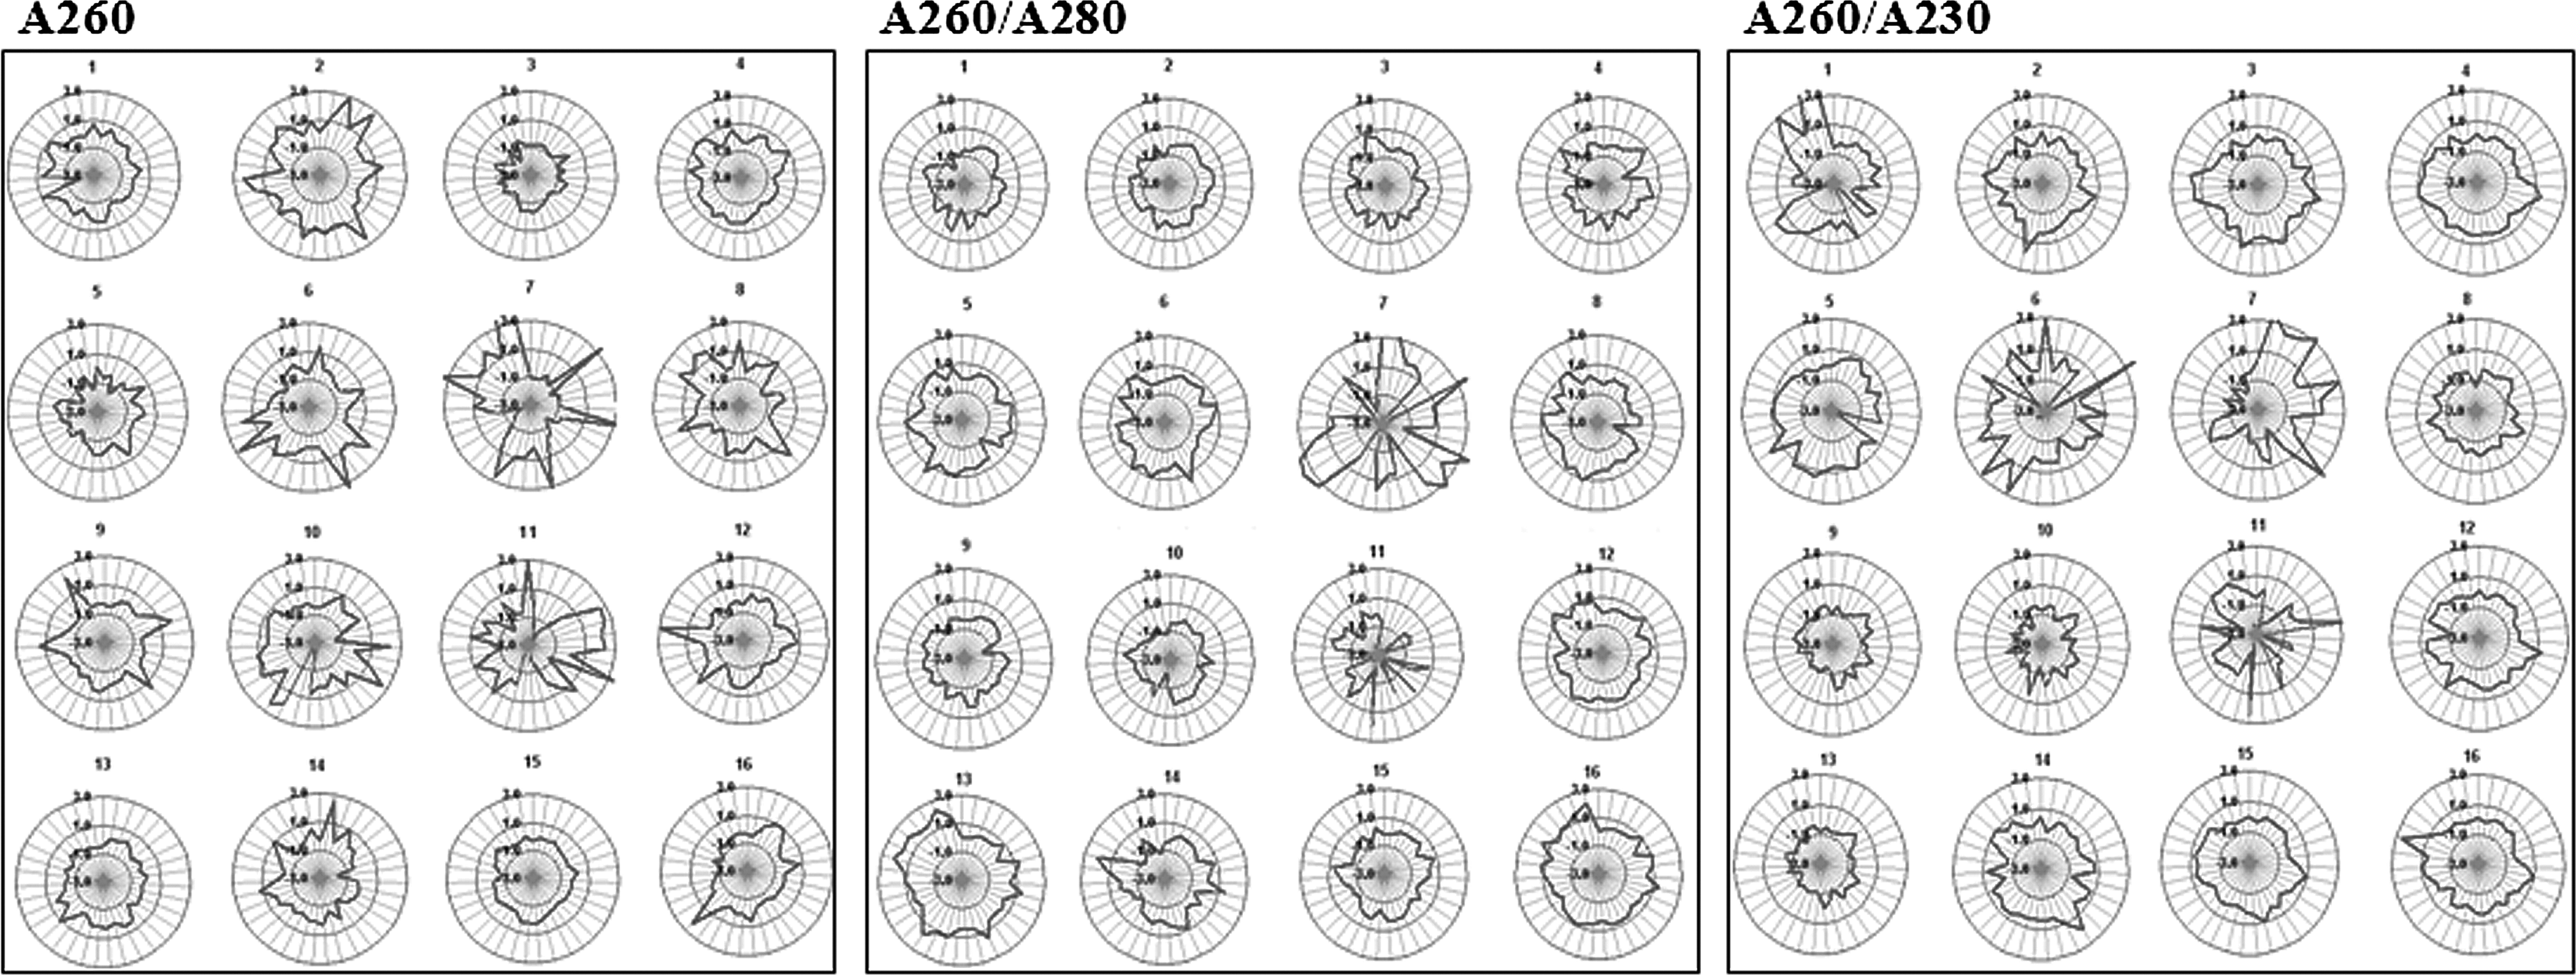
Interoperator variability of DNA measurements by SDI among individuals (N = 16). When SDI is zero, the measured value is identical to the mean of participant individuals. When SDI is between 1 and −1, the measurement is generally considered to show low variability among the tests. SDI, standard deviation index.
According to the nominal value approach (Fig. 2), participant 7 demonstrated the highest variability in A260, A260/A280, and A260/A230 calculations among individuals. Interestingly, greater variability in A260/A230 values for the 35 DNA samples was observed with participants 1 and 6, who both used the same model of instrument, the NanoDrop ND-8000, suggesting that A260/A230 may be more sensitive to the NanoDrop model than A260 and A260/A280.
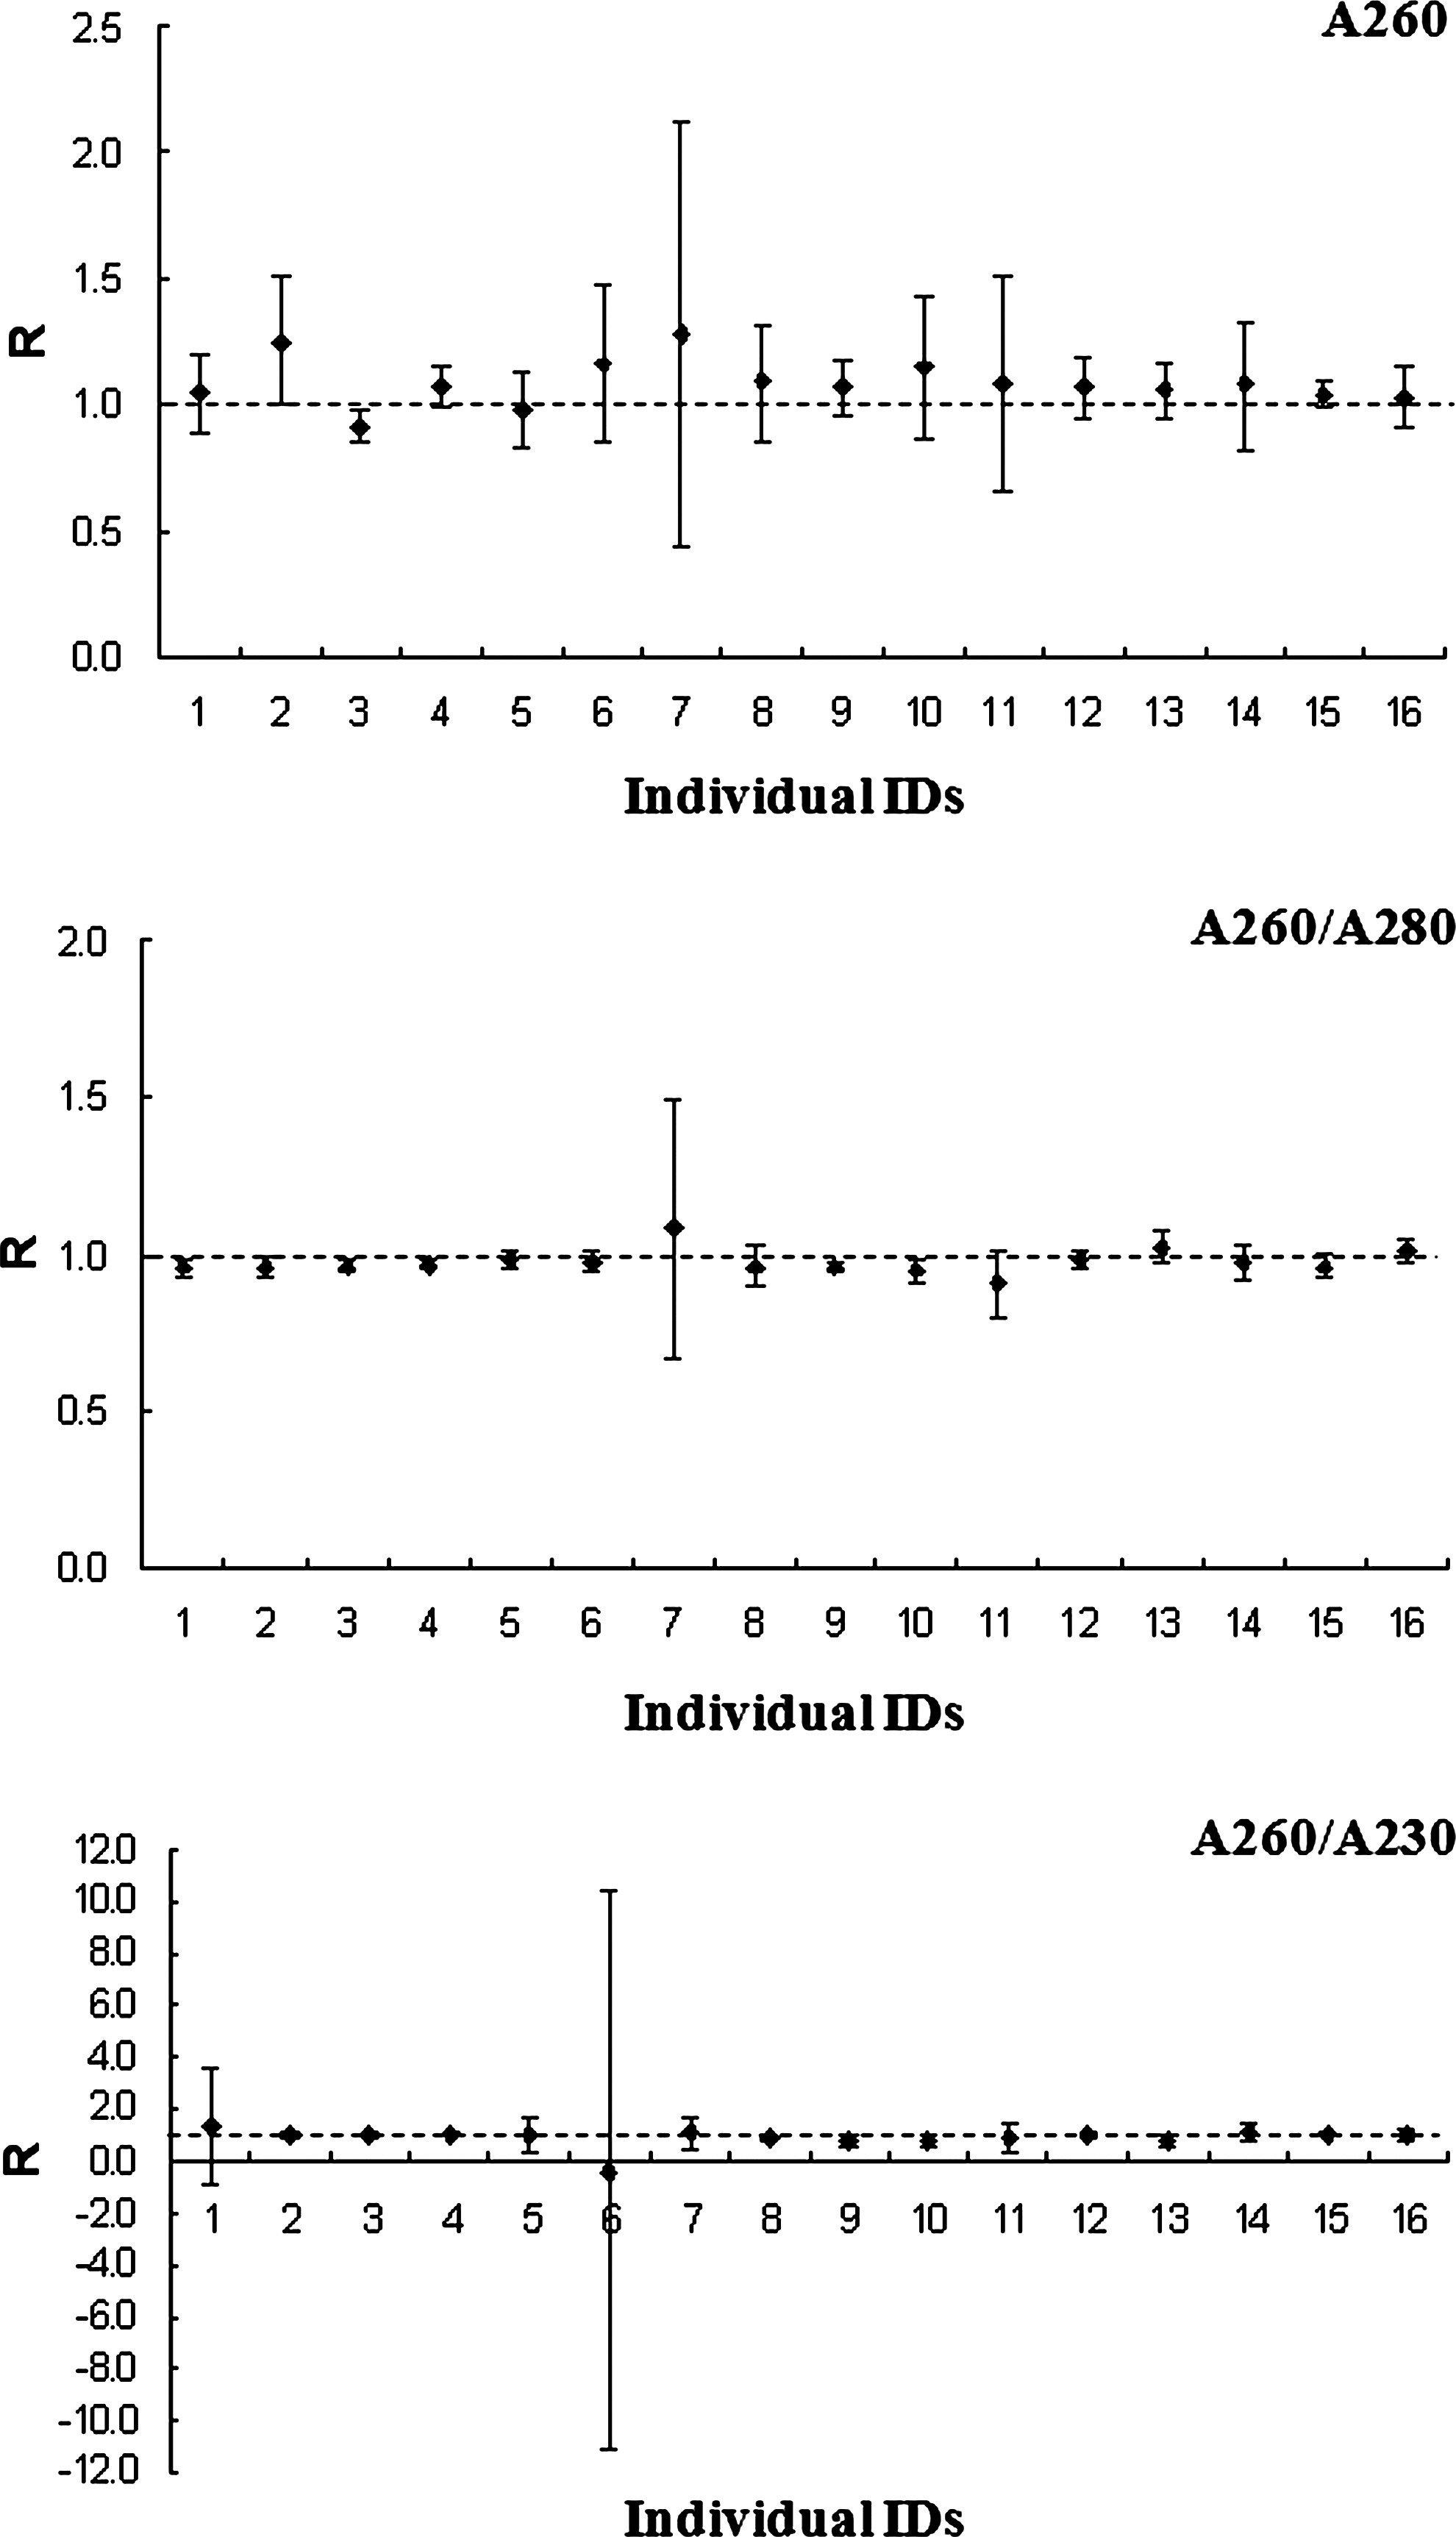
Interoperator variability of DNA measurements by nominal value (R). Note individual 7, who used a different instrument than the other individuals for DNA quantitation.
Next, the variability of DNA quantitation was assessed among 4 groups of laboratories. Most participating laboratories represented <10% of the mean CV% for A260 and A260/A280 values for the 35 DNA samples. However, group III (KBN biobanks) represented 33.1% and 14.1% of the mean CV% for the A260 and A260/A280 values, respectively. In contrast, a high mean CV% of A260/A230 was observed in all the groups (Table 2).
One-way analysis of variance was used to compare difference of the mean CV% between groups.
The mean CV% among groups is significantly different (P value < 0.01).
The mean CV% among groups is not significantly different.
CV%, coefficients of variation percentage.
The optimal concentration for DNA quantitation
Next, we sought to find the optimal DNA concentration that would give the least variability in the DNA quantity and purity indexes. The CV% of A260, A260/A280, and A260/A230 was compared among 10 individuals from 3 groups (groups I, II, and IV), excluding group III, which demonstrated the highest variability. The other groups (10 participants in 5 laboratories) were assessed to determine the variability of all DNA measurements (Fig. 3). The mean CV% of the A260 values was 9.23% for all DNA concentrations tested, suggesting little effect of DNA concentration on the variability of A260 measurements. In contrast, the CV% of A260/280 and A260/A230 was higher at <30 and 70 ng/μL, respectively, suggesting high variability of DNA measurements at lower concentrations of DNA. This result suggests that DNA samples should be quantitated at >100 ng/μL to reduce the variability of DNA measurements.
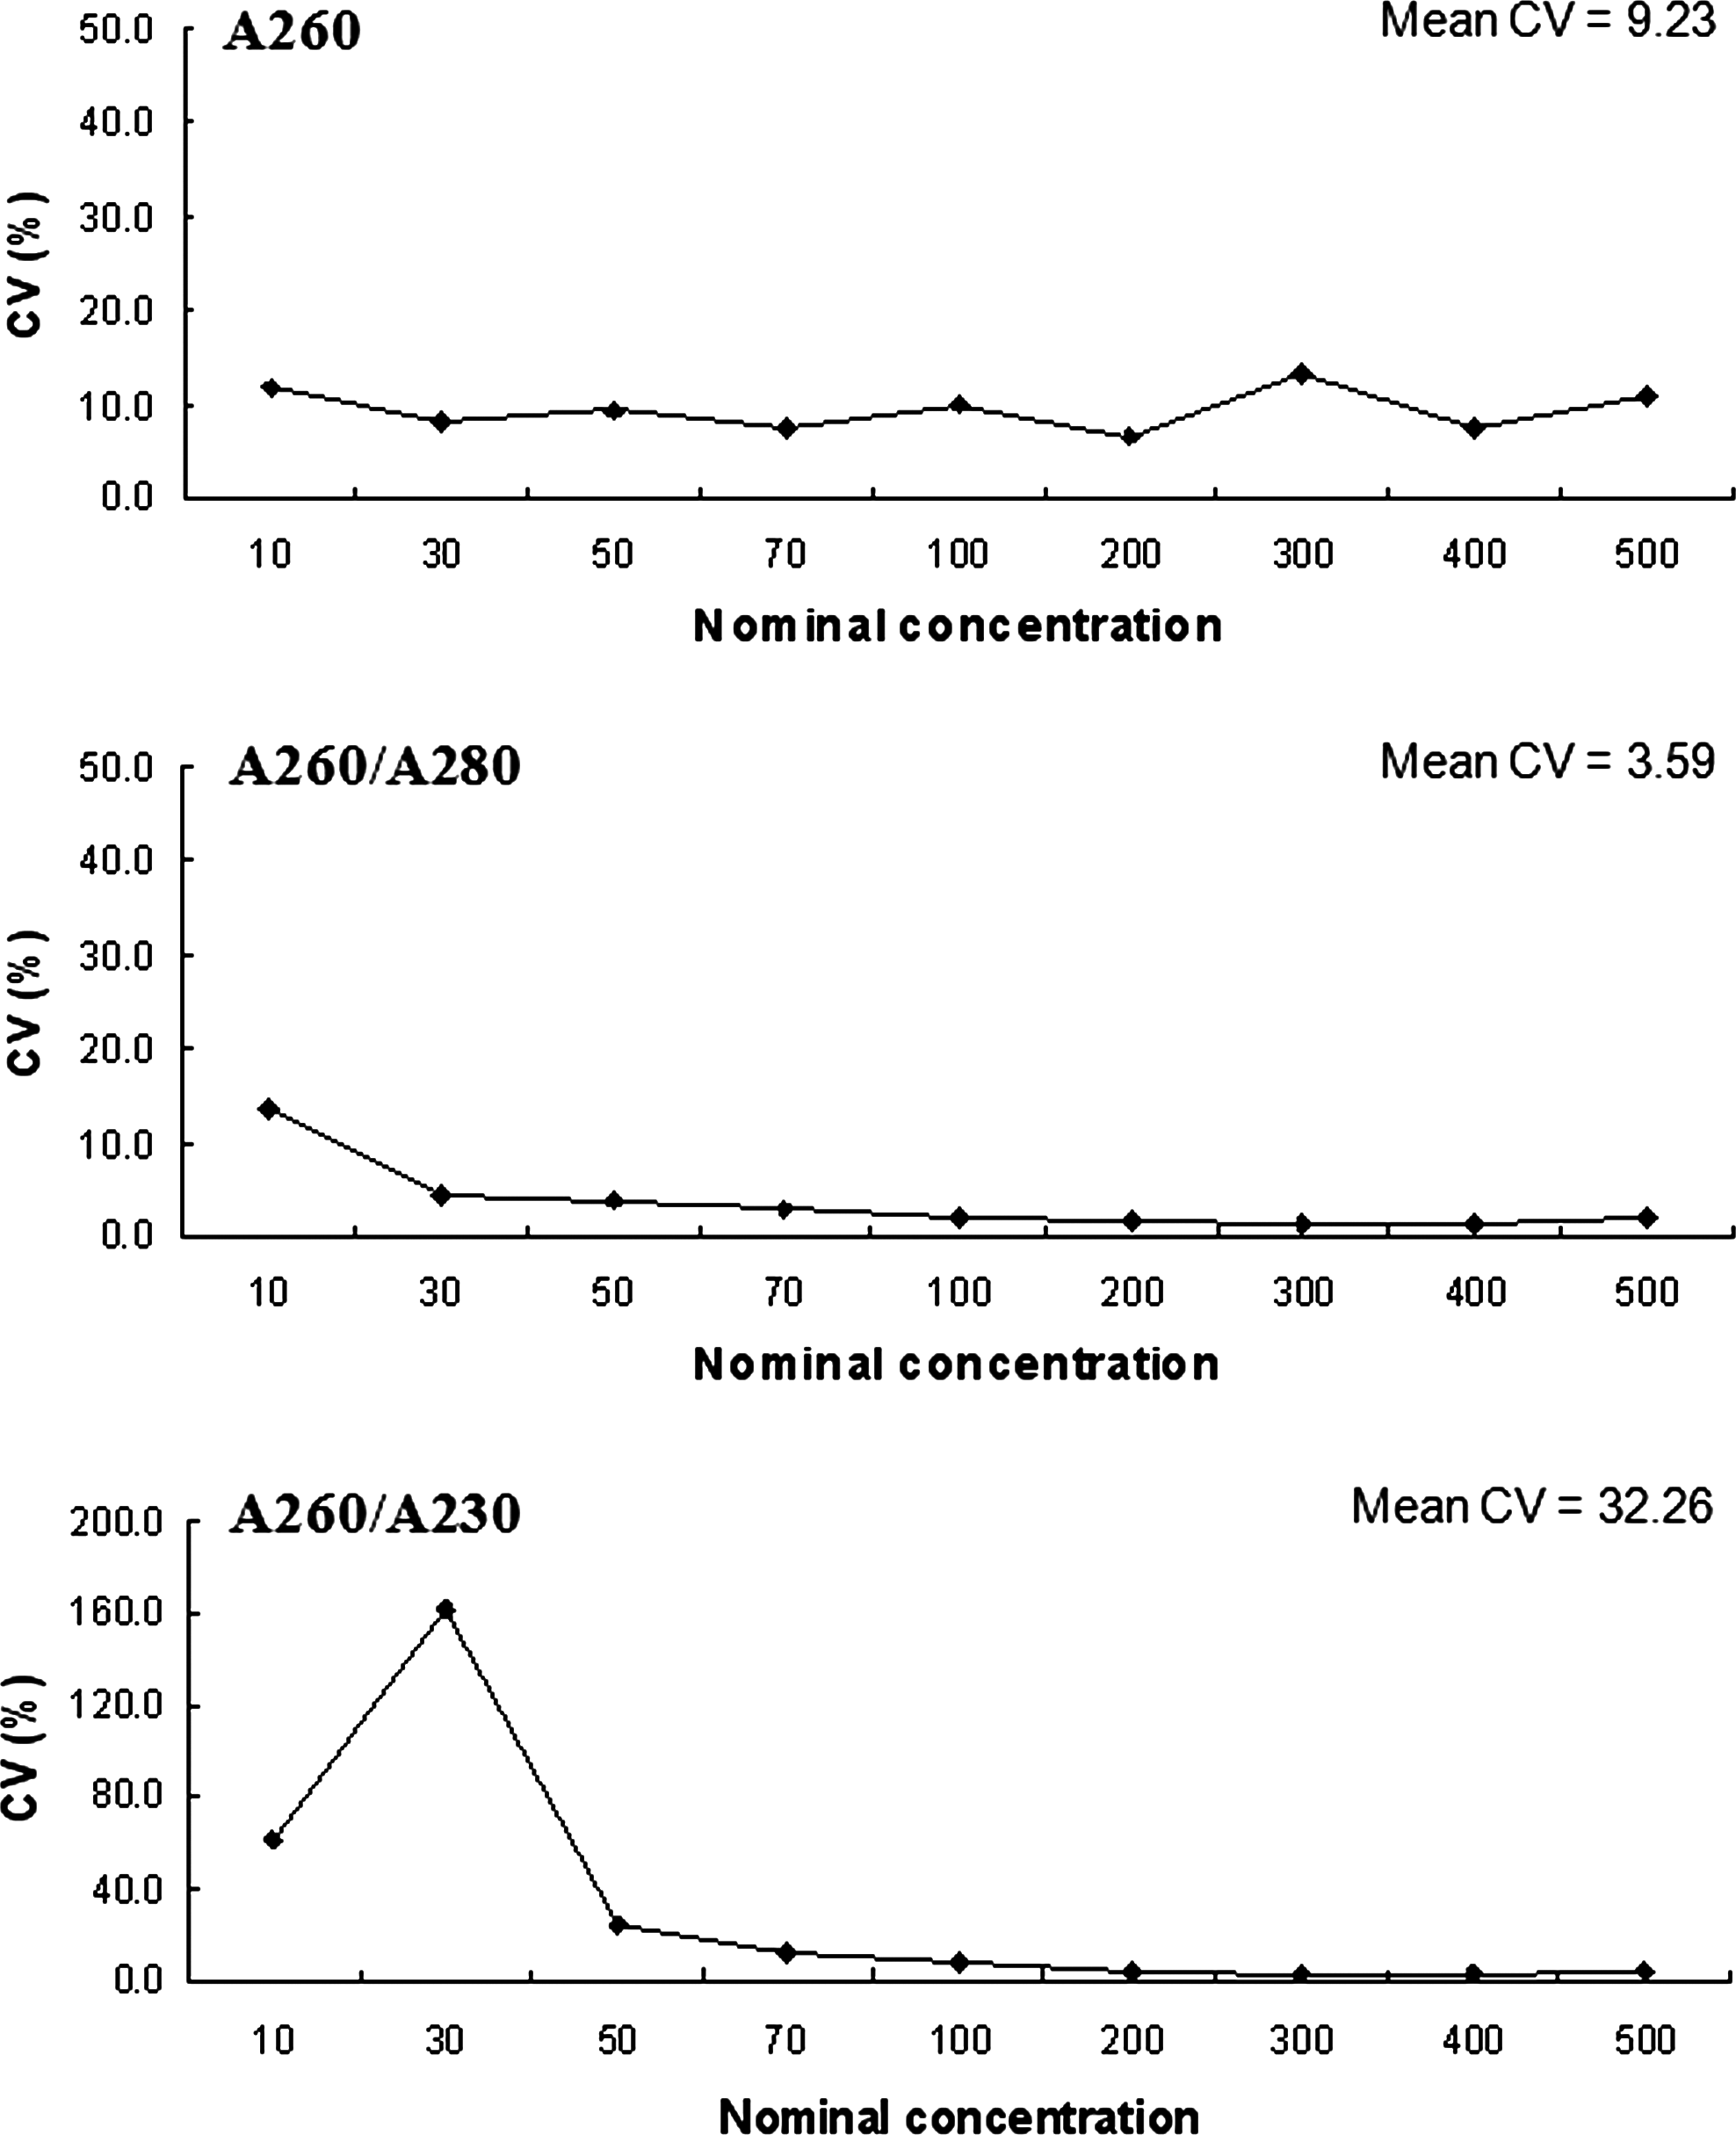
The variability of DNA quantity and purity indexes among relatively well-trained individuals. The mean CV% for DNA measurements among 10 individuals from 3 groups (groups I, II, and IV) was calculated for 11 DNA samples in duplicate at different concentrations. CV%, coefficients of variation percentage.
Intra-operator variability
To assess intra-operator reproducibility, 16 individuals measured 11 duplicated DNA samples at >50 ng/μL. The mean CV% of intra-operator variability of A260, A260/A280, and A260/A230 values was 9.94% ± 6.40%, 1.70% ± 2.70%, and 8.27% ± 8.49% for all individuals, respectively (Fig. 4). Higher variability of the DNA measurements was observed for the individuals from group III, in which most technicians recently joined the biobanking process, suggesting the importance of training and experience in DNA quantitation.
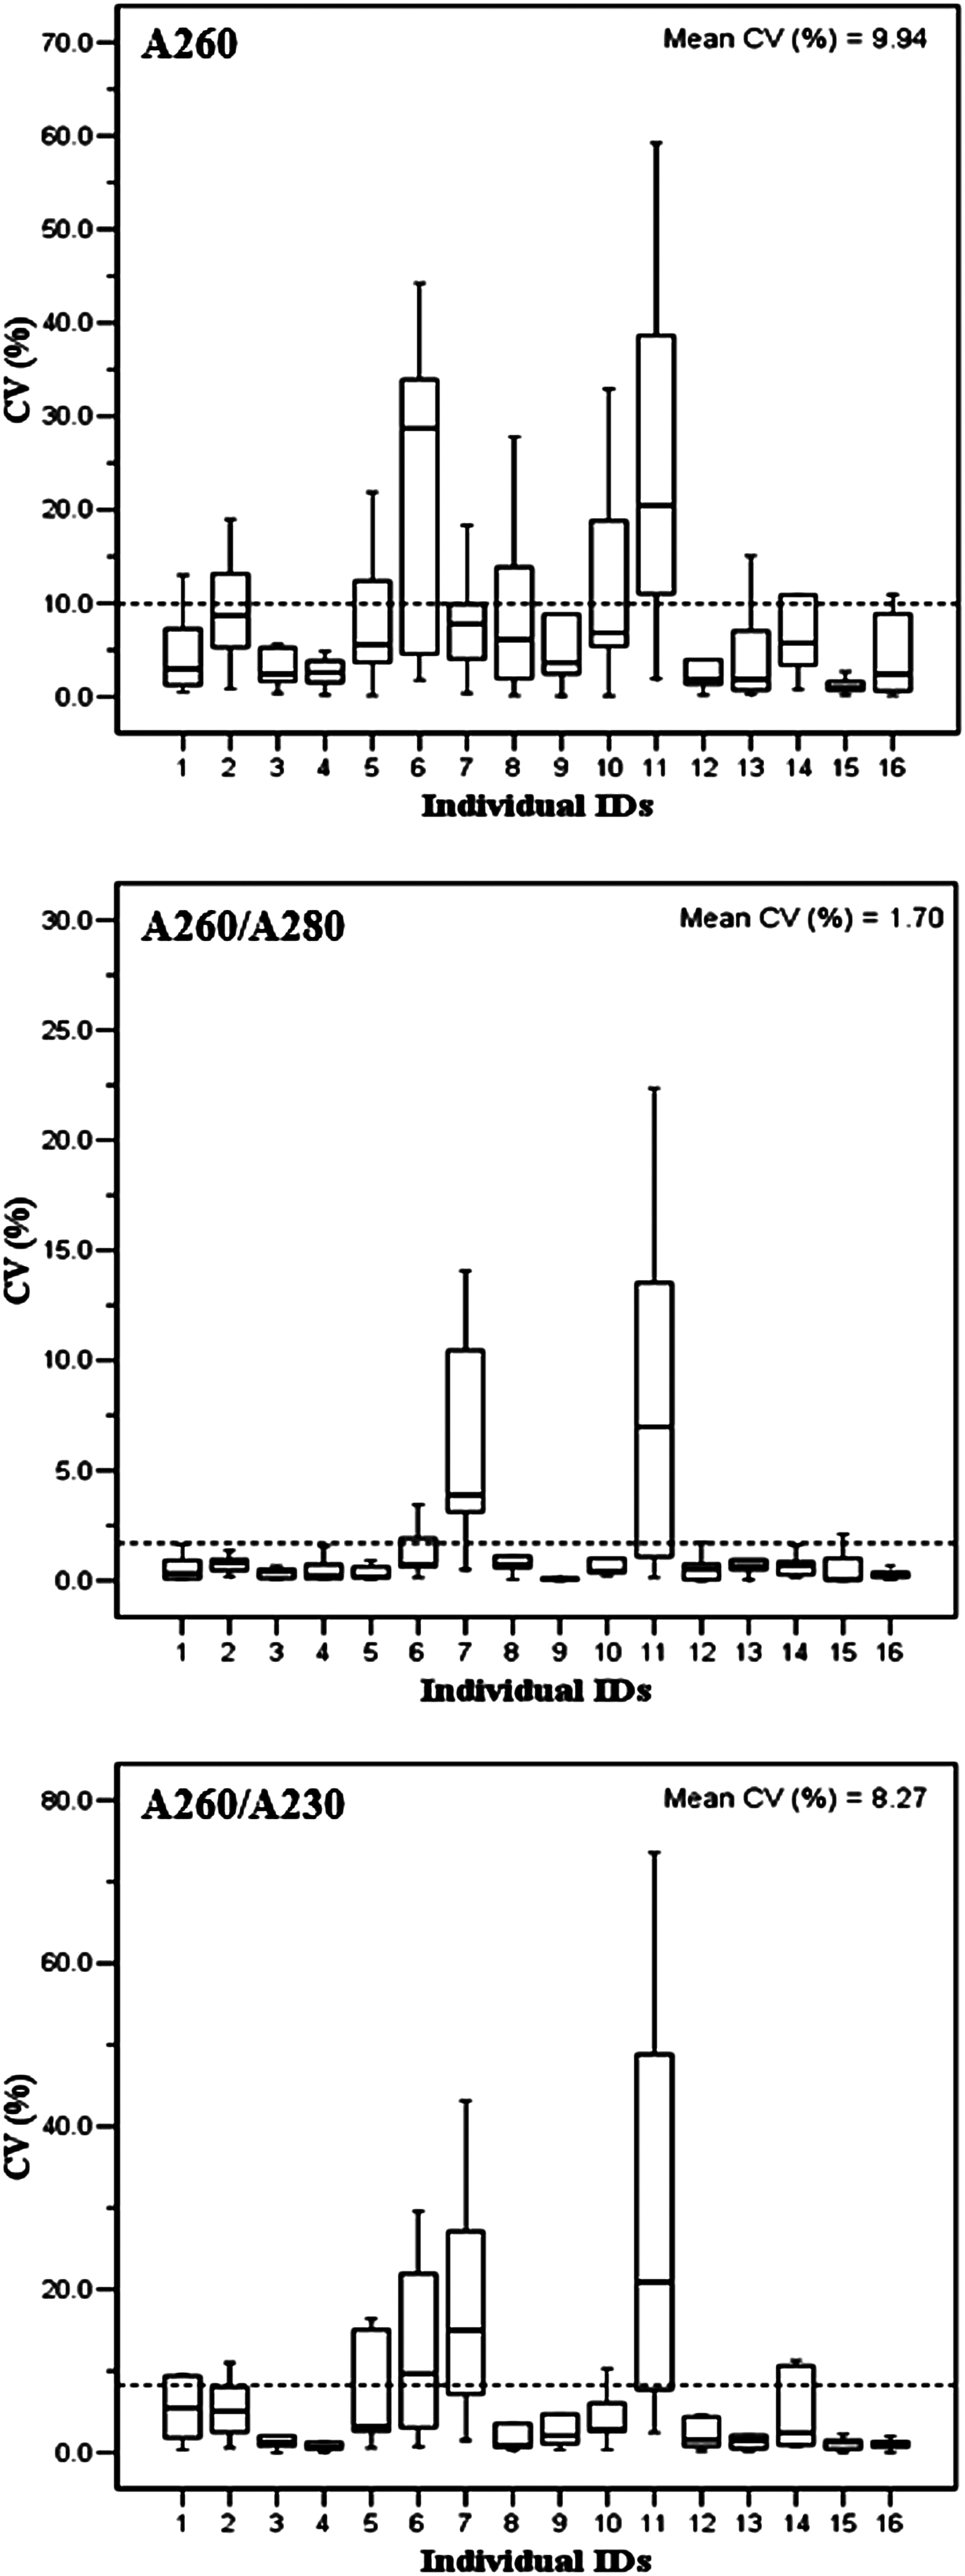
Intra-operator variability of A260, A260/A280 ratio, and A260/A230 ratio among 16 individuals for 11 DNA samples at >50 ng/μL. Data are expressed as the CV% for each DNA sample. The mean CV% of DNA measurements for the test samples among 16 individuals is shown as a dotted line in the graph.
Discussion
We performed the DNA quantitation project to assess variability in DNA measurements among different institutions that collaborated with the National Biobank of Korea. Participating individuals from each institution measured DNA quantity and purity with the same technology using a UV spectrophotometer. Thus, we did not consider variability caused by different technologies. It has been reported that different methods have resulted in variability in measurements of DNA concentration,4,6,7 showing statistically significant differences between fluorescence emission and absorption spectroscopy. 7 Despite the disadvantage of not being able to distinguish between ssDNA and dsDNA, the spectrophotometric DNA quantitation method exhibited the most consistent and precise measurement.6,15
In this work, 15 participants used the same procedure for DNA quantitation, where DNA samples were directly applied to the instrument (Nano-Drop), whereas one participant used a traditional UV spectrophotometer, for which DNA samples were diluted prior to quantitation. The individual who used the traditional UV spectrophotometer demonstrated the highest variability in DNA measurement. This result indicated that different procedures for DNA quantitation might result in variability of DNA measurement, suggesting that standardized DNA quantitation protocols among multicenters or multilaboratories should be used.
The interoperator and intra-operator variability of DNA measurements were higher in group III than in the other groups. Because the laboratories from group III were recently established, it is likely that they did not have much experience and training in DNA preparation and quantitation. Therefore, this study suggests that more highly experienced individuals or laboratories (eg, group IV) generate more reproducible DNA measurements. This is consistent with the report that suggested the experience and training of technicians are variables in this type of study.16,17
DNA and protein have maximal absorbance near 260 and 280 nm, respectively, whereas organic contaminants, such as phenol and other aromatic compounds, absorb light near 230 nm wavelength. Thus, A260 is used to determine DNA quantity, and the ratios of A260/A280 and A260/A230 are used to provide estimates of the purity of DNA samples. DNA samples with A260/A280 ratios of 1.8–2.0 and A260/230 ratios of 2.0–2.2 are generally regarded as having high purity. DNA samples with low purity have significant contamination, which affects genotyping and polymerase chain reaction amplification.18,19 According to our previous report on the effect of DNA purity on Affymetrix 5.0 SNP chip experiments, the highest single-nucleotide polymorphism call rate was obtained with DNA samples in a range of 1.85–1.90 for the A260/A280 ratio and 2.2–2.3 for the A260/A230 ratio. 20
The present study showed that DNA samples with concentrations below 100 ng/μL resulted in low reproducibility of DNA measurements, especially for the A260/A230 DNA purity index. This result suggests that a DNA concentration of >100 ng/μL should be used for spectrophotometry-based DNA measurements. Further, our results emphasize the importance of training and education of technicians participating in DNA work.
Footnotes
Acknowledgments
This work was supported by an intramural grant (2005-N74001-00/2910-212-207) from the Korea National Institute of Health, Korea Centers for Disease Control and Prevention. The biospecimens for this study were provided by the National Biobank of Korea.
Author Disclosure Statement
No competing financial interests exist.