
Abstract
Sample quality is of major importance when conducting molecular analysis of nucleic acids, and factors such as degradation, presence of impurities, and enzymatic inhibitors may have a significant impact on the quality of data. Issues of quality assessment become more important as the increased use of biobanking means that whole blood samples are being stored for longer periods. A range of commercially available kits/methods have been specifically developed for extraction of high quality nucleic acids from a variety of clinical samples, including blood, but there is limited information on how best to quality assess the extracts to determine their fitness for purpose in specific downstream applications. In this study, we have performed nucleic acid extractions from stored blood using a number of different methods. The resulting extracts were analyzed by a panel of quantity and quality metrics including UV spectrophotometry, PicoGreen fluorescence, electrophoresis, and a PCR approach. To evaluate the relevance of different metrics, DNA samples were subsequently assessed for their performance in real time PCR and microarray experiments. Our findings demonstrate that the most suitable extraction technique and quality assessment approach depends on the required downstream analytical method.
Introduction
Electrophoretic methods for the evaluation of nucleic acid degradation include standard agarose gel analysis (DNA and ribonucleic acid (RNA)), pulsed field gel electrophoresis (large DNA molecules), and microcapillary electrophoresis systems (DNA and RNA), such as the 2100 Bioanalyzer (Agilent) and the Experion (BioRad). The 2100 Bioanalyzer provides an RNA integrity value as RIN (RNA Integrity Number), whereas Experion calculates RQI (RNA Quality Indicator) ranging between 10 to 1 as a measurement of RNA quality based on the degree of sample degradation. 4 For the Agilent system, intact RNA is defined by RIN of > 8, but samples with RIN of > 5 and < 8 are still considered good quality for downstream analyses such as real time quantitative polymerase chain reaction (qPCR).5,6 While such specific guidelines exist for assessment of RNA degradation, 7 DNA quality is not discussed as extensively, with much of the associated discussion focusing upon trace analysis. 8 In most cases, quality assessment of DNA is limited to rudimentary methods for estimating purity by UV spectrophotometry and degradation by DNA fragment analysis on agarose gels. While these are established approaches, their value for quality assessing a sample for downstream analysis is often unclear. Improved methods for quality assessment of DNA are likely to be required as long-term storage of biobanks become more established 9 and readily used for a variety of molecular analyses.
Blood represents a frequently used clinical sample that is both accessible and suitable for many aspects of research and, therefore, also one of the favored samples for the increasingly popular exercise of biobanking.9,10 With the concomitant development of more sophisticated analytical methods for nucleic acids, there will be an increased demand on biobanked samples, extraction methods and, if robust research is to be performed, the metrics to quality assess the extracts prior to the respective downstream analyses. In a recent study, Palmirotta et al. demonstrated that the method of blood sample storage may have a considerable effect on the yield and quality of the resultant nucleic acid. 11 In the present study, we have investigated the use of a number of different methods for nucleic acid extraction from blood stored using two different approaches, evaluated the extracts using a range of new and established quantity and quality metrics, and reported how they can impact on downstream analyses.
Materials and Methods
Blood for extractions
Two types of blood storage methods were used for genomic DNA (gDNA) and RNA extractions in this study:
1) Human whole blood from the UK National Blood Service (NBS, UK), where 450 ml of blood from three male donors was collected in bags containing 63 ml of citrate-phosphate-dextrose (161 mM anhydrous glucose, 89.4 mM sodium citrate, 16.1 mM sodium dihydrogen phosphate dihydrate, 15.6 mM citric acid monohydrate, and 2.0 mM adenine; referred to hereafter as 'CPD stored blood'). The samples were stored at 4°C for approximately 2 days, followed by storage at −80°C for 1–4 weeks prior to extraction. 2) Human whole blood from three male donors was purchased from Sera Laboratories International (UK), collected in either PAXgene DNA or PAXgene RNA Vacutainers (Qiagen). Each PAXgene DNA Vacutainer contained 8.5 ml of blood and 2 ml of stabilizing additives (10.5 ml in total). PAXgene RNA Vacutainer contained 2.5 ml of blood and 6.9 ml of stabilizing additives (9.4 ml in total). Frozen samples were thawed and aliquoted upon receipt and subsequently stored at −20°C for up to 4 months prior to extraction. It may be noted that due to procurement of samples from different sources, the three donors used for the CPD stored blood (donors 1–3) were different from the three donors used for PAXgene DNA stored blood (donors 4–6).
DNA extractions
DNA extractions from CPD stored blood were performed using the Gentra Puregene Blood Kit (Gentra; Qiagen) and the Wizard Genomic DNA Purification Kit (Wizard; Promega). DNA extractions from PAXgene stored blood were performed using the Gentra, Wizard, and PAXgene Blood DNA kits (PAXgene DNA; Qiagen), as well as the standard phenol/chloroform/isoamyl alcohol extraction method (PCI; Sigma-Aldrich). All extractions were performed on blood from three donors in duplicate (6 extractions in total), unless otherwise stated. A negative control sample (water) was also included in each round of extractions.
For CPD stored blood, Gentra and Wizard kits were used with 0.3 ml sample (0.26 ml equivalent original blood volume), following manufacturer's recommended protocol. For PAXgene DNA stored blood, again Gentra and Wizard kits were employed and 0.5 ml of blood was used (0.41 ml equivalent original blood volume). Before the extractions, 1.5 ml of Cell Lysis Solution was added and the remaining protocol was performed according to manufacturer's recommendation. All volumetric differences were accounted for during subsequent metric analysis.
For PCI extraction using 0.5 ml PAXgene DNA stored blood, an initial red blood cell lysis step was included using the Gentra kit. The resultant blood cell pellet was resuspended in 0.6 ml water containing 3 μg/μl proteinase K (Sigma-Aldrich) and incubated at 56°C for 1 hour. An equal volume of PCI, ratio 25:24:1 was added to the samples. Following mixing by inversion and short centrifugation at 12,000 g, the aqueous phase was transferred to a fresh tube. The procedure was repeated three times with PCI and once with chloroform only. DNA was precipitated by the addition of 2/3 sample volumes of absolute ethanol and 1/10 volume of sodium acetate (3 M, pH 5.2). DNA pellets were washed briefly in 70% ethanol, air dried and resuspended in 100 μl TE buffer (pH 8.0) (1).
The PAXgene DNA kit was developed for extraction from a whole tube of 10.5 ml PAXgene DNA stored blood (8.5 ml equivalent original blood volume). DNA was extracted from 10.5 ml from donors 4 and 5 according to the manufacturer's instructions. To investigate extracting from a smaller volume of PAXgene DNA stored blood using the manufacturer's recommended extraction method, DNA extractions were also performed with the PAXgene DNA kit using 0.5 ml of PAXgene DNA stored blood. For this purpose, the standard protocol, including all buffer/solution volumes, was adjusted relative to the smaller blood volume. DNA pellets were resuspended in 100 μl of BG4 buffer (provided by the manufacturer).
RNA extractions
RNA extractions from CPD and PAXgene RNA stored blood were performed using the RiboPure-Blood Kit (RiboPure; Ambion), AllPrep DNA/RNA Mini Kit (AllPrep; Qiagen), and Trizol (Invitrogen). The PAXgene Blood RNA kit (PAXgene RNA; Qiagen) was also used for the PAXgene RNA but not the CPD stored blood. RNA extractions were performed with blood from three donors in duplicate (6 extractions in total). A negative sample (water) was included in each round of extractions. Prior to all RNA extractions, 2 ml of PAXgene RNA blood (0.53 ml equivalent original blood volume) was thawed for each extraction and left at room temperature for 2 h to ensure complete lysis of blood cells, as recommended by manufacturer's protocol.
RiboPure RNA extractions were performed according to the manufacturer's instructions with the addition of 800 μl of Lysis Solution. RNA was eluted twice using 50 μl Elution Solution. AllPrep extractions were performed according to the manufacturer's instructions with the addition of 600 μl Buffer RTL Plus. RNA was eluted from columns using 50 μl of RNase-free water. Trizol RNA extractions were performed following the manufacturer's protocol after the addition of 750 μl Trizol. The RNA pellet was resuspended in 50 μl of RNase-free water.
The PAXgene RNA kit was developed for extraction from a whole tube of 9.4 ml PAXgene RNA stored blood (2.5 ml equivalent original blood volume). RNA was extracted from donors 4 and 5 according to the manufacturer's instructions. To evaluate extraction on smaller volumes of blood, we also performed RNA extractions with this kit from 2 ml of PAXgene RNA stored blood. For this purpose, the standard protocol, including all buffer/solution volumes, was adjusted relative to the smaller blood volume. After applying samples to the PAXgene RNA columns, the standard protocol was followed for subsequent steps. RNA was eluted twice using 40 μl elution buffer (BR5; included in the kit).
Nucleic acid metrics
UV spectrophotometry of DNA and RNA extracts
Freshly extracted DNA and RNA samples were analyzed by UV spectrophotometry using a Nanodrop ND-1000 instrument (Thermo Scientific) for yield (absorbance at 260 nm) and purity measurements (260/280 and 260/230 absorbency ratios). Triplicate aliquots were measured for all samples.
PicoGreen fluorescence of DNA extracts
For DNA concentration measurements using PicoGreen, gDNA samples were diluted 100x in TE buffer (pH 8.0) to adjust concentrations to within the range of 20–300 pg/μl, based on initial Nanodrop estimations. Diluted samples were mixed 1:1 with PicoGreen (Invitrogen) and fluorescence was measured using Infinite M200 plate reader (Tecan). Concentrations were calculated based on a standard curve generated by diluting the standards (provided by manufacturer) in the range of 12.5–400 pg/μl (based on initial Nanodrop estimations). gDNA samples were analyzed in triplicate while the standards were analyzed in duplicate.
Electrophoresis of DNA and RNA extracts
DNA samples from each donor and extraction were analyzed by agarose gel electrophoresis. Approximately 200 ng of each sample (as determined by UV spectrophotometry) was loaded on a 0.8% agarose gel and sizes were determined by comparing to a 1 Kb extension ladder (Invitrogen). Commercially available gDNA (Promega) was also included as an example of an undegraded sample. Agarose gels were supplemented with 1x GelRed Nucleic Acid Stain (Biotium) for visualization of DNA on UV transilluminator. For agarose gel analysis of iALU PCRs, 10 μl of PCR products were loaded on 1% agarose gels and compared to a 1 Kb ladder (Invitrogen).
Quality (RIN) of extracted RNA were analyzed using the 2100 Bioanalyzer and employing an RNA 6000 Nano kit, according to manufacturer's instructions. A negative control (water) and a positive control consisting of high quality total RNA (RIN 9-10) were also analyzed on each chip.
iALU PCR
iALU PCR was performed on one representative DNA sample from each donor and extraction (the corresponding samples analyzed by agarose gel electrophoresis). DNA samples were diluted to 10 ng/μl and for each sample, three separate PCR reactions were performed using previously described primers CL1, CL2, and CL3. 12 Commercially available gDNA (Promega) was also included as a DNA standard. Reactions were performed in 20 μl volume containing 40 ng of DNA template, 0.25 μM of forward and reverse primer and 1x HotStarTaq Plus PCR master mix (Qiagen). PCR amplifications were performed on a Tetrad2 DNA Engine Peltier thermal cycler (MJ Research) with the following cycling parameters: 94°C for 3 min, followed by 30 cycles of 94°C for 1 min, 50°C for 30 sec, and 68°C for 6 min.
Analysis of PCR inhibition by iALU PCR
DNA samples (PAXGene Blood DNA extractions from 10.5 ml PAXgene DNA stored blood from donors 4 and 5 only) were diluted to concentrations of 20, 10, 5, and 2.5 ng/μl. iALU PCR was performed with the CL2 and CL3 primers as described previously using 4 μl of template DNA from the dilutions.
Molecular analysis
qPCR
qPCR analysis of the glyceraldehyde 3-phosphate dehydrogenase gene (GAPDH) was performed on one DNA sample from each donor and extraction, using Universal TaqMan Master mix (ABI), 900 nM each of GAPDH forward (5
Array Comparative Genomic Hybridization (aCGH) analysis
aCGH was performed on all DNA extracts from donor 2 (CPD stored blood) and donor 5 (PAXgene DNA stored blood). The 10.5 ml volume PAXgene extract from donor 4 was also assessed using aCGH to further investigate the iALU PCR discrepancy described. Both test and reference gDNA sample (400 ng of each) were fluorescently labeled using random primers and Klenow enzyme using the fluorescent labeling system [dCTP/BAC] Version 2.0 (BlueGnome, Cambridge, UK). In each case, the extracted blood gDNA samples were labeled with Cy3-dCTP and the reference female gDNA (Promega) was labeled with Cy5-dCTP. DNA yield and efficiency of dye incorporation was evaluated by UV spectrophotometry. Labeled targets from test and reference samples were combined and mixed with Human Cot-1 DNA provided by the kit (BlueGnome) and dried using a speed vacuum centrifuge (ThermoSavant) at 42°C for 3 hours. Labeled targets were resuspended in 245 μl of 10% dextran sulfate hybridization buffer and incubated at 75°C for 10 min. SureHyb microarray hybridization chambers (Agilent) were assembled with a 2x 10⁵K CytoChip Focus Haematology [BAC] array (BlueGnome). Each array consisted of 11,232 spotted probes per subarray, across 2500 BACs spanning 50 regions of the human genome. Arrays were hybridized at 42°C overnight with rotation at 4 rpm and subsequently washed through a gradient of sodium chloride-sodium citrate buffers at 60°C, as per manufacturer's recommended protocol. The arrays were scanned at 5 μm resolution in dual channel (red and green) using the Agilent G2505B scanner. The scanned TIFF images were analyzed using BlueFuse (BlueGnome) software to obtain spot amplitude values for both channels. Quality metrics, which take account of the percentage of probes included in the aCGH analysis, mean of the standard deviation between replicate probes, and the mean of the Ch1/Ch2 (Cy3/Cy5) ratios from normalized data, were exported from the BlueFuse software.
Statistical analysis
Data sets for analysis were initially tested for normality using D'Agostino and Pearson omnibus normality test. Variances were compared using the F-test (one-tailed). A linear mixed model with maximum likelihood estimation was used to compare specific yield with kit or storage method as a fixed effect and donor as a random effect. Paired comparisons of DNA yield estimation by PicoGreen and UV spectrophotometry were performed using Wilcoxon matched pairs test. All correlations were performed using Spearman rank test. Results were considered statistically significant where p≤0.05.
Results
DNA extractions
DNA yield and purity assessment using absorbance and fluorescence
Results from DNA yield and purity measurements by UV spectrophotometry are presented in Table 1. To enable comparison between extractions from CPD and PAXgene DNA stored blood, the data is reported after adjusting for the total volume of blood and excluding additives used for the extraction. UV 260/280 ratios were generally close to the expected value of 1.8, providing little scope for highlighting any trends with the other metrics. We found the 260/230 ratio to be much more variable, but no trends were observed by which poor performance of this metric could be associated with that of the other methodologies.
DNA yields are presented per blood volume (excluding additives) used for each extraction.
One extraction failed due to a complete loss of blood cell pellet at an early step during procedure.
The Wizard and Gentra kits did not differ significantly in terms of yields when used to extract blood from either storage method. No significant difference was detected in the yield using either extraction procedure between the two storage solutions (at the 95% confidence level). When PCI was used to extract DNA from PAXgene DNA stored blood, the yield was statistically lower than that from Wizard and small volume PAX extractions (p≤0.0001 and p≤0.026, respectively). The highest average DNA yield from all extractions was accomplished using the complete PAXgene Blood DNA system (PAXgene DNA blood and extraction kit). However, when the PAXgene DNA kit was used on a smaller volume of PAXgene DNA stored blood, it resulted in the largest standard deviation of yield measurements.
The mean DNA yield from the two extractions from whole PAXgene DNA stored blood tubes with the PAXgene DNA system was 32 μg/ml of whole blood (272 μg per tube of PAXgene stored blood), which is within the expected range of 150–500 μg per tube stated in the manufacturer's instructions.
In addition to UV spectrophotometry concentration estimations, one DNA sample from each blood donor and extraction was also analyzed using PicoGreen fluorescence. The PicoGreen measured a significantly higher DNA concentration than the UV spectrophotometry (p≤0.0001) but there was a high degree of correlation between the two measurements (p≤0.0001).
DNA quality assessment using agarose gel analysis and iALU PCR
Agarose gel electrophoresis demonstrated that high molecular weight DNA (>40 Kb) was extracted from PAXgene DNA stored blood using the Wizard and PAXgene DNA kits (Fig. 1). DNA extracted using Gentra kit from PAXgene DNA stored blood showed loss of the >40 Kb high molecular weight DNA, with the majority being approximately 40 Kb in size. The PCI extracted DNA, from PAXgene DNA stored blood, was fragmented with all observed DNA molecules < 20 Kb. DNA extracted from CPD stored blood using the Gentra and Wizard kits also showed a loss of > 40 Kb high molecular weight DNA, with the majority of DNA being approximately 40 Kb in size; this result was comparable to the Gentra kit with PAXgene DNA stored blood.
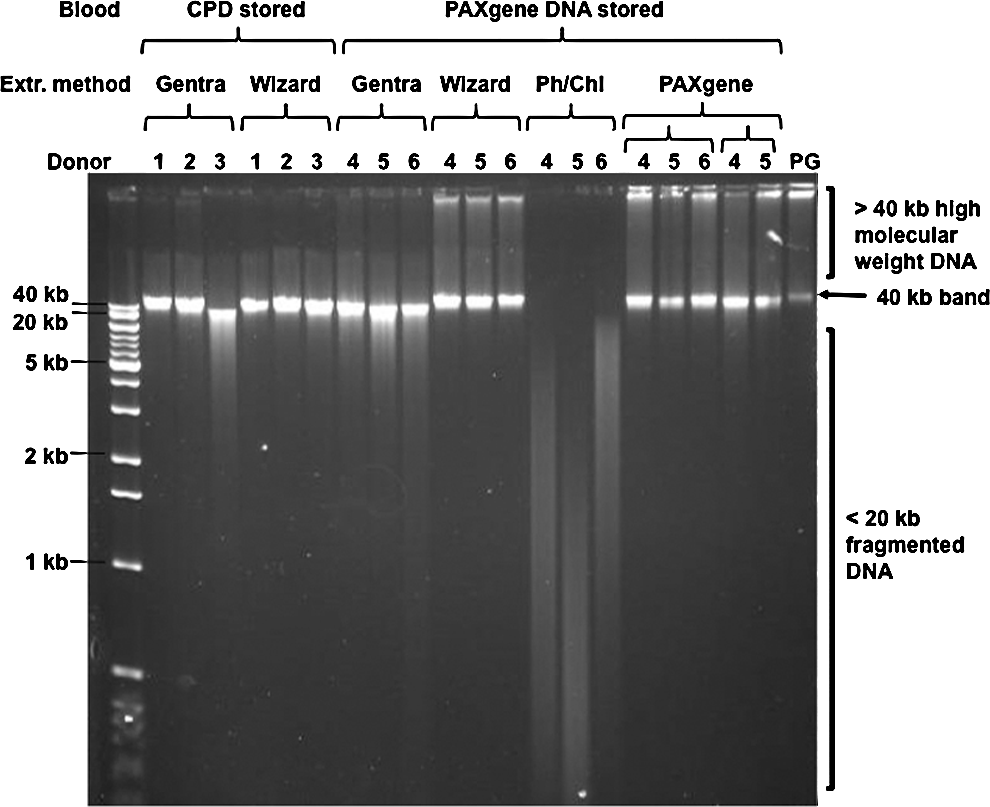
Agarose gel analysis of gDNA extracted from blood. A single example of each extraction from each donor was analyzed by agarose gel electrophoresis and compared to Promega gDNA (PG).
iALU PCR analysis of Promega gDNA showed a similar pattern for all three primer combinations consisting of a smear of DNA amplicons in the size range of 0.2 to > 12 Kb (Figs. 2A–2C). With the exception of PCI extracted DNA from PAXgene DNA stored blood, all DNA samples extracted from CPD stored blood (Fig. 2A) and 0.5 ml of PAXgene DNA stored blood (Figs. 2B and 2C) showed PCR products similar to that of Promega gDNA. In contrast, iALU PCR for PCI extracted DNA (Fig. 2B) showed a loss of larger products, consistent with the fragmentation observed for these samples by agarose gel electrophoresis (Fig. 1).
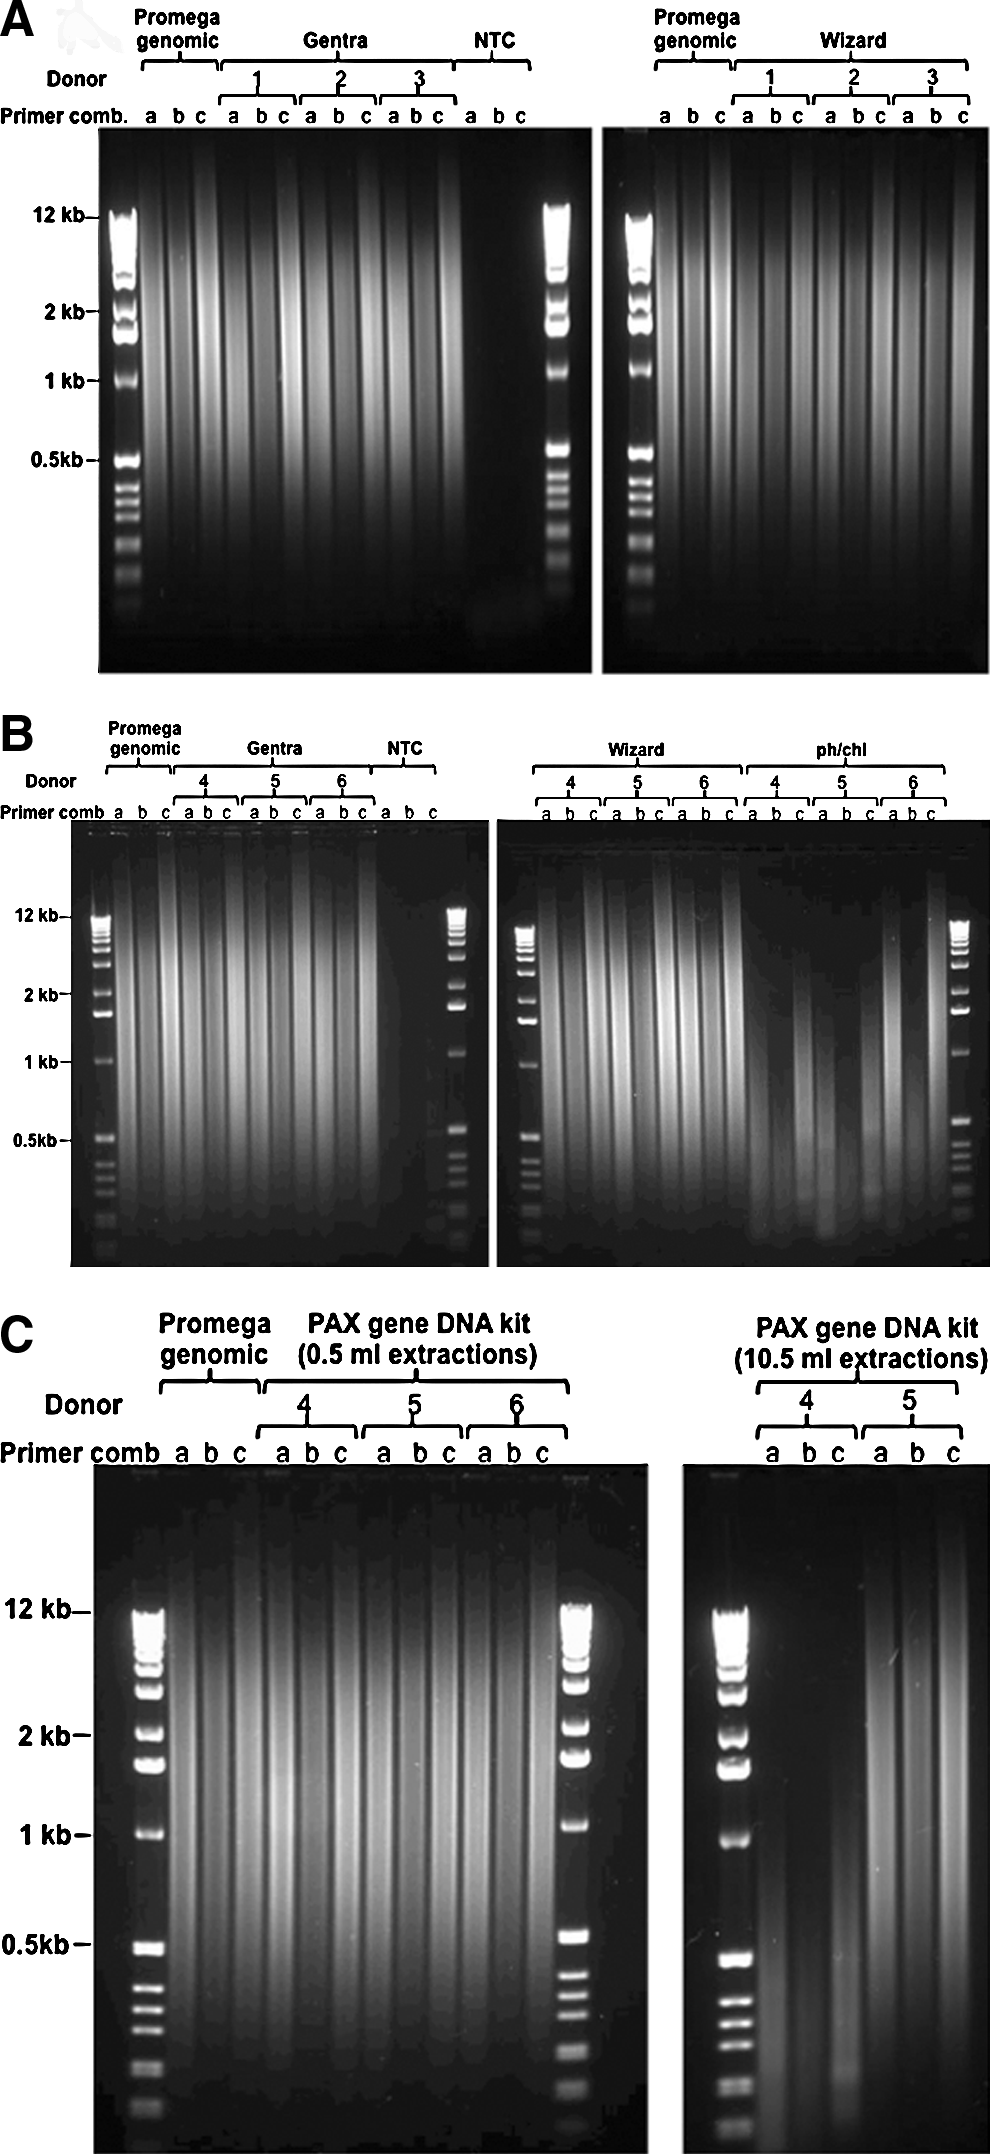
Agarose gel analysis of iALU PCR on gDNA extractions.
One of the two DNA samples (donor 4) extracted using the PAXgene DNA kit from a whole tube of blood also showed a loss of larger products by iALU analysis (Fig. 2C), despite yielding good quality DNA when evaluated by agarose gel electrophoresis (Fig. 1). The second sample (donor 5) extracted by the same process showed a similar iALU result to that of Promega DNA (Fig. 2C). To investigate if the loss of large DNA amplicons was due to the presence of PCR inhibitors in donor 4 sample, PCR amplification was repeated on further DNA dilutions. The same procedure was followed for the sample from donor 5. No difference was observed between the PCR products from concentrated and diluted DNA from donor 4, indicating that the cause of the reduced PCR product size was not the presence of PCR inhibitors.
RNA extractions
Yield and purity
RNA yield and purity values as determined by UV spectrophotometry are reported in Table 2. As with DNA analysis, UV 260/280 ratio was close to the optimal value, while 260/230 was more variable; again no trends could be associated with the latter and observed alternative metric results. For evaluation of RNA quality, samples were also analyzed using the 2100 Bioanalyzer, which provided RIN values (Table 2) and electropherograms showing the ribosomal subunits (Fig. 3). The Bioanalyzer also provided a second metric for concentration measurements that showed correlation with UV spectrophotometry estimates. With the exception of a single sample extracted using the RiboPure kit, all extracts from CPD stored blood yielded poor quality RNA (RIN<5), suggesting that the combination of extraction methods examined by this study and this storage method are not suitable for generating good quality RNA.
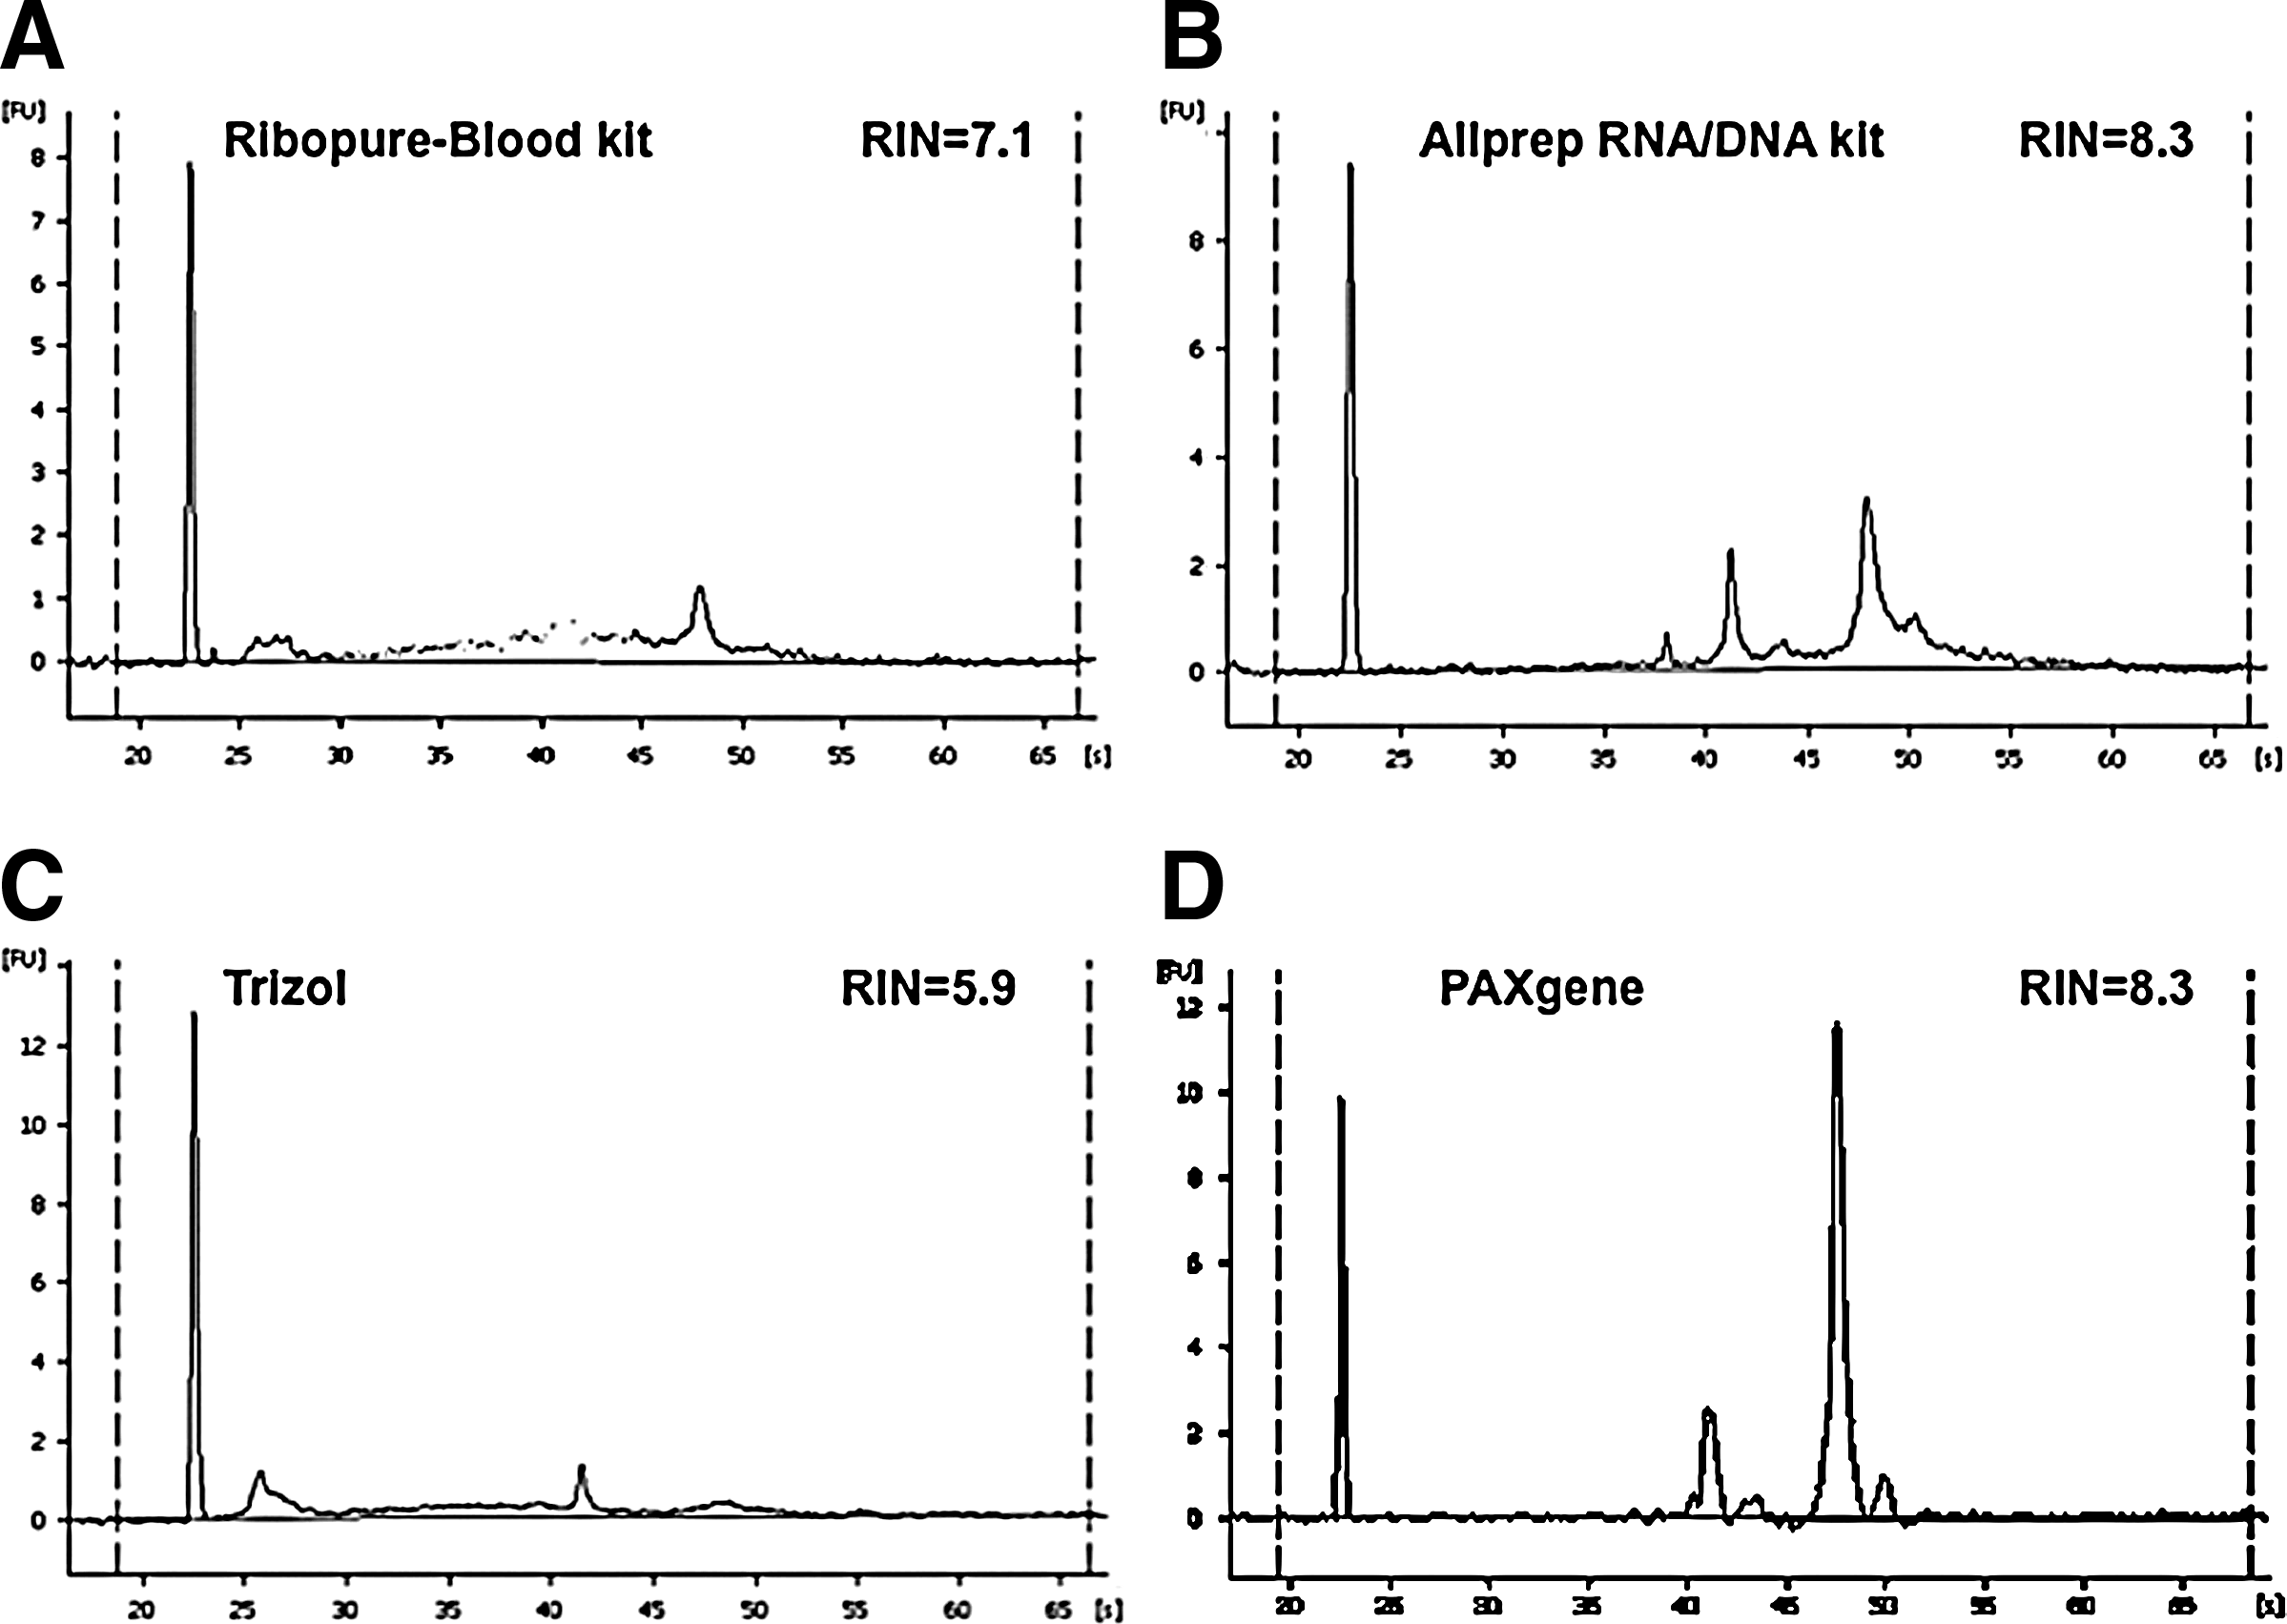
2100 Bioanalyzer electropherograms of RNA extracted from blood. Representative 2100 Bioanalyzer electropherograms of RNA samples extracted from PAXgene RNA Blood using the following kits:
RNA yields are presented as per volume of blood (excluding additives) used for each extraction.
Calculations based on values from 4 samples only due to RNA integrity number (RIN) estimation failure for two samples.
n number too small to calculate standard deviation.
All extractions from 2 ml PAXgene RNA stored blood (RNA vacutainer) generated RNA yields within acceptable ranges based upon manufacturer's instructions. The RiboPure kit gave the highest average yield per ml of blood for all the methods investigated (p≤0.002 when compared with the 2 ml PAX method by 2-tailed t-test). Trizol and the small volume PAXgene RNA extractions gave yields that were statistically similar to the whole tube PAXgene RNA extraction method (Table 2). All extraction methods gave good UV 260/280 ratios with an average of 1.93 (RiboPure kit) to 2.10 (PAXgene RNA Kit).
The highest quality RNA, as determined by RIN values in the range of 7.7–8.6, was achieved using the AllPrep kit (Table 2). All Trizol extracts showed similar electropherograms with a high degree of degradation of the 28S ribosomal subunit (Fig. 3), but RIN values were variable (1.0–5.9), with two samples failing to give any value (Table 2). RNA extracted using the PAXgene RNA kit showed distinctive peaks for the 18S and 28S ribosomal subunits in the electropherogram, indicating high quality samples.
Downstream molecular analysis of DNA extracts
qPCR
The gDNA samples analyzed by agarose gel electrophoresis and iALU PCR were further assessed by GAPDH-targeted qPCR technique. Samples from one Gentra and one PAXgene DNA extraction from 0.5 ml PAXgene stored blood generated poor standard curves with R2 values of < 0.90 (Table 3). Thus, PCR efficiencies could not be accurately estimated for these samples. For other samples, 4-point standard curve estimates of PCR efficiencies varied between 89.3%–109% (Table 3) and, with the exception of the remaining two 0.5 ml PAXgene DNA extractions (which had R2 values of 0.9239 and 0.9393), all R2 values were in the optimal range > 0.99. 13 The highest R2 values and PCR efficiency estimates were generated from the fragmented phenol/chloroform extracted DNA.
GAPDH qPCR assay was used to evaluate standard curve R2 values, slopes and PCR efficiencies.
PCR efficiencies could not be accurately estimated due to low R2 values.
aCGH
We evaluated the performance of DNA extracts on a BAC CGH microarray by performing sex-mismatched hybridizations. All DNA extracts from the PAXgene DNA stored blood (donor 5) or CPD stored blood (donor 2) were compared with Promega female gDNA (reference sample). DNA extracted from blood donor 4 using the PAXgene DNA kit, as per manufacturer's guidelines, which showed reduced amplicon sizes by iALU PCR, was also included in the aCGH analysis. A control aCGH was set up containing Promega male gDNA (test) with female gDNA. Analysis of labeled samples demonstrated that all eight blood DNA samples produced DNA yields and dye incorporation efficiencies that were within the manufacturer's recommended range (Table 4). There was no correlation between the level of dye incorporation and qPCR R2 values (p=0.51), suggesting that variation within the labeling and PCR were independent. Following aCGH hybridization, all DNA extractions from donors were identified as normal males by the discrimination of the X and Y chromosomes; however, there were differences in the quality of array data between extraction methods. PCI-extracted DNA had only 66.73% of the BAC probes included in the analysis compared with 91.26% for the control male gDNA (Table 4). All other DNA samples from donors 2 and 5 were within 5% of the mean value of control male gDNA data (Table 4). The ratio of the mean Ch1/Ch2 (Cy3/Cy5) for the PCI extractions (0.23) was approximately half of that of the other gDNA extractions from donor 5 (0.41–0.48) and the median standard deviation between probe replicates was larger for the PCI extractions (0.13) compared with the other extraction methods (0.04–0.05) (Table 4). The aCGH quality metrics for DNA extracted from blood donor 4 using the PAXgene-DNA kit had 82.79% BAC probes included in the analysis, a mean Ch1/Ch2 ratio of 0.18 and a mean standard deviation between probe replicates of 0.07 compared with the control aCGH that had 91.26, 0.46, and 0.05%, respectively (Table 4). Examination of the fused aCGH charts visually demonstrated the increased level of noise from the probe hybridization for the PCI extraction from PAXgene stored blood donor 4 (Fig. 4B) and PAXgene DNA extraction from PAXgene stored blood donor 4 (Fig. 4C). All other extraction methods were comparable to that observed from the control aCGH experiment (Fig. 4).
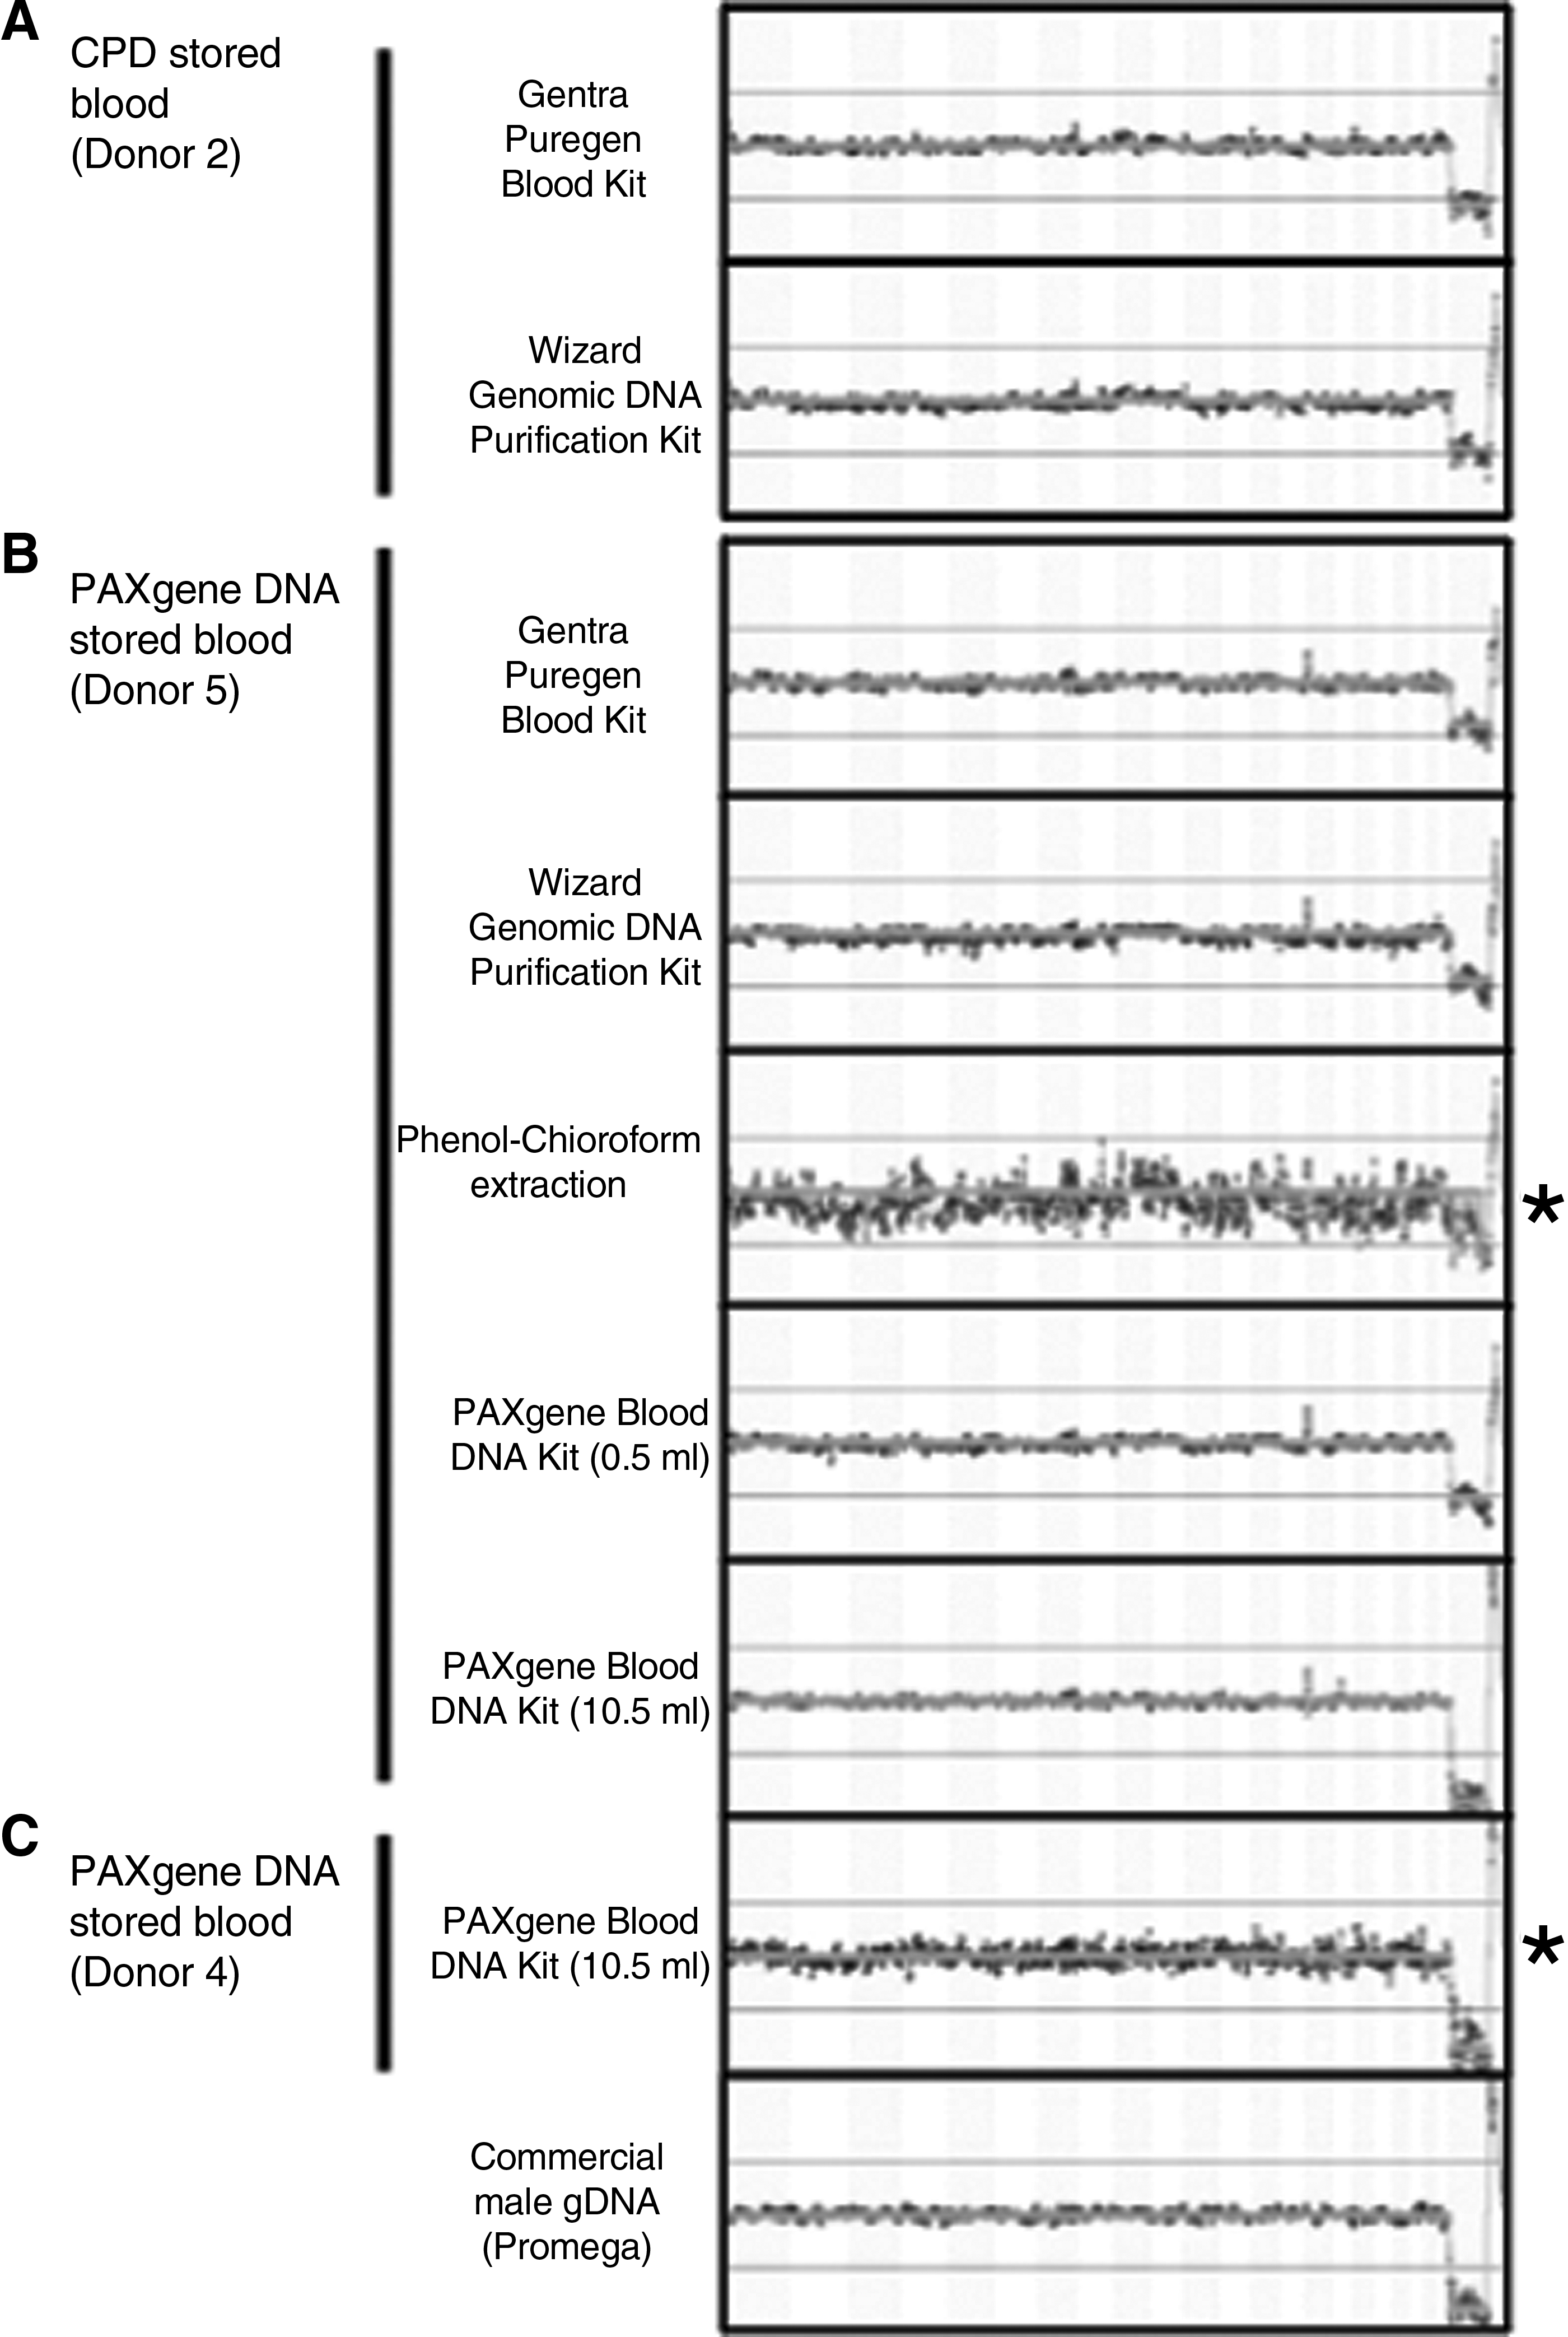
Comparative genomic hybridization of blood donor extractions. Fused charts of
Quality metrics, including % included probes, median SD between replicates and mean Ch1/Ch2 (Cy3/Cy5) ratios from normalized data were exported from BlueFuse software (BlueGnome).
Discussion
Molecular analysis of clinical samples will become increasingly important if the health benefits of the plethora of newer high throughput, system-wide data generating approaches are to have the maximum patient impact. Methods such as second and third generation sequencing,14,15 dynamic array PCR along with the increasing use of microfluidics, 16 result in much more information being obtained from a sample than has been possible with established techniques. Concomitantly, as the importance of collecting the correct demographics and ensuring ethical sampling becomes better established,17,18 it is likely that the use of large, well characterized biobanks will become a more common and valuable resource for such methodologies. Despite this, while there are established methods for rudimentary quality assessment of nucleic acid extracts, it is often unclear how this information reflects on the performance of downstream analyses, especially when using DNA extracts.
In this study, we employed a range of metrics to investigate a number of different extraction methods following prolonged storage of whole blood. We compared two different storage methods: 4°C storage of whole blood with CPD (representing a routine clinical storage method used for whole blood for a range of subsequent clinical analyses) and PAXgene DNA and RNA systems (developed for clinical sampling and storage of whole blood specifically for subsequent nucleic acid analysis).
Quality
When DNA and RNA purity were assessed by UV 260/280 and 260/230 ratios, the findings were comparable. 260/280 ratios were close to the respective recommended values, while 260/230 was more variable. Consequently, neither metric was informative as an indicator for the success of downstream analyses with the samples investigated by this study.
Analysis of total DNA by agarose gel electrophoresis, demonstrated that the PAXgene DNA system yielded DNA of the highest molecular weight (Fig. 1). Both PAXgene DNA blood extractions using the recommended 10.5 ml, as well as the smaller 0.5 ml extracts, yielded comparable quality DNA to the Promega gDNA, used as the quality standard. Of note was that the Wizard kit also yielded similar quality DNA and, while not recommended by the manufacturer (personal communication), this approach offers a cheap alternative to the PAXgene DNA kit for DNA extractions from small volumes of PAXgene DNA stored blood. When the Wizard kit was used on CPD stored blood and the Gentra kit for both storage methods, the DNA yields did not include the very high molecular weight fraction (Fig 1). Finally, the PCI method used with the PAXgene DNA stored blood yielded the most fragmented DNA, all of which was below 20 Kb in size. This is unusual for PCl which is an established method capable of producing high molecular weight nucleic acid and may reflect an incompatibility between the storage and extraction method where high quality genomic DNA is required; this did not impact on the PCl extracts ability to be measured by qPCR (see below).
gDNA quality was further analyzed using a previously reported PCR assay designed to provide a surrogate measure of DNA quality by priming the ALU sequence to amplify inter-repeat regions, 12 referred to here as inter ALU (iALU) PCR. The primers bind to the consensus sequence of the ALU short interspersed nuclear element and prime in a direction that copies the sequence away from the ALU sequence such that amplicons are generated between ALU repeat elements. When using iALU PCR, larger amplicons were lost when DNA was fragmented or degraded. This approach was successful in detecting the severe fragmentation of PCI extracts but did not distinguish between samples with and without very high molecular weight DNA (>40 Kb) observed by gel analysis. In addition, iALU PCR detected a quality discrepancy in one PAXgene DNA extract which was confirmed by aCGH (see discussion below). With increased use, iALU PCR could potentially be developed to score the gDNA and be used to assess the sample quality in an approach similar to the way the RIN and RQI are used for RNA analysis.
Total RNA analysis using 2100 Bioanalyzer demonstrated that, according to this metric, good quality RNA was not extractable from CPD stored blood in all but one sample (data not shown). From 2.0 ml PAXgene RNA stored blood, the AllPrep kit generated the highest RNA yields and showed good RIN values (range 7.7–8.6). This suggests that RNA can be extracted from reduced volumes of PAXgene RNA blood, as initially demonstrated by Carrol et al., 19 but also that alternative extraction methods to the PAXgene system are suitable for PAXgene RNA stored blood.
Quantity
When total DNA extracts were analyzed using absorbance and fluorescence, the actual amounts were significantly different (p≤0.0001), but the relative amounts correlated significantly (p≤0.0001). Although the PAXgene DNA extraction protocol yielded the highest amount of total DNA, comparable yields were achieved using the Wizard kit, again suggesting this kit is suitable for extracting total gDNA from PAXgene DNA stored blood. When total RNA extracts were measured by absorbance, the highest average yield of RNA was generated from the PAXgene RNA stored blood using the RiboPure kit, with the AllPrep kit also producing good yields.
Utility of metrics for predicting downstream performance
To determine if the quality and quantity metrics impacted on relevant downstream molecular analyses of DNA, qPCR and aCGH techniques were additionally performed. qPCR, targeting the GAPDH gene, clearly demonstrated that PCI extracted DNA from PAXgene DNA stored blood produced the most consistent PCR results, suggesting this extraction method may be suitable for blood stored in this way. Furthermore, results suggest this extract was free of PCR inhibitors and that the fragmented DNA extracted did not impede, but possibly enhanced, amplification. Of note was that both CPD and PAXgene DNA stored blood yielded comparable results, with the PAXgene DNA extractions from smaller volumes of PAXgene DNA stored blood being the most variable. This suggests that CPD stored blood is as suitable for qPCR analysis as the PAXgene DNA stored samples and that miniaturization of the PAXgene DNA manufacturer's extraction method for qPCR analysis is not advisable, unlike the smaller volume PAXgene RNA method observed elsewhere. 19
aCGH analysis demonstrated that variation in any of the above metrics did not affect the enzymatic DNA labeling. While all extracts yielded aCGH results that passed the BlueFuse software quality metrics, it was apparent that the iALU method may predict the quality of the final aCGH result, as demonstrated with the PCI extracts, which showed smaller molecules by iALU PCR and yielded a noisy aCGH fused chart plot. The 10.5 ml PAXgene DNA extract that gave a poor iALU PCR size result also yielded a noisy aCGH fused chart despite producing a good agarose gel result. While further work is required to confirm this observation, these data suggest that iALU PCR could provide an appropriate quality metric predictor for improving aCGH analysis.
Conclusion
The data generated by this study indicate that both CPD and PAXgene DNA stored blood are suitable for subsequent DNA analysis. It should be noted, however, that the PAXgene samples had been stored for a longer period (4 months) than the CPD samples (4 weeks) and further work is required to establish if CPD storage is suitable for longer term storage. When storing RNA, PAXgene RNA storage solution is suitable, while CPD stored blood is not, according to the evaluated methodologies. Possibly the most significant finding of this study is the suggestion that choice of extraction method and applicability of subsequent metrics for assessing nucleic acid quality and quantity are dependent on the downstream analysis required (i.e., we can not assume the independence of the modules). We also introduce the use of iALU PCR as a potential quality metric for aCGH analysis. An additional finding that will be useful to individuals working with PAXgene DNA and RNA systems is that volumes and extraction methods other than those recommended by the manufacturer may be suitable for PAXgene DNA or RNA stored blood. As well as assessing extracts from biobanked tissues, the metrics discussed here can also be used to measure nucleic acid samples that have been stored for long periods of time or to confirm safe transport from different sites.
Our findings suggest that quality assessment of DNA, as well as RNA extracts, should be considered as an integral part of experimental protocol for subsequent nucleic acid analysis of biobanked samples. Furthermore, the most suitable extraction method and metric approach depends on the required molecular analysis; in addition, further work is required to describe a panel of metrics that may be used for specific downstream analysis on stored blood samples.
Footnotes
Acknowledgments
We would like to thank Simon Cowen for assistance with the statistical analyses.
Disclosure Statement
No competing financial interests exist.
The arrays and software (BlueFuse) for aCGH analysis were provided by BlueGnome, Cambridge, UK. The work described in the article was funded by the UK National Measurement System.