
Abstract
Background:
The extended role of vascular endothelial growth factor (VEGF) in human pathophysiology led us to evaluate pre-analytical parameters possibly influencing its levels in peripheral blood and tissues. The effects on VEGF protein levels and mRNA expression were measured after storage delay (blood and tissue), use of different types of anticoagulants (blood), and after different numbers of freeze-thaw cycles (blood).
Methods:
Blood from healthy donors was sampled simultaneously in ethylene diamine tetraacetic acid (EDTA), acid citrate dextrose (ACD-A), hirudin, and serum separation tubes. For each anticoagulant, VEGF was measured by enzyme-linked immunosorbent assay (ELISA) with different conditions of delay at 4°C before centrifugation (2 h, 4 h, or 48 h) and of different numbers of freeze-thaw cycles (1, 2, and 10). The transcripts coding for the VEGF165 isoform were quantified in peripheral blood mononuclear cells by RT-PCR. Muscle biopsy samples were frozen with delays of 15, 30, or 60 min after surgery. VEGF expression was quantified on immunofluorescence stained slides.
Results:
The period of storage and the number of freeze-thaw cycles correlated with an increase in the levels of circulating VEGF (for each anticoagulant but not for serum) and its expression in PBMCs. VEGF expression measured from muscle biopsy sections was higher with freezing delays, with a peak at 30 and 60 min as compared to 15 min.
Conclusions:
The most reliable conditions for measuring both circulating VEGF and its gene expression are to reduce time between blood collection and centrifugation, and to avoid multiple freeze-thaw cycles. Serum collection tubes with no additive and no separator were less sensitive to the pre-analytical variations analyzed in this study. Freezing delay had a significant influence on VEGF protein expression in tissue samples.
Introduction
Recent studies on circulating levels of VEGF demonstrate the prognostic importance of serum VEGF concentration in a variety of diseases, including atherosclerosis, ischemic heart disease, diabetic retinopathy, inflammatory diseases, many types of tumors, and pathologic conditions often leading to hypoxia.3,4 Other studies have proposed circulating VEGF as a possible biomarker for diagnosis, disease monitoring, treatment response, and erosive progression in patients with chronic diseases such as rheumatoid arthritis.5–9
VEGF is constitutively produced by megakaryocytes and platelets. 10 It is released from platelets after blood clotting, 11 with VEGF levels higher in serum than in plasma; an increase in VEGF in ethylene diamine tetraacetic acid (EDTA) plasma samples is induced by the pre-centrifugation delay. Both delay before freezing and the number of freeze-thaw cycles influence VEGF measures in urine. 12 Recently, it was shown that serum VEGF is decreased after long-term storage and freeze thawing. 13 Some studies have shown the need for validation of sample handling before the start of biomarker analysis in clinical trials, while their report indicates that removal of platelets reduced the plasma concentration of VEGF, if the platelets were removed before freezing plasma samples. 14
The extended role of VEGF in human pathophysiology underpins the importance of improving knowledge on the pre-analytical and analytical variable factors and thus the accuracy of laboratory analysis of VEGF. We previously reported inter-individual biological variations and defined reference values of VEGF levels in EDTA plasma. 5 However, little is known about pre-analytical variability of VEGF isoforms and corresponding gene expression. The aims of the present study are to evaluate the effects of pre-analytical factors on VEGF expression in blood and nontumor tissues. More precisely, we evaluated the influence of the presence and type of anticoagulant; the blood storage delay before centrifugation; and the number of freeze-thaw cycles on circulating levels of VEGF and on VEGF165 mRNA expression in peripheral blood mononuclear cells (PBMCs). We also evaluated the influence of freezing delay on non-tumor tissue VEGF protein expression.
Materials and Methods
Biospecimen collection and pre-analytical conditioning
Blood specimens from 27 healthy donors from the “Investigation Clinique et Accès aux Ressources Biologiques“ (ICAReB) Platform at Institut Pasteur and from 9 healthy donors from Picardie Biobank were collected. All donors signed an informed consent; the study was approved by the ethics committee CPP Ile-de-France I and the resulting sample collection declared to the Research Ministry (approval No: DC-2008-68). Within one sampling time, blood was collected from each donor, into 3 EDTA tubes (BD Vacutainer ref. 368589), 3 acid citrate dextrose (ACD-A) tubes (BD Vacutainer ref. 366645), 3 hirudin tubes (Sarstedt ref. 04.1912.001), and 3 serum tubes (BD Vacutainer ref. 366430). After blood collection, one tube from each lot was stored at 4°C for 2 h, 4 h, and 48 h, respectively, before centrifugation. Centrifugation was performed at 1500 g for 10 min at room temperature. All frozen samples were shipped on dry ice to the “Cardiovascular Genetics” research center in Nancy for laboratory measurements. Different aliquots were prepared from each type of tube for subsequent enzyme-linked immunosorbant assay (ELISA) analysis after one, two, or ten freeze-thaw cycles. Within 2 h of the completion of the aliquot step, aliquots (100 μL) of the supernatant (serum or plasma) in polypropylene cryotubes were placed in a −80°C freezer. Serum or plasma aliquots were defrosted at room temperature and then frozen again at −80°C. For this analysis, the tubes were placed on open holders, as this method ensured the most homogeneous and rapid freeze-thawing. Freeze-thawing of samples stored in 9×9 sample boxes led to a 20 min delay in freezing between the central and peripheral parts of the sample.
PBMCs from the EDTA, ACD-A, and hirudin samples were isolated by centrifugation on a density gradient of Ficoll 15 (Ficoll-Paque™ PLUS; Amersham BioSciences) and stored at−80°C in Instapure lysis buffer [Eurogentec (E)] until analysis of VEGF165 mRNA expression, as described below.
Sixteen muscle biopsies were collected from patients suffering from muscle symptoms; all patients signed informed consent. Lidocaine was locally applied on the skin before biopsies were taken. Within 10 minutes, samples were sent by direct pneumatic tube at room temperature from the Neurologic Hospital Hospices Civils de Lyon surgery rooms to the Hospices Civils de Lyon Biological Resource Center Cardiobiotec. The minimal sample size varied between 2 to 3 cm long and 1 cm thick. Each biopsy was then split into three biopsy sections and snap frozen to −80°C in a mixture of liquid nitrogen and cold isopenthane, at 15, 30, and 60 min, respectively, after removal. In our experience, a delay of between 15 and 60 min in freezing this type of biopsy material does not significantly influence the quality of histological diagnosis. Pathological examination of selected samples did not show any sign of necrosis, inflammation, or myopathic changes. Six μm thick serial sections were cut from each biopsy section and fixed in acetone for 10 min before immunofluorescence analysis.
VEGF ELISA
VEGF was quantified in all serum and plasma samples using a quantitative sandwich enzyme immunoassay technique (Quantikine_VEGF ref. SVE00, R&D Systems, Abingdon, U.K.) following the manufacturer's instructions.
VEGF gene expression analysis
Total RNA was extracted from PBMCs with a MagNaPure automate, using the MagNA Pure LC RNA HP isolation kit and RNA HP Blood External lysis protocol (Roche Diagnostics, France). Reverse transcription of total RNA was performed using 200 units of M-MuLV reverse transcriptase with 0.25 μg of oligos (dT) (Promega, France) according to a previously described protocol. 15 Quantification of the transcripts coding for the VEGF165 isoform, and for the β-2 microglobulin control gene 16 was performed using TaqMan® and LightCycler technologies (LC TaqMan Master Kit, Roche Diagnostics, France). Duplicate aliquots of each cDNA were analyzed. RT-PCR optimization and specificity of real time-PCR products were conducted using SYBR® Green technology (LC FastStart DNA MasterPLUS SYBR Green I kit, Roche Diagnostic, France), for melting curve analysis and agarose gel electrophoresis of the PCR amplicons, as previously described. 15 Stability of the normalization gene β-2 microglobulin was assessed according to its related protocol, 16 for delay times of 2, 4, and 48 hours before centrifugation.
VEGF expression in muscle biopsies
Thawed muscle biopsy sections from each time point were stained together. VEGF staining was obtained after overnight incubation with rabbit anti-VEGF-A antibody (1/200, Clone SC-152, Santa Cruz) and 30 min incubation with goat anti-rabbit FITC secondary antibody (MSDS A10526). Fluorescence was measured from jpeg pictures shot with a Zeiss Axio Observer A1 microscope combined to a 1.3 Mega pixel Zeiss AxioCam at x200 power field using identical acquisition settings for each channel (3 s for GFP channel, 800 ms for DAPI). Fluorescence density was measured in 6 regions of interest per slide drawn manually to encompass only the cytoplasm of muscle fibers with AxioVision 4.8 software. For each time point and each biopsy, a negative control was also assessed. Mean fluorescence observed for each time point was standardized by subtracting the mean fluorescence of negative controls from the mean fluorescence of samples as described previously. 17
Statistical analyses
Descriptive statistics for VEGF levels are presented as the median, and 25th and 75th percentiles. VEGF levels, measured from different anticoagulant types and after different freeze–thaw cycle numbers, were compared using Wilcoxon's rank sum test. We considered p≤0.05 significant for differences between variables. Results are expressed as the ratio (percentage) between a given value at a specific pre-centrifugation delay and the corresponding value obtained at the 2-hour delay, or as the ratio between a value obtained at a specific number of freeze–thaw cycles and the corresponding value obtained with only one thawing. For mRNA analysis, only the pre-centrifugation delay was studied, with just one thawing of the PBMCs in all cases.
For analysis of muscle biopsies, means comparison using ANOVA test were calculated with JMP 8.0 software.
Results
Comparisons of the values of VEGF concentrations at the baseline (2 hours pre-centrifugation delay and 1 freeze–thaw cycle) were initially performed between the collection centers, and no difference was observed for any of the collection tubes used. The analysis reports the aggregated results of all donors at particular time points.
Effect of blood storage at 4°C before centrifugation on serum/plasma VEGF
VEGF recovery percentages in serum and plasma samples using different anticoagulant types and after different pre-centrifugation delays at 3°–8°C are presented in Figure 1 and Table 1. When serum samples were thawed once before analysis, there was no significant difference between 2 and 4 h or between 2 and 48 h of blood storage at 3°–8°C. There was a significant increase (124%; p=0.0009) between 2 and 48 h of serum pre-centrifugation delay when the samples were analyzed after 2 freeze–thaw cycles.
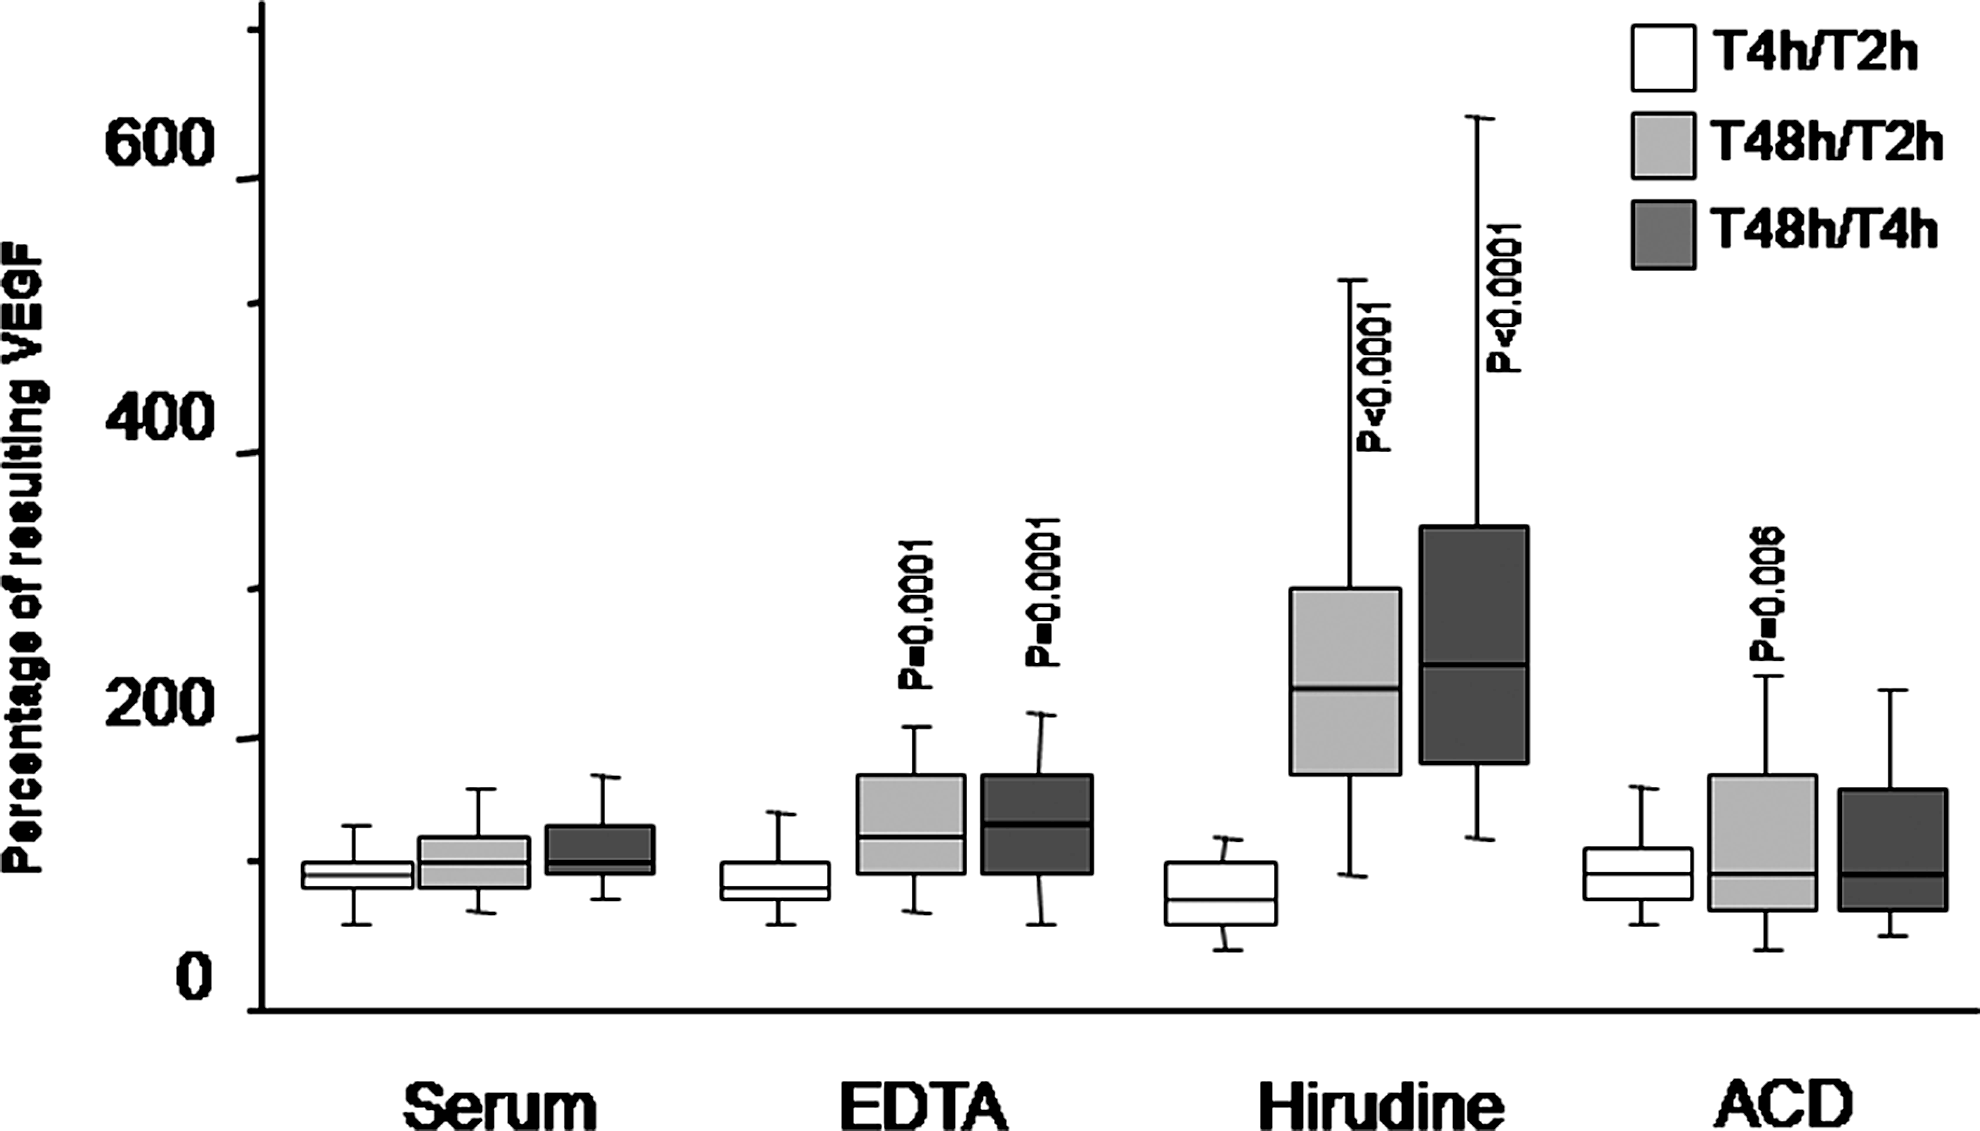
Box plot representing the effect of the period of storage at 3°– 8°C before centrifugation on the quantification of VEGF (median, 1st and 3rd quartiles). The number of freeze–thaw cycles is one. Values at time T2 correspond to 100%; p values are calculated between each ratio and the corresponding T2 value (Wilcoxon's rank test). Vertical lines correspond to the 10th and 90th centiles.
Values are expressed as the ratio (percentages) between 4 or 48 hours, and 2 hours of storage. p values are calculated between each ratio and the corresponding T2 value (Wilcoxon's rank test). ns: not significant.
In EDTA plasma samples, no significant difference was observed between 2 and 4 hour- pre-centrifugation delay, whatever the number of freeze–thaw cycles. In contrast, there was a significant increase between 2 and 48 h, for all numbers of freeze–thaw cycles.
Similarly, when using hirudin as the anticoagulant, the effect of blood storage time had no significant effect between 2 and 4 h; however, when the delay reached 48 h, a highly significant VEGF increase was observed, for all numbers of freeze–thaw cycles.
The impact of ACD on VEGF analysis was different. Although a significant increase was observed between 2 and 4 h (p=0.0046) and between 2 and 48 h (p=0.006) with only one freeze–thaw cycle, this increase was no longer detectable after multiple freeze–thaw cycles.
Effect of the number of serum/plasma freeze-thaw cycles on measured VEGF
VEGF recovery percentages in serum and plasma obtained with different anticoagulant types and after different numbers of freeze-thaw cycles are shown in Figure 2 and Table 2.

Box plot representing the effect of the number of freeze-thawing cycles (F/T) on the expression of VEGF. Period of storage at 3°–8°C before centrifugation is 2 hours (median, 1st and 3rd quartiles). Values for 1 F/T correspond to 100%. p values are calculated between each ratio and the corresponding «F/T1X» value (Wilcoxon's rank test) (median, 1st and 3rd quartiles). Vertical lines correspond to the 10th and 90th centiles.
Values are expressed as a ratio between 2 or 10 cycles and 1 cycle. The last column represents the ratio between 10 and 2 cycles. p values are calculated between each ratio and the corresponding T2 value (Wilcoxon's rank test). ns: not significant.
The VEGF level in serum was not affected by the number of freeze–thaw cycles whatever the delay of blood storage at 3°–8°C after sampling.
VEGF levels in EDTA plasma significantly increased with the number of freeze–thaw cycles and this increase was similarly observed for the three blood storage delays. The VEGF increase was greater after 10 (p<0.0001) than after 2 (p=0.0046) freeze–thaw cycles.
VEGF levels in hirudin plasma remained the same after 1 and 2 freeze–thaw cycles and showed a slight increase after 10 cycles (p=0.005 and 0.008 for storage delays of 2 h and 48 h, respectively).
The most important effect of freeze–thawing was observed in ACD plasma. Between 1 and 2 cycles, a very significant increase was observed (p<0.0001) at 2 h and 4 h time points. Interestingly, this increase was less significant when considering the 48 h delay (p=0.0047 and 0.0029 when comparing 1 to 2 cycles, and 1 to 10 cycles, respectively).
Effect of blood storage at 3°–8°C on VEGF expression
There was no significant variation in the VEGF/β-2 microglobulin expression ratio in PBMCs isolated and stored 2 vs. 4 h at 3°–8°C after blood sampling (Fig. 3). In contrast, a very significant increase was observed after 48 h of blood storage, as compared to 2 h, with the three anticoagulants (EDTA and hirudin: p=0.0003; ACD: p<0.0001).
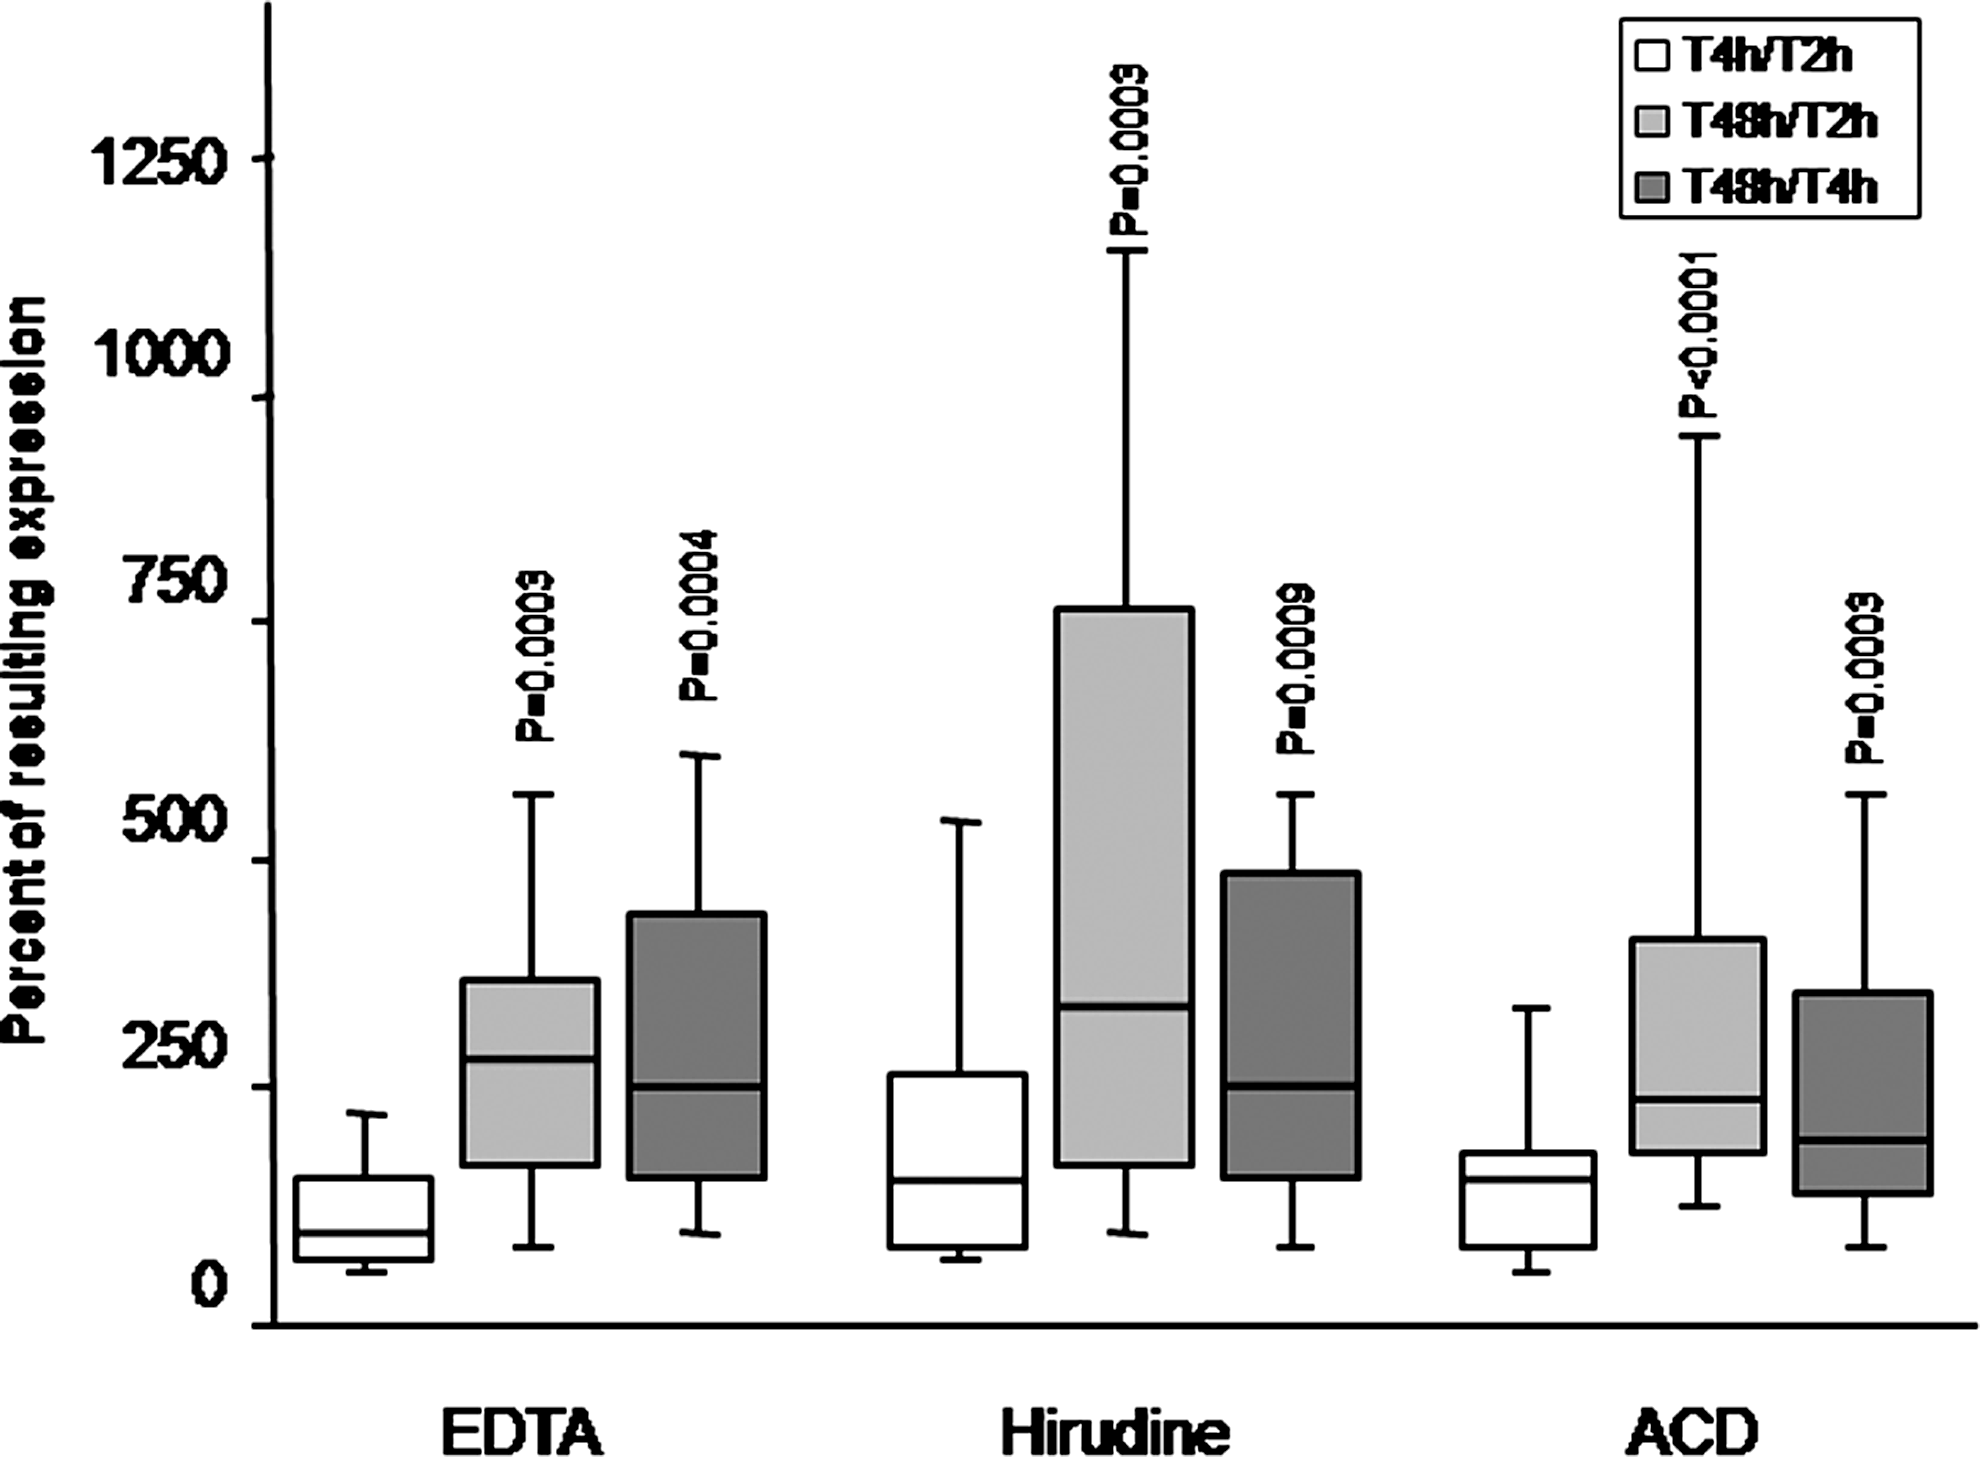
Box plot representing the effect of the period of storage at 3°– 8°C before centrifugation on the expression of VEGF165/β-2 microglobulin. The number of freeze-thawing is of 1. Values at time T2 correspond to 100%. p values are calculated between each ratio and the corresponding T2 value (Wilcoxon's rank test) (median, 1st and 3rd quartiles). Vertical lines correspond to the 10th and 90th centiles.
Effect of the blood collection tube type on circulating VEGF levels
Plasma circulating VEGF levels were significantly different depending on the collection tube type used. The measured levels were significantly higher in serum than in any type of plasma (p<0.0001). Among the three different types of plasma, VEGF levels were significantly higher from blood collected in EDTA tubes than from hirudin tubes (p<0.0001), or in ACD tubes (p=0.0002) (Table 3).
Values are expressed as the median and (the first and third) inter quartiles; *p value<0.0001, ¥p value=0.0002.
Effect of freezing delay on VEGF protein expression levels in muscle tissues
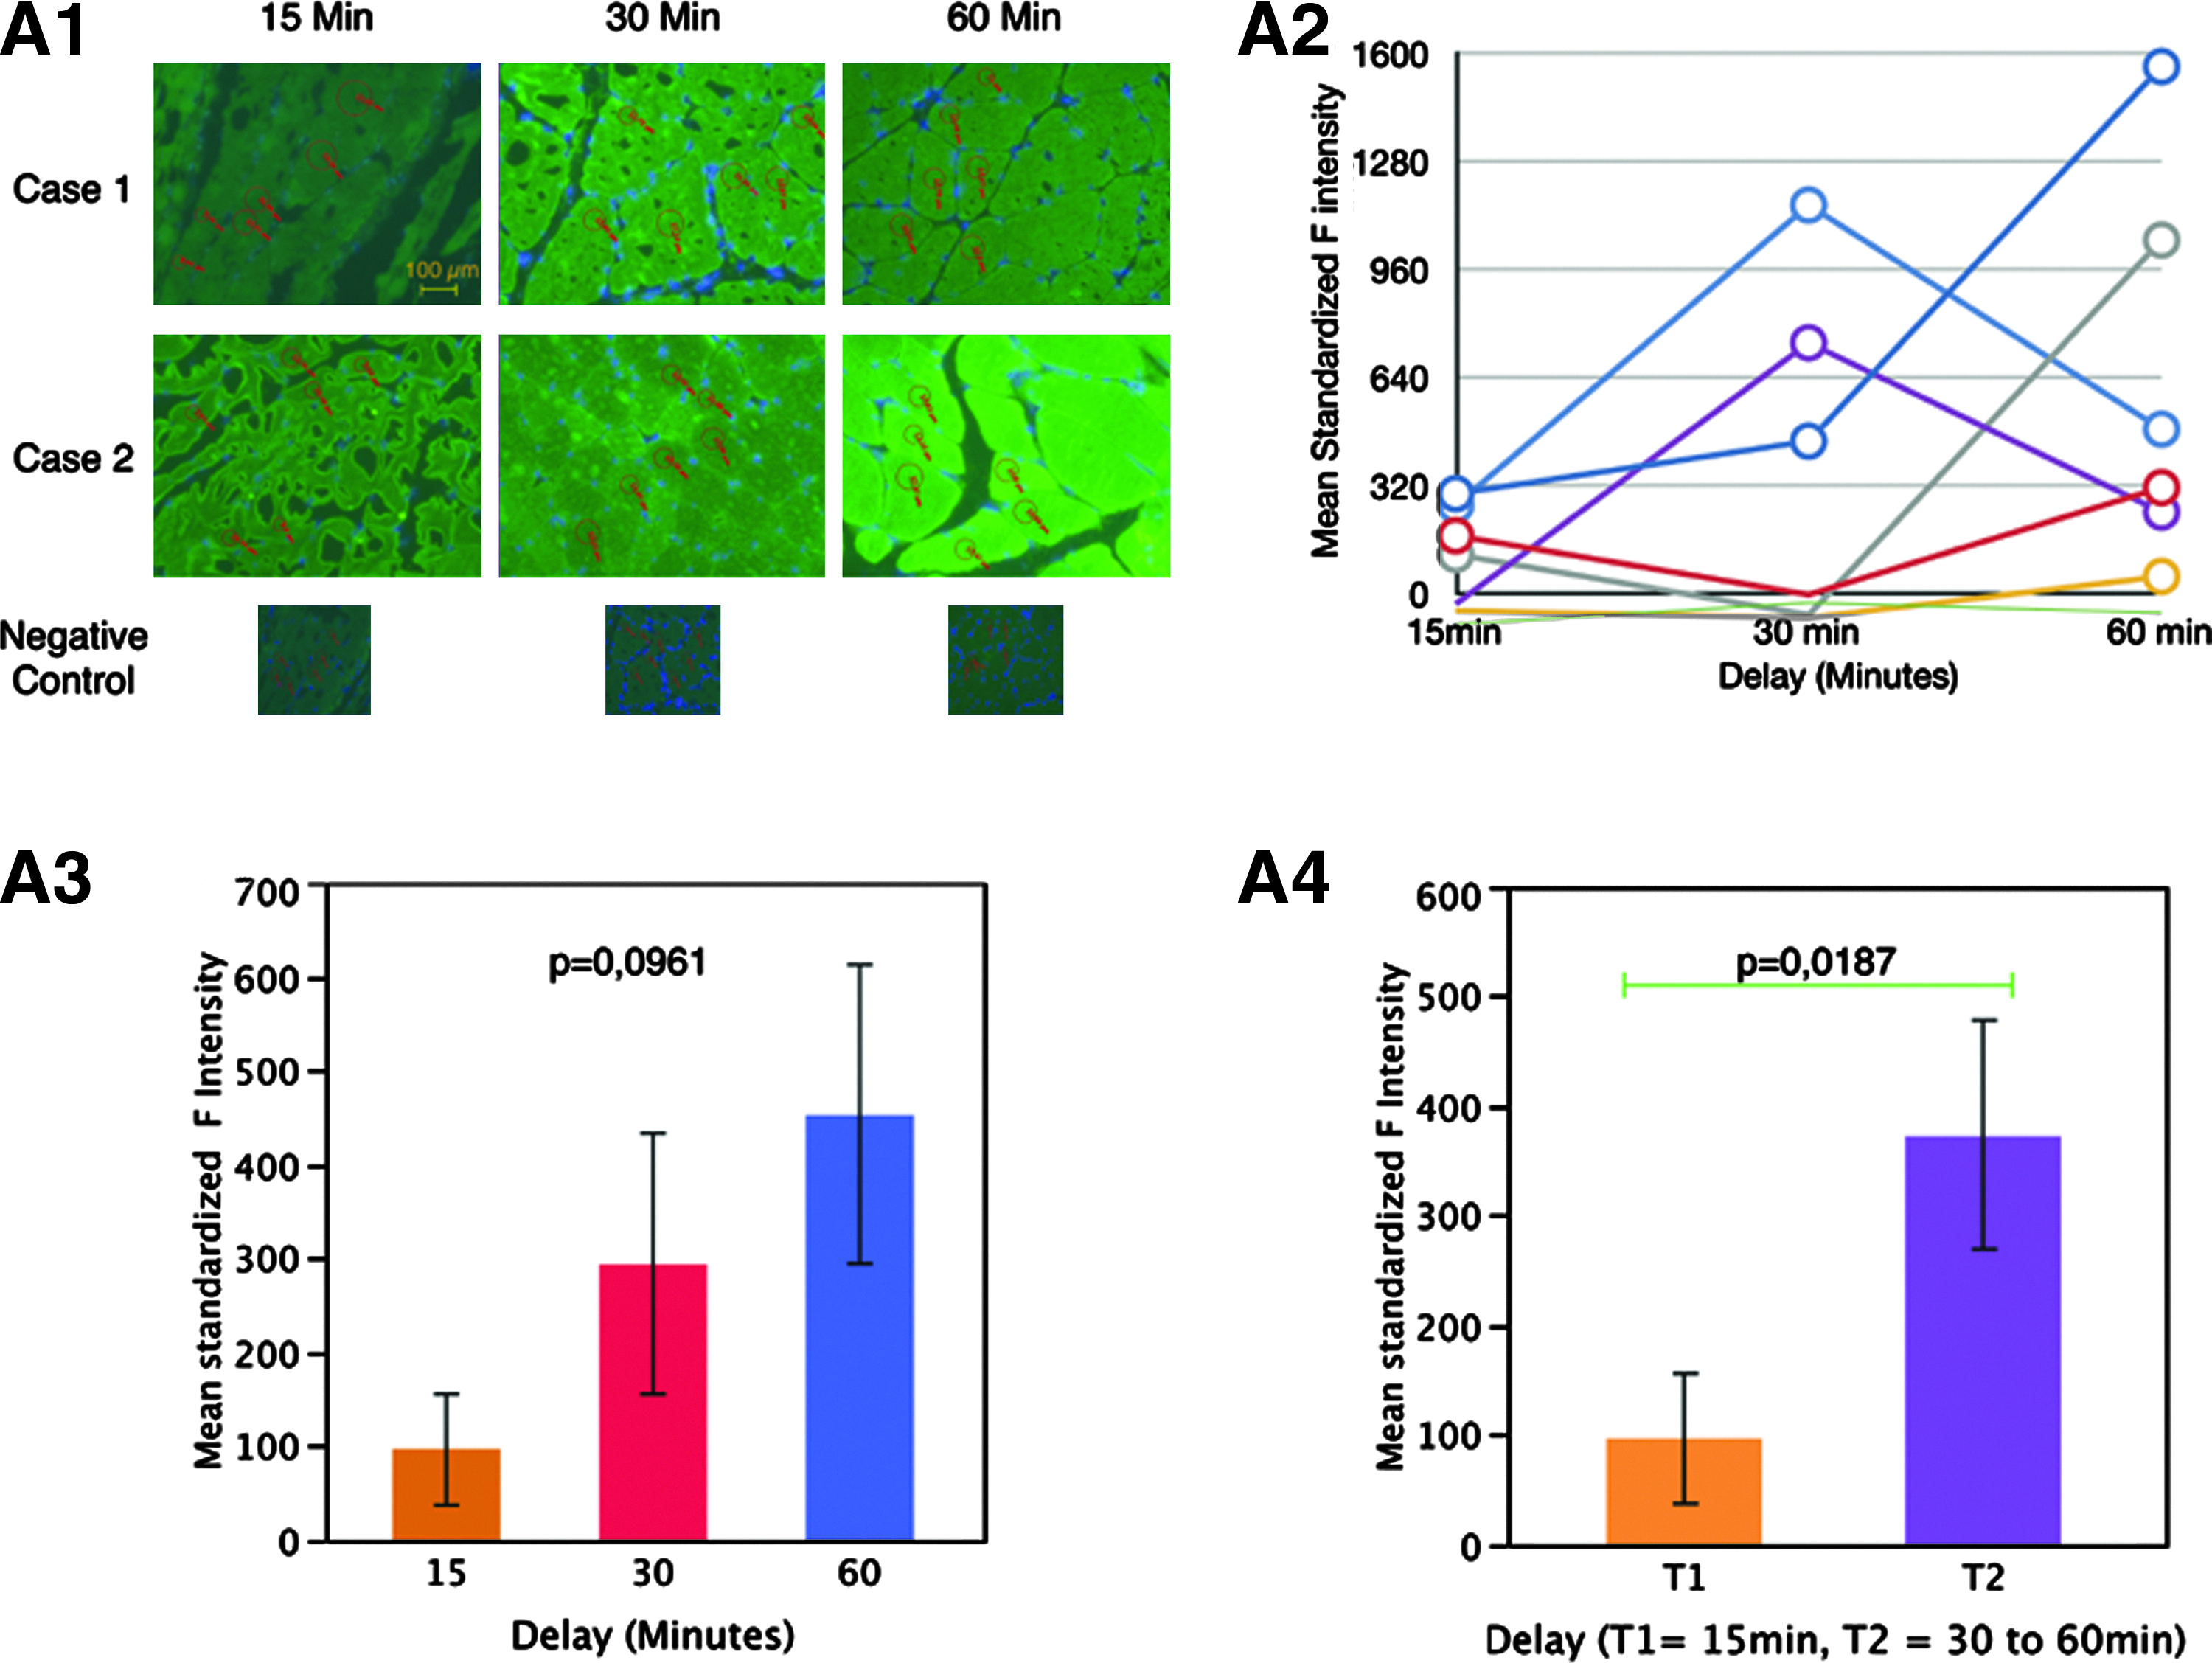
Mean standardized fluorescence from VEGF-A stained muscle biopsy sections frozen after the 3 different time delays showed a trend to increase with time from 15 to 60 min but with a peak of expression varying from one sample to another, either at a 30 or 60 min delay (Fig. 4A1, 4A2, and 4A3). Despite a trend to increase, mean standardized fluorescence intensities reflecting VEGF expression were not significantly different among the 3 time points (p=0.0961). Combining 30 and 60 min time points, we proved a significant variation in mean standardized fluorescence reflecting higher levels of VEGF expression after a 30 min delay before freezing the sample (p=0.0187) (Fig. 4A4). Although baseline levels of VEGF expression evaluated by optical density ranged between 0 and 320, peak levels under hypoxic condition reached higher values, from 50 to 1600.
Discussion
VEGF has been proposed as a possible prognostic biomarker in several cancers,18–22 as a predictive biomarker for response to treatment in chronic inflammatory diseases,6,23 and as a physiological marker of vascular remodeling and growth regulation.24–26 Reference values for healthy and diseased individuals must be determined to allow correct interpretation of patient laboratory reports. Moreover, these values need to be reproducible from one laboratory to another, which means that pre-analytical and analytical parameters should be well defined.
In the present study, we have shown that VEGF measurements in serum and in plasma containing different anticoagulants are not comparable. The concentration of VEGF in serum was higher than in all plasma samples using different anticoagulants, and it was not significantly affected by the number of freeze–thaw cycles nor by storage delay at 3°–8°C before centrifugation. When serum is collected for clinical immunological analyses, blood usually coagulates at room temperature for at least 30 min. 27 However, for the purposes of this study, all pre-centrifugation delays were performed at 4°C, and the coagulation after 2 h at 4°C was completed.
Using anticoagulants, VEGF values increased after 2 freeze–thaw cycles. There was an even higher increase after 10 freeze–thaw cycles in EDTA and hirudin plasma samples. However, although significant increases represented only 20% in EDTA and hirudin plasma, more than 2 times higher VEGF was recovered in ACD plasma, after only 2 freeze–thaw cycles. This could be due to a better preservation of platelets in ACD, and thus, to a greater cumulative release of VEGF from platelets as they were lysed at each freeze-thaw cycle. Better preservation of platelets in ACD may also explain the fact that pre-centrifugation delays induced a lower VEGF increase in ACD than in EDTA or hirudin plasma. When ACD plasma is collected for analysis of coagulation factors, blood is usually centrifuged at a higher g force and a second centrifugation reduces the number of platelets. 28 However, for the purposes of this study, platelet-rich plasma was used with all types of anticoagulants tested, including ACD.
VEGF was much higher in serum than in any anticoagulant-collected plasma and this was probably due to a massive VEGF release from platelets during the coagulation process in the first 30 minutes after blood collection. This is in accordance with the work conducted by Banks et al. 11 who have shown that VEGF increased in a first step during clotting, and the maximal increase was obtained after complete coagulation of the samples. Therefore, VEGF measured in serum does not correspond only to circulating but also to intracellular VEGF.
We have now shown that the blood storage period before centrifugation has a significant influence on VEGF levels in three types of anticoagulant tubes. Hetland et al. 6 have reported that after 1 and 2 h of blood storage at room temperature, EDTA plasma VEGF levels increased by 34% and 80%, respectively, in healthy individuals, and by 28% and 64%, respectively, in rheumatoid arthritis patients. They found no differences after 2–9 freeze–thaw cycles, but an unexpected decrease of 8% after the 10th cycle. This could be due to uncompleted freeze–thaw cycles. Indeed, in our experiments, we first established the protocol for complete freeze–thawing of the samples at each cycle, as we observed that both the type of holding device (completely open or partly closed like a box), the position of the tubes (whether central or peripheral), and the delay time were crucial to obtain a homogeneous, complete freeze–thaw cycle of a panel of tubes. Alternatively, the VEGF protein could have been damaged during the experiment, depending on the protocol used. Contrary to our results, Svendsen et al. 29 have reported no difference in VEGF levels between EDTA and citrated plasma. Very recently, it was shown that VEGF in serum decreased after freeze-thawing. 13 However, in this study, thawing was performed at 37°C and this may have induced VEGF degradation by proteolysis. Thus, different parameters such as thawing temperature and duration, and the condition of each freeze–thaw cycle may significantly modify the interpretation of results. Interestingly, the same pattern of VEGF increase was observed in nontumor tissues after only 15 min of cold ischemia.
For clinical research, gene expression signatures can be used to better define biological processes related to disease or treatment outcome. Peripheral blood is the most easily accessible and the most reliable specimen to be used for this purpose. 30 For gene expression profiling of peripheral blood to become a routine clinical diagnostic tool, it is critical to better understand the factors affecting gene expression signatures in PBMCs. Use of PBMCs as representative material for high-throughput analysis of gene expression is currently being explored. 15 These cells are involved in a wide variety of diseases, including infection and cancer. 15 Moreover, in some studies, characteristic sets of transcriptional changes in PBMCs were associated with physiologic or pathologic states. Therefore, a PBMC transcriptome may be used as an individual's health sensor, a concept referred to as the sentinel principle. 15 In this study, we have addressed for the first time the effects of pre-analytical factors such as different anticoagulants and blood sample storage delays before centrifugation, on VEGF165 mRNA expression in PBMCs. Expression of the VEGF165 isoform was chosen for study as Kruizinga et al. 7 recently showed that a single VEGF isoform, VEGF165, is representative of VEGF isoforms 121, 165, 183, and 189. VEGF165 is also the most abundant isoform of VEGF. 1 Previously, it was shown that in peripheral blood cells, the β-2 microglobulin transcript is more stable than other housekeeping genes transcripts. 31 The ratio of expressed VEGF/β-2 microglobulin did not change between 2 and 4 h of blood storage, whatever the anticoagulant used. An important increase occurred between 4 and 48 h of blood storage, possibly due to activation of hypoxia-related expression pathways in PBMCs. The correlation between PBMC gene expression and circulating VEGF was influenced by specimen collection method with VEGF gene expression increased in plasma collected with all types of anticoagulants. In order to validate these results, we verified that β-2 microglobulin remained stable under all experimental conditions of this study.
Baechler et al. 32 have shown that gene expression profiles from fresh peripheral blood samples are significantly different from those of samples shipped overnight. They observed higher VEGF levels after overnight incubation of blood at room temperature. Debey et al. 30 have proposed that signaling events associated with hypoxia and stress responses might be induced in peripheral blood samples analyzed after a delay. The same mechanism would explain the increase in tissue VEGF levels observed over increasing cold ischemia delays. Consistent with this concept, VEGF also participates in some physical responses to hypoxia with higher expression levels seen after overnight incubation of blood.32–34 In solid tissue, the variability of VEGF expression is a direct response to hypoxia. The increase of VEGF expression is under the control of a direct effector of hypoxia, hypoxia inducible factor 1 (HIF1α), whose pathway targets the expression of many other genes with local pro-angiogenic effect, such as stromal cell-derived factor alpha (SDF1α), vascular endothelial growth fador receptor-1, and fibroblast growth factor-2 (FGF-2). In addition, the stabilization/degradation balance of these proteins at normoxia is changed under hypoxic conditions. 35 Despite the standardization of VEGF expression, in our analysis of muscle biopsies using immunofluorescence, there was intrinsic variability in VEGF levels between all samples. In addition, there was a peak effect of VEGF expression between the 30 and 60 min time points. This result means that it is not possible to predict the biological quality of a sample, (i.e., biological changes related to freezing delay and hypoxia) by only evaluating VEGF expression. Therefore new strategies are needed to better characterize the level of «degradation» of a single nontumor tissue sample. An option would be to rely on the analysis of multiple factors from these pathways.
Evidence also indicates that the handling of blood samples and the method of cell processing can induce changes in the inflammatory pathway gene expression patterns. 36 For example, Duvigneau et al. 37 observed that isolated PBMCs from EDTA-anticoagulated blood have higher cytokine gene expression than PBMCs from heparinized blood samples in their animal (pork) model. Similarly, EDTA-anticoagulated blood has been used to measure the production of cytokines at the protein and RNA levels upon stimulation with tetanus.38,39 The study of Isaksson et al. 40 demonstrated that different laboratory tube types did not have significant influence on VEGF mRNA stability. This finding may be explained by different processing delays. The type of anticoagulant used may not influence VEGF gene expression shortly after blood collection but the differential effect may become visible after longer blood storage delays.
Finally, our results suggest that the best conditions for measuring both circulating VEGF and its gene expression are to reduce time between blood collection and centrifugation, and to avoid multiple freeze–thaw cycles. In the present work, we could not decipher if a specific sample collection tube type was better than the others tested. Serum is the most stable, but we have to take into account that values are also due to intracellular release. The optimal conditions for measuring nontumor tissue VEGF levels are to freeze the tissue within 15 min following excision.
Footnotes
Acknowledgments
This study was supported by an IBiSA [Infrastructures en Biologie Santé et Agronomie] grant (call for proposals IBiSA CRB 2008). We are thankful to Charles Coleman for his constant interest in our work, to Eudeline Alix for technical assistance, and Dr. Nathalie Streichenberger for her help in sample collection.
Author Disclosure Statement
All authors declare no conflict of interests.