
Abstract
The quality of RNA preserved in different stabilization matrices was investigated after 2 weeks of storage at room temperature. RNA samples in RNAstable (Biomatrica), GenTegra (IntegenX), and RNAshell (Imagene) were compared to RNA stored at −80°C (the current gold standard for RNA preservation) and with liquid or dried RNA stored at room temperature without additives in this multi-center study. One center prepared all of the RNA samples, and five participating laboratories applied the samples to the matrices and stored them for 2 weeks at room temperature. Samples were shipped to three testing laboratories, where the 336 RNA samples were rehydrated and then analyzed for RNA recovery, purity, and integrity. Parallel RNA quality analyses and real-time PCR analyses were performed at each of the three testing laboratories. Each of the RNA matrices tested was shown to be fit-for-purpose for short-term room temperature storage in terms of total RNA recovery and rRNA integrity. All but one of the matrices was judged to be fit-for-purpose for mRNA integrity when assessed by real-time PCR analysis. In a follow-up study, RNase-contaminated samples were shown to provide accurate real-time PCR results when stored for up to 3.5 months in either RNAshell or RNAstable.
Introduction
Three RNA RT° storage matrices are commercially available: GenTegra (IntegenX), RNAstable (Biomatrica), and RNAshell (Imagene). Biomatrica and IntegenX have developed RNA storage systems that utilize simple microcentrifuge tubes or 96-well plate formats, whereby RNA in solution is mixed with the stabilization matrices, then samples are dehydrated and stored at RT°, thus protecting the RNA from hydrolysis and nuclease degradation.5,6 The Imagene product uses an alternative RNA preservation system whereby RNA is dried and encapsulated under anhydrous and anoxic conditions in metal RNAshells, thereby protecting RNA from oxidation. 7 These three RT° storage technologies are based on the principle of anhydrobiosis, the capacity of some multicellular organisms to survive for years or decades in the complete absence of water but to revive after rehydration.
In order to obtain reliable and accurate RNA and gene quantification, it is essential to control preanalytical variables related to sample storage conditions (e.g., storage duration, additives, vials, temperature, etc.), 8 not only those related to biospecimen collection, handling, and processing. In this multi-center study, the efficiency and fitness-for-purpose of RT° short-term storage and shipment systems to preserve RNA integrity, recovery, and gene expression was assessed. A period of 2 weeks at RT° was chosen because it is sufficient for common world-wide shipments.
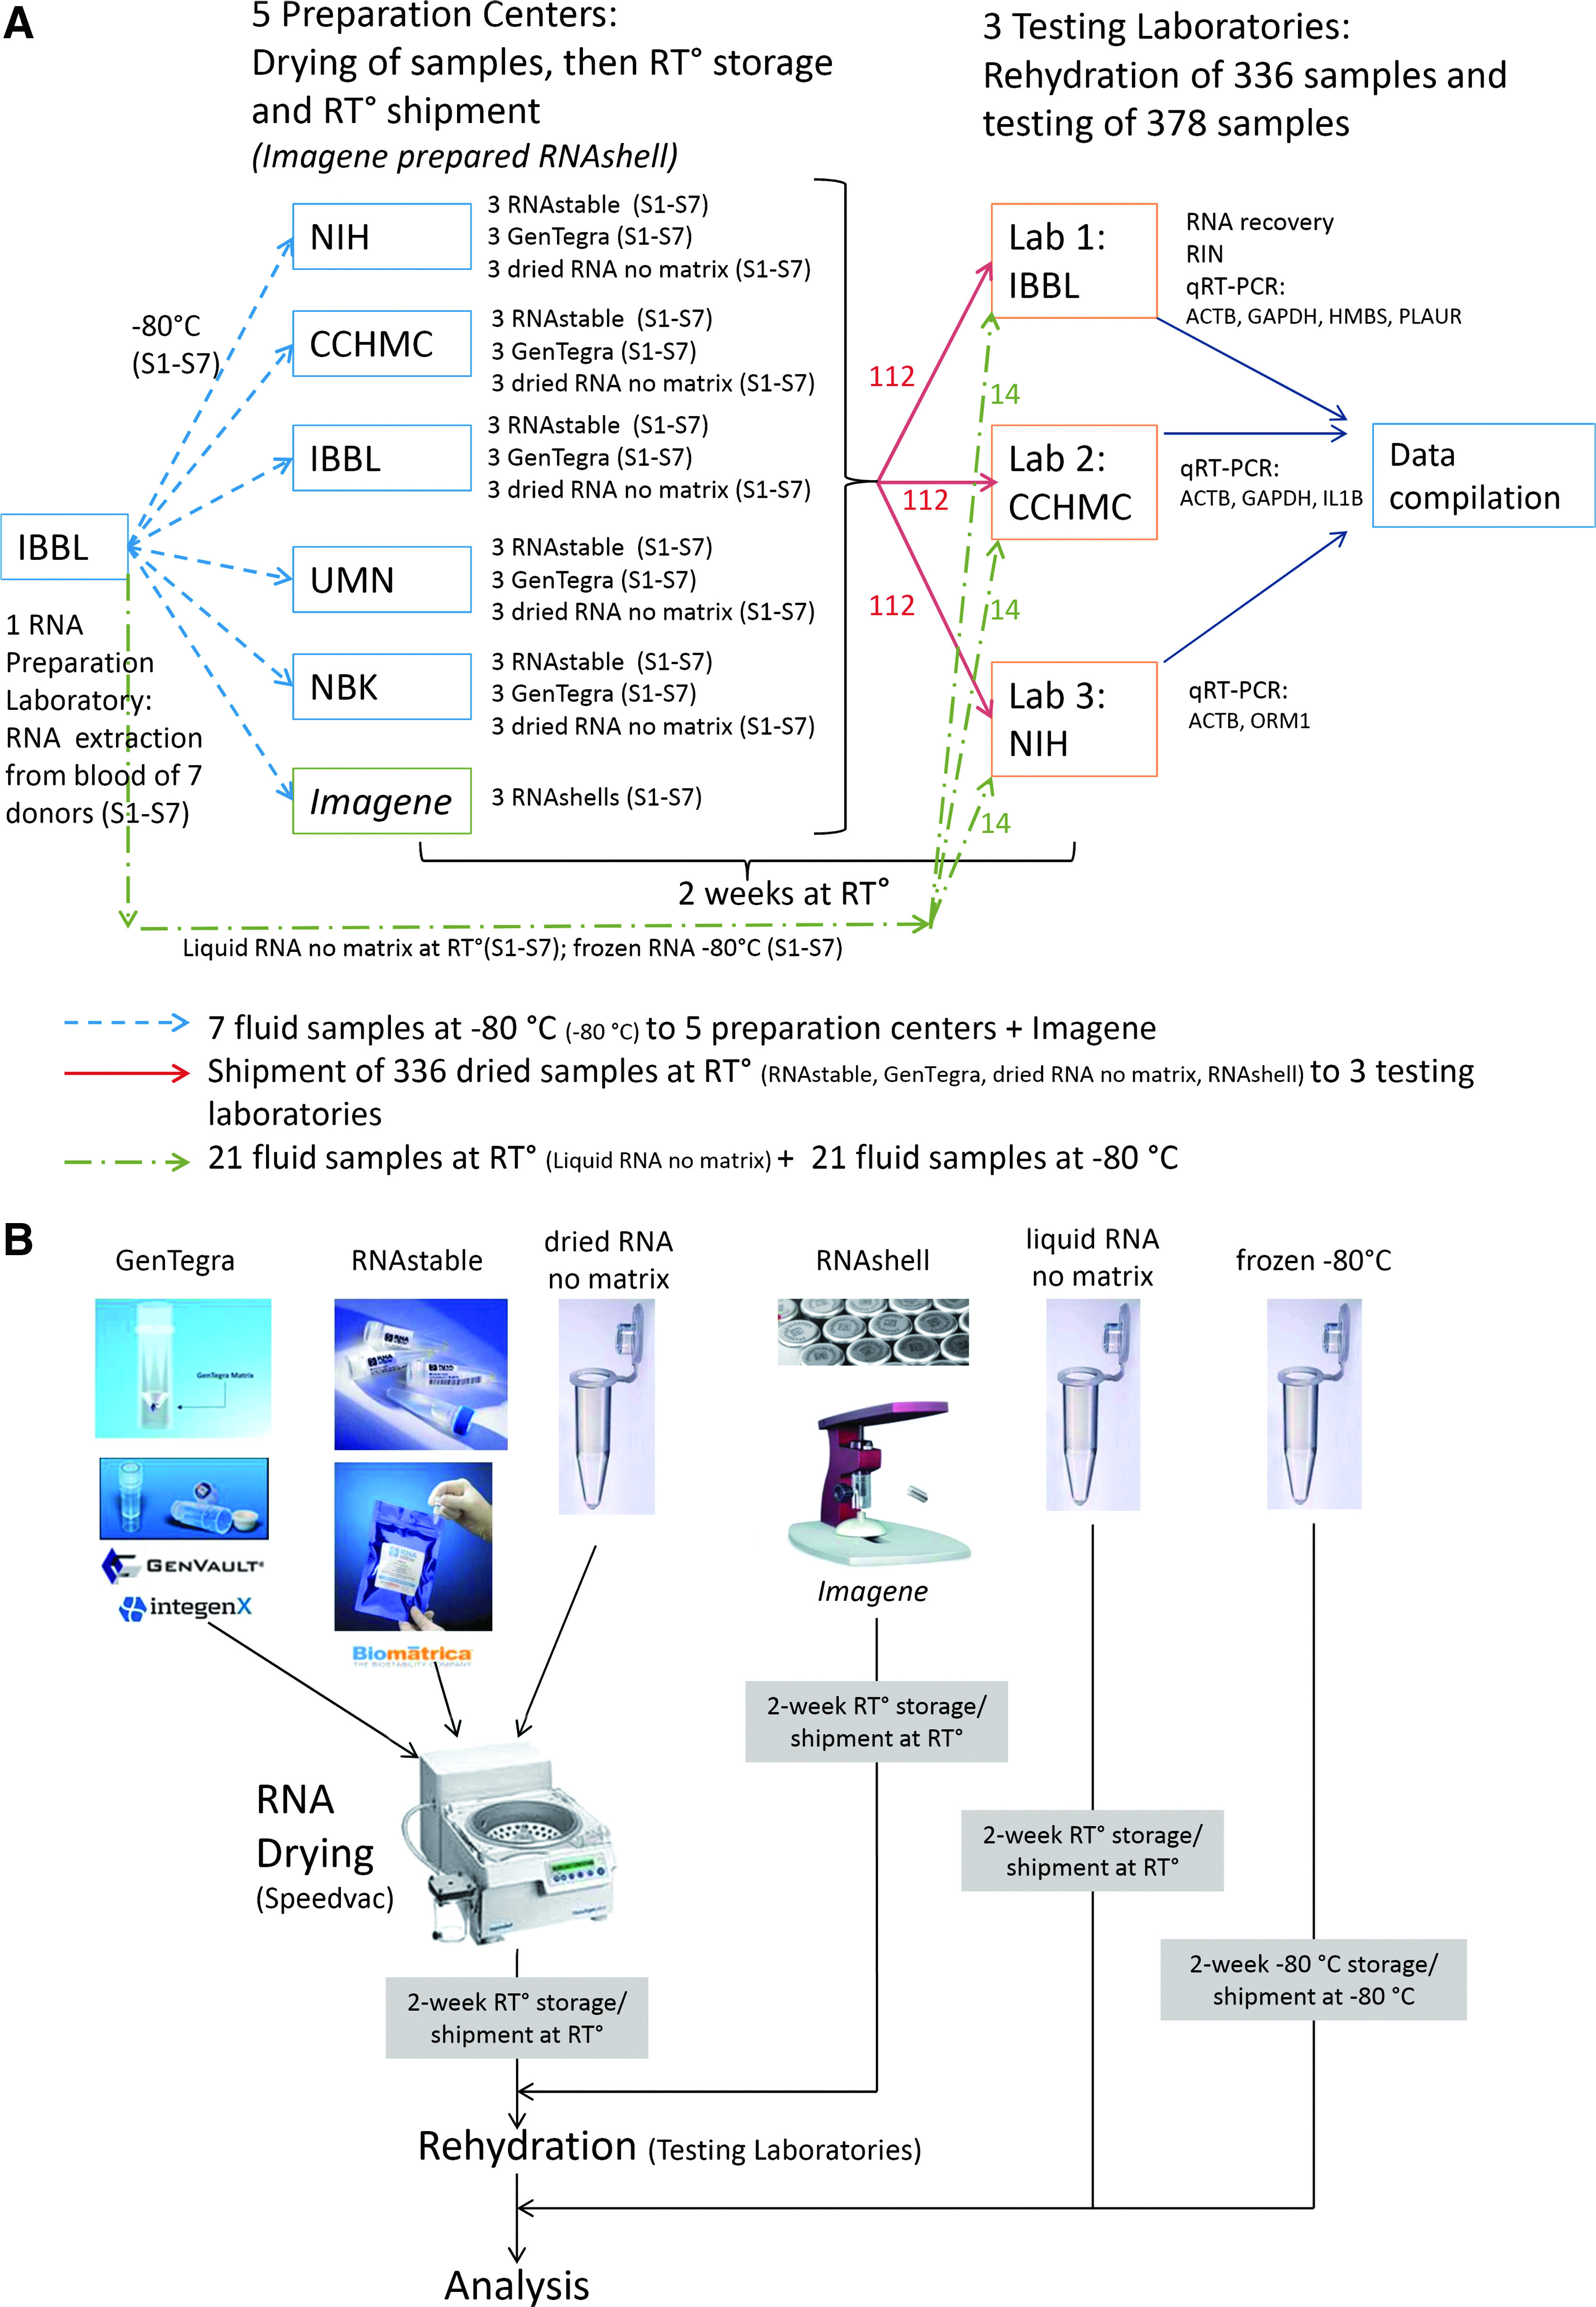
One center prepared RNA from 7 human blood samples and shipped the RNA to 5 international centers (Fig. 1A). At these 5 centers, the RNA was aliquoted into the RT° storage matrices: RNAstable, GenTegra, and the control condition “dried RNA no matrix” (Fig. 1B). RNA in RNAshells was prepared by the manufacturer (Fig. 1B). Dried RNA samples were stored at RT° for 2 weeks, and then shipped to 3 testing laboratories at ambient temperature where the samples were rehydrated and assessed for RNA recovery, RNA Integrity Number (RIN), and gene quantification by real-time PCR (Fig. 1A). The RT° storage systems GenTegra, RNAstable, and RNAshell were compared to three controls: (a) RNA stored at −80°C (the current best practice); (b) RNA dried without matrix (“dried RNA no matrix”) stored at RT° to investigate whether dehydration is sufficient for high quality RNA preservation; and (c) liquid RNA stored at RT° (“liquid RNA no matrix”) to assess the kinetics of the natural degradation process of RNA at RT°.
Study design.
Materials and Methods
Materials
Biomatrica (San Diego, CA) supplied RNAstable 25-Tube kits (ref. 93221-001; lot nb. 41D162) and GenVault (IntegenX, Pleasanton, CA) supplied GenTegra RNA 25-Tube kits (ref. GTR5025-S; lot nb. 1009160830), and Imagene (Evry Cedex, France) supplied RNAshells®.
RNA extraction
Informed consent from donors was obtained prior to collection (CNER Ethics Protocol ID 201107/02). 25 ml of blood from each of 7 healthy human volunteers was collected in PAXgene Blood RNA tubes (BD Biosciences, Erembodegem). PAXgene tubes were stored at RT° for 2 h before automated RNA extraction on QiaCube (Qiagen, Venlo) with the PAXgene Blood RNA kit (PreAnalytiX, Venlo; ref. 762174) at IBBL (Integrated BioBank of Luxembourg). For each donor, extracted RNA concentration was adjusted to 50 ng/μl. RNA samples were stored at −80°C prior to shipment on dry ice to the 5 preparation centers.
RNA sample processing for RT° storage
The 5 preparation centers performed parallel RNA processing following the manufacturers' instructions. 20 μl of RNA/tube (1 ug RNA) was aliquoted into RNAstable, GenTegra, and empty RNase-free tubes (“dried RNA no matrix” and “liquid RNA no matrix”). Samples were incubated for 5 min at RT°, mixed and dried in a speedvac without heat for 2 h for GenTegra and “dried RNA no matrix”, and for 1 h for RNAstable. Immediately after drying, all RNA tubes were recapped. RNAstable tubes were packed in heat-sealed pouches containing desiccant. Dried RNA samples were stored for 2 weeks at RT° (18°–28°C). RNAshells were prepared with 20 μl of RNA/shell by the manufacturer. The dried samples were then shipped at ambient temperature to the testing centers where the RNA samples were rehydrated with RNase-free water.
RNase contamination of RNA samples
RNA from donor 3 was extracted and half of the volume contaminated with RNases by contact with human skin for 3 seconds. The quantity of added RNases was not determined. The RNA samples were immediately analyzed for RIN. Aliquots of contaminated and pure RNA were prepared for −80°C and RNAstable, and stored for 1, 2, 3.5, and 12 months, while RNAshell and “liquid RNA no matrix” were stored for 1, 2, and 3.5 months. Samples were stored at RT° except for the −80°C condition. At the specified time points, samples were rehydrated and analyzed for RIN, and by real-time PCR for ACTB and ORM1 expression (Lab 3, see below).
RIN analysis
RNA integrity was assessed by capillary gel electrophoresis with RNA 6000 Nano kit on a 2100 Bioanalyzer (Agilent). RNA Integrity Number (RIN) values were calculated by the Agilent software algorithm.
RNA quantification
RNA samples were quantified by spectrophotometry on a Take3 plate in a Synergy Mx instrument (BioTek) before and after dehydration. For GenTegra and RNAstable samples, the spectrophotometer was blanked with RNase-free water containing their respective matrices in solution. RNA purity was measured by OD260/OD280 and OD260/OD230 ratios.
Reverse transcription and real-time PCR
All RNA samples were reverse-transcribed and analyzed by real-time PCR for high abundant [ACTB (beta-actin) and GAPDH (glyceraldehyde-3-phosphate dehydrogenase)] and low abundant [HMBS [hydroxymethyl-bilane synthase, alias PBGD] housekeeping genes, and low abundant genes PLAUR (plasminogen activator, urokinase receptor), IL1B (interleukin-1 beta), and ORM1 (orosomucoid 1). All 3 laboratories followed their standard real-time PCR protocols, described below. All Cq values were compared to the −80°C controls (ΔCq).
Lab 1
Four μl of total RNA (equivalent to 0.2 μg total RNA) from each sample in the different storage matrices was reverse transcribed into cDNA using the SuperScript® III First-Strand Synthesis SuperMix (Life Technologies Europe BV, Gent, Belgium) on a thermal cycler (Bio-Rad). Reference RNA (Clontech) was run in parallel to control for the reverse transcription efficiency. Ten times diluted cDNA was amplified using the Fast SYBR Green Master Mix (Life Technologies) and 300 nM primers (Table 1; Sigma-Aldrich, Belgium) in 20 μl reactions in a 7500 Fast Real-Time PCR System (Life Technologies) (40 cycles: 15 sec at 95°C and 1 min at 60°C). The No Template Control (NTC) assay was run in parallel and technical triplicates were performed. The specificity of the PCR amplicons was controlled by melting curve analysis.
commercial Taqman probes from Applied Biosystems.
Lab 2
RNA was reverse transcribed using oligo(dT) from the iScript Select cDNA Synthesis Kit (BioRad, Hercules, CA). The reverse transcription was performed in a 20 μl volume at 42°C for 60 min. Real-time PCR reactions were performed in duplicate in 96-well plates using the iCycler Thermal Cycler (BioRad). The 20 μl reactions consisted of 10 μl of 1X iQ™Supermix, 500 nM of each primer (Table 1), 4 μl of cDNA template, and water.
Lab 3
Reverse transcription was conducted on RNA samples using TaqMan High Capacity cDNA Reverse Transcription Kit (Applied Biosystems), with random hexamers, according to the manufacturer's protocol. RNA was used at 4 μl except for the re-cleaned samples (see below) for which 12 μl was used per 20 μl reaction. All real-time PCR reactions were processed on an ABI 7500 real-time PCR machine in triplicate. cDNA was used at 1.6 μl volume per 20 μl reaction with cycling conditions (1 cycle of 50°C for 2 min, followed by 95°C for 10 min, 50 cycles of 95°C for 15 sec, followed by 60°C for 1 min). Controls consisting of sterile molecular grade water were negative in all runs. ACTB (Hs03023880_g1) and ORM1 (Hs01590791_m1) probes were both purchased from Applied Biosystems, Inc.
RNA re-cleaning
RNA samples stored at −80°C or with the RNAstable and GenTegra matrices were cleaned with the PicoPure RNA Isolation kit (Arcturus Engineering, Inc. Mountain View, CA) to investigate the ability to amplify the RNA stored in GenTegra. Experiments were performed in Lab 3. Briefly, 18 μl of each sample was diluted with 32 μl water in a 0.5 ml microcentrifuge tube and then the manufacturer's protocol was followed for RNA isolation. Roughly 18 μl of re-cleaned RNA was produced from each sample and 12 μl of purified RNA was used for reverse transcription and real-time PCR.
Statistical analysis
Statistical analysis was performed with SigmaPlot using the Shapiro-Wilk test for normality testing. When the normality test failed, an ANOVA1 test on ranks (Kruskal-Wallis) was executed followed by Dunn's test for multiple comparisons versus the −80°C control condition. When the normality test passed, ANOVA1 was followed by a Holm-Sidak test where conditions were compared to the −80°C control group.
For comparisons between donors, the all pairwise multiple comparisons method (Tukey test) was applied.
The coefficient of variation between donors, for each laboratory and each gene, was calculated to give the inter-donor variability for real-time PCR.
Combined uncertainty was determined according to the Guide to the expression of Uncertainty in Measurement (GUM).
9
Combined uncertainty between the three testing laboratories was calculated using the following formula:
Results
Total RNA recovery and purity
To evaluate the RNA recovery, quantification was performed on samples prepared with each of the matrices before drying and after rehydration (Fig. 2A). Inter-individual recovery for the same storage condition did not significantly change from donor to donor (data not shown). RNA recovery from RNAstable, GenTegra, and RNAshell ranged from 96% to 106% and was not significantly different from the −80°C control condition. Dried RNA samples stored with no matrix for 2 weeks at RT° showed the lowest, and the only significantly different, RNA recovery percentage (81%).
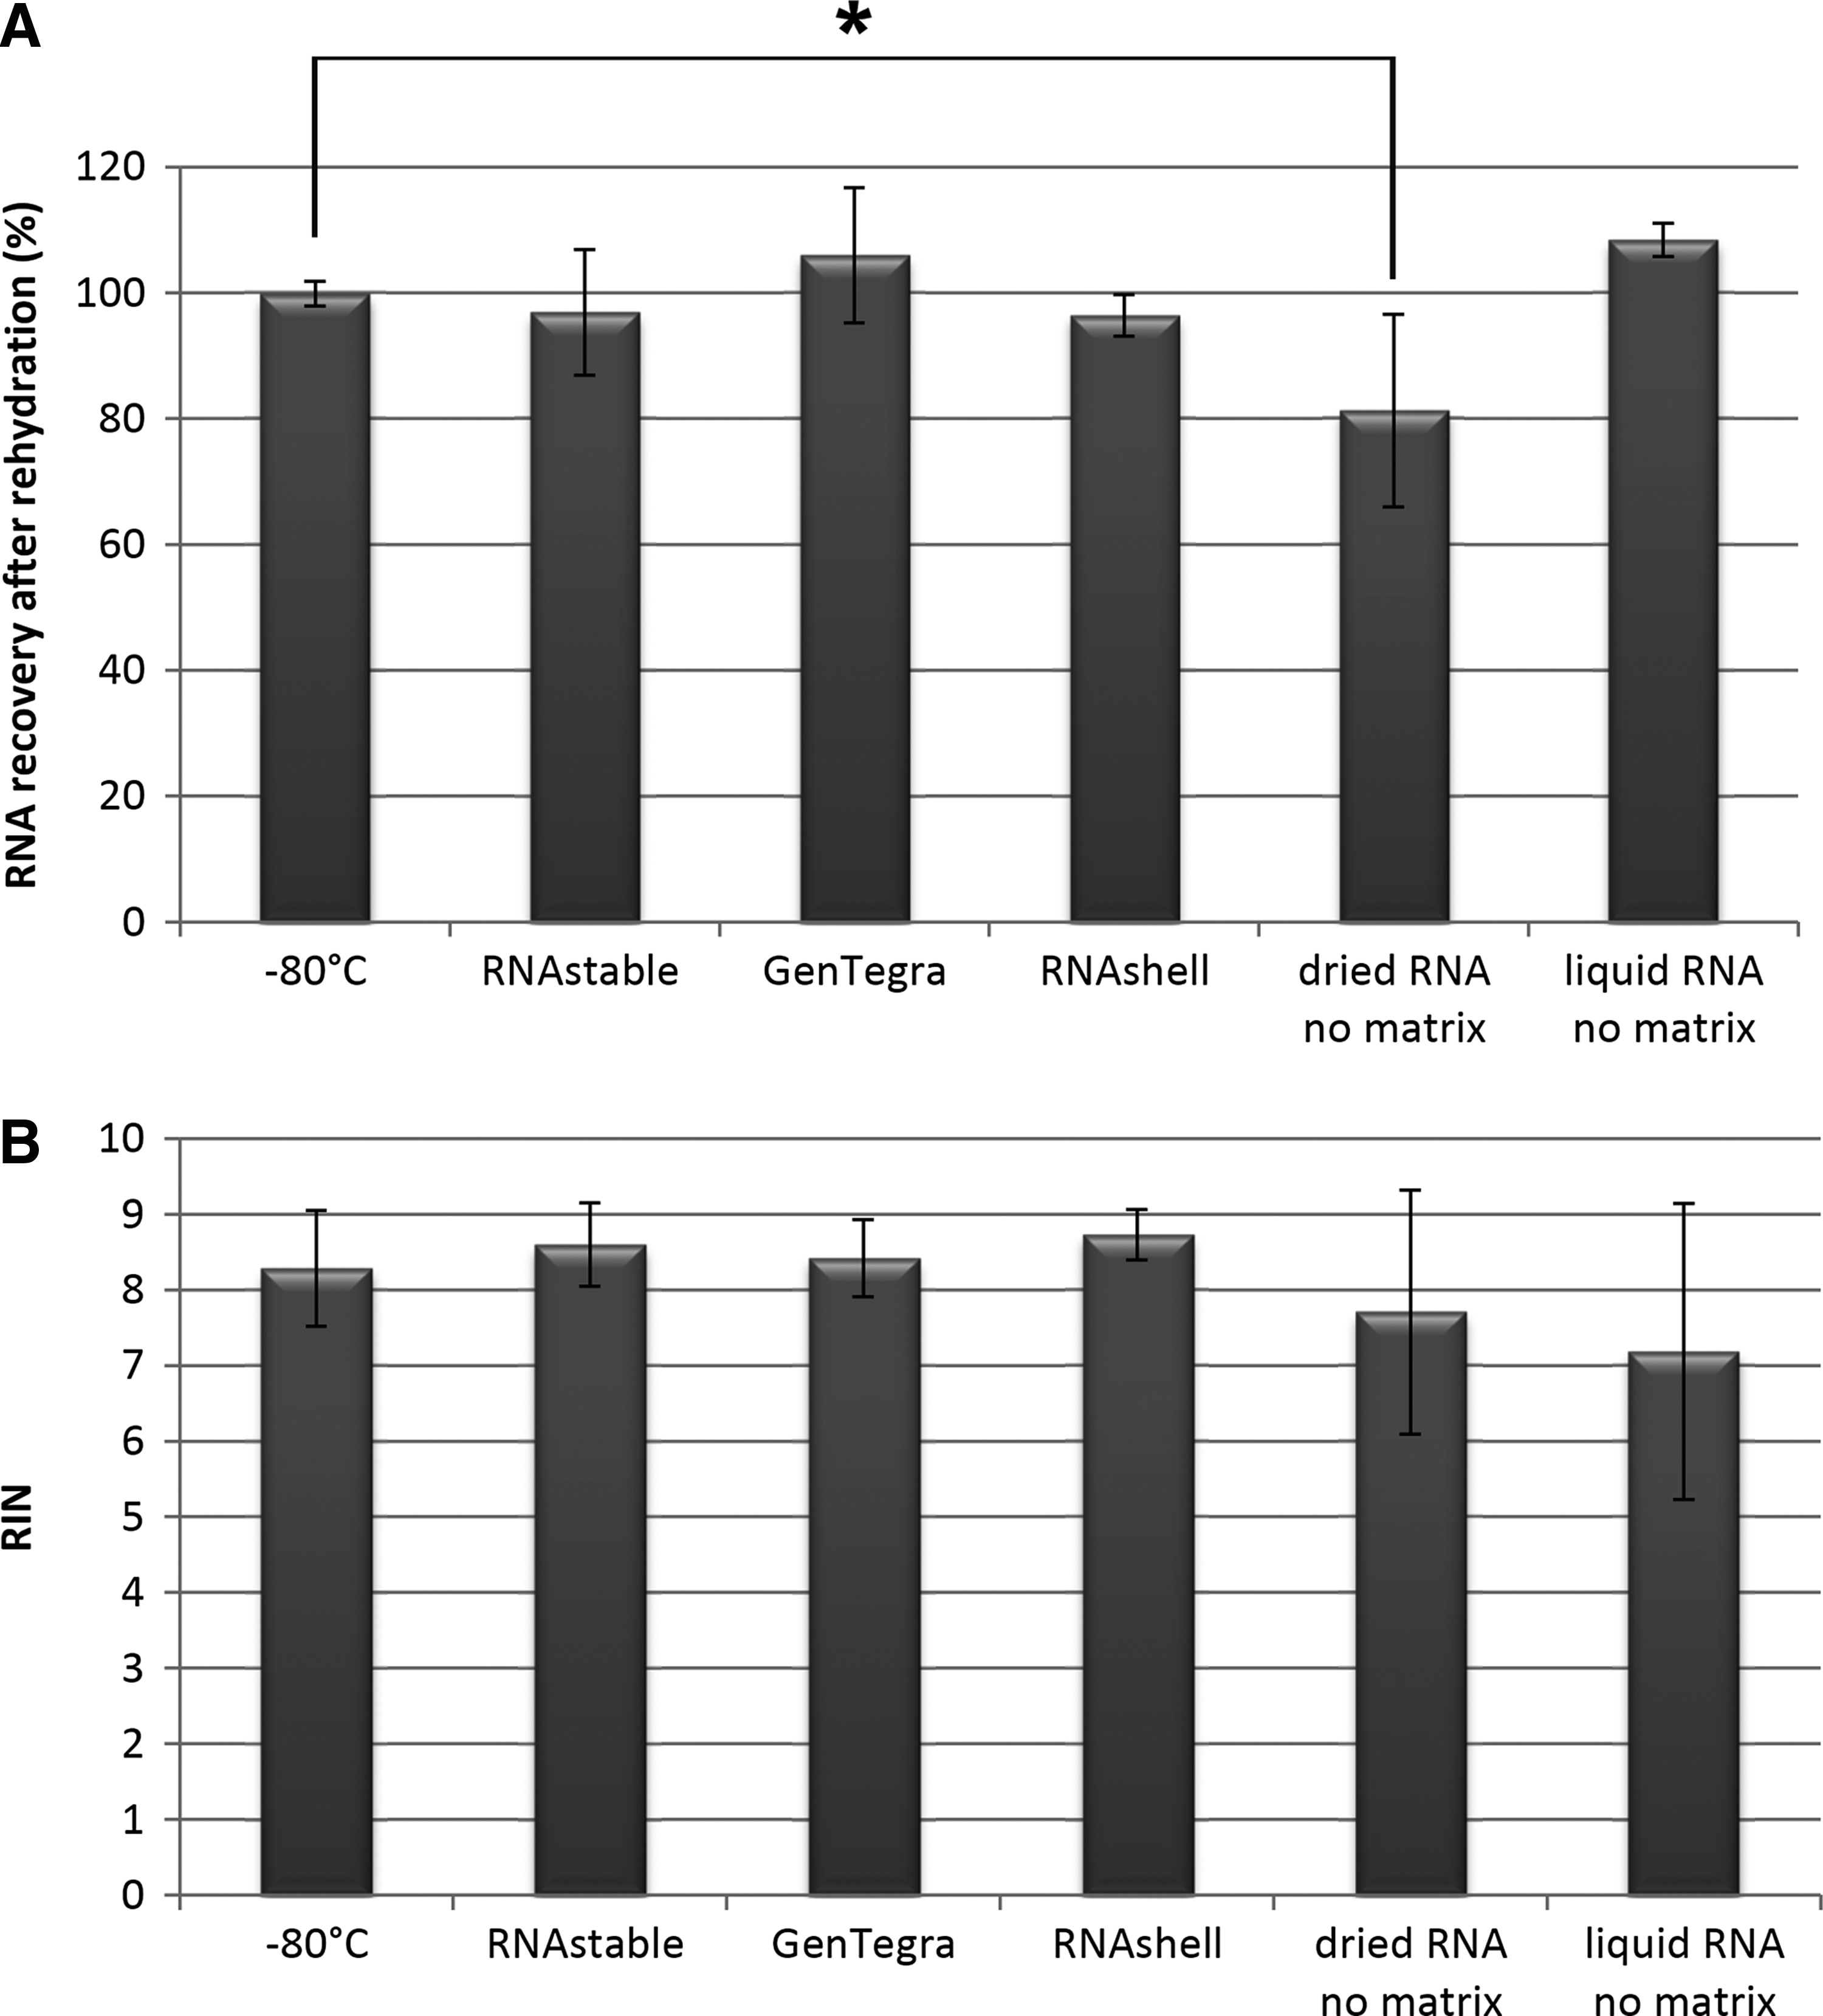
Total RNA recovery and rRNA integrity after a 2-week storage under six different RT° storage conditions.
RNA purity showed average 260/280 ratio values between 1.9 and 2.1 for five of the conditions (RNAstable, RNAshell, −80°C, “dried RNA no matrix”, and “liquid RNA no matrix”). However, the 260/280 ratio was only 1.2 for the RNA samples stored in the GenTegra matrix. The 260/230 ratio values were highly variable among conditions, and also among the samples in each condition. These 260/230 ratio values were 0.5±0.1 (standard deviation) for RNAstable, −0.3±4.7 for GenTegra, 1.0±0.2 for RNAshell, 1.2±0.2 for “liquid RNA no matrix”, and 3.4±3 for “dried RNA no matrix”.
rRNA integrity assessment by RIN
Ribosomal RNA integrity was assessed by determining the RNA Integrity Number (RIN; Fig. 2B) 10 using an Agilent Bioanalyzer. All donor RNAs in different storage conditions gave RIN values>7 and sharp 28S and 18S rRNA peaks. When all RT° storage conditions were compared to the −80°C control, no significant differences were detected, indicating that the rRNA integrity was not affected when total RNA was stored for 2 weeks in the matrices. The RIN values were >8 for RNAshell, RNAstable, and GenTegra; whereas the RIN values were 7–8 for “liquid RNA no matrix” and “dried RNA no matrix”. The RT° storage without matrix (whether liquid or dry RNA) showed higher analytical variation in RIN measurements. Data obtained in the “dried RNA no matrix” condition suggested that RNA drying in the absence of any stabilizing compound did not impact rRNA integrity when analyzed by a Bioanalyzer.
mRNA integrity assessment by real-time PCR quantification
Because the RNA was prepared from each donor separately and then aliquoted in different storage conditions, any difference in real-time PCR cycles (delta cycle quantification (ΔCq)) reflects differences in the storage conditions rather than the original gene expression. Each laboratory followed its best practice real-time PCR protocol. Data were analyzed for each storage condition (Table 2) and graphed separately for each of the 3 testing laboratories (Fig. 3A–3C).

Messenger RNA quality assessment by real-time PCR under six different storage conditions. ), HMBS ( ), and PLAUR (■). ) and IL8 (■).
Lab 1 and Lab 2 used SybrGreen technology, Lab 3 used TaqMan assays. For the conditions RNAstable, GenTegra and “dried RNA no matrix” standard deviation (SD) was calculated for each gene on 35 data points (5 samples for 7 donors). For the conditions −80°C, RNAshell and “liquid RNA no matrix” standard deviation (SD) was calculated for each gene on 7 data points (7 donors, each data point investigated in technical replicates). ΔCq is the difference in Cq between the test condition and the −80°C condition. ΔCq values from different genes showed low variability within the same storage condition, suggesting that all G investigated genes had similar PCR performance and intra-laboratory average quantification for all analyzed genes could be calculated (“all genes ΔCq”).
Overall, the −80°C condition gave the best real-time PCR quantification results in testing laboratory 1 (Table 2 and Fig. 3A). RNAstable and RNAshell showed real-time PCR Cq values similar to those of RNA samples stored at −80°C (ΔCq of +0.11 and +0.18, respectively (all genes ΔCq values are highlighted in Table 1)), for “liquid RNA no matrix” and “dried RNA no matrix” samples; the average Cq values increased by 0.54 and 0.64, respectively, compared to the −80°C control condition. For RNA stored in the GenTegra matrix, high Cq values were detected for all genes; an increase of +6.45 ΔCq was detected compared to the −80°C conditions.
Real-time PCR data from the second testing laboratory showed the same trend (Table 2 and Fig. 3B). RNAshell and RNAstable performed equivalently to the −80°C control. For the “dried RNA no matrix” condition, the Cq values were 0.2 Cq lower compared to Cq values of the “liquid RNA no matrix” condition, and both conditions were within 1 Cq (ΔCq of +0.74 and +0.95, respectively) when compared to the −80°C condition. In contrast, the ΔCq was +12.97 for the RNA samples stored in GenTegra.
The real-time PCR data from the third testing laboratory (Table 2 and Fig. 3C) showed that the storage system RNAstable gave the best gene quantification results (ΔCq of −0.07), followed by −80°C, RNAshell (ΔCq of +0.33), and “dried RNA no matrix” (ΔCq of +0.39). Compared to −80°C, “liquid RNA no matrix” showed a value of 1.55 Cq, higher than the −80°C control, and the GenTegra aliquot was significantly higher by +11.23 Cq.
Statistical analysis of real-time PCR data among all storage conditions showed that only the comparison of GenTegra to −80°C resulted in a significant difference; this was observed for all 6 of the analyzed genes in each of the 3 testing laboratories. In addition, the difference of “liquid RNA no matrix” versus −80°C control condition was statistically significant only for gene ACTB tested in laboratory 3 (Fig. 3A–3C).
Inter-laboratory variability
To get an inter-laboratory overview of real-time PCR quantification results for the different RT° storage conditions, average Cq values and combined uncertainty for ACTB were calculated, as this gene was analysed in all 3 laboratories (Table 3). In general, results among laboratories were concordant even if each testing laboratory followed its own real-time PCR procedure. After 2 weeks of storage in RNAstable or RNAshell, very similar real-time PCR results were obtained when compared to RNA that was stored at −80°C (ΔCq of +0.03 and of +0.05, respectively). The Cq for the negative control “dried RNA no matrix” only increased 0.56 Cq; this showed that RNA dried without stabilization matrix was also amplifiable by real-time PCR. RNA stored in liquid state without matrix at RT° presented a 1.32 Cq higher value when compared to the −80°C control. In this study, the GenTegra samples had Cq values that were consistently higher (+11.37 Cq) than the negative control “liquid RNA no matrix”.
For the conditions RNAstable, GenTegra and “dried RNA no matrix”, the mean Cq values were calculated from 3×35 samples (3 laboratories, each laboratory tested 5 samples from 7 donors. For the conditions −80°C, RNAshell and “liquid RNA no matrix”, the mean Cq values were calculated from 3×7 samples (3 laboratories tested one sample from 7 donors). ΔCq is the difference in inter-laboratory mean Cq between the condition and the −80°C condition.
Real-time PCR analytical variability for ACTB from the three testing laboratories for the different storage conditions was the lowest for “dried RNA no matrix” (combined uncertainty: 1.04), followed by RNAstable (combined uncertainty: 1.33), “−80°C” (combined uncertainty: 1.40), RNAshell (combined uncertainty: 1.90), and “liquid RNA no matrix” (combined uncertainty: 2.44). Analytical variability was highest for RNA stored at RT° in the GenTegra matrix (combined uncertainty: 7.92) (Table 2).
RNA RT° stability study of pure and RNase-contaminated samples
As liquid RNA storage for 2 weeks at RT° was not contraindicated for real-time PCR, a second phase of this study investigated the RNA quality after storage for up to 3.5 months at RT°, by RIN measurement and real-time PCR gene quantification. Moreover, RNA samples contaminated with skin RNases were analyzed to assess the efficiency of the RT° storage systems.
For pure RNA, all the RIN values for RNAshell, RNAstable, and −80°C remained >7 for all time points (GenTegra was not assessed) (Fig. 4A). Only the condition “liquid RNA no matrix” showed significant degradation of pure RNA after 1 month, as the RIN value decreased from 7.5 (intact RNA) to 3.2. After 3.5 months in the condition “liquid RNA no matrix”, the RIN value could not be determined (N/A). These results confirm the 2-week stability study and additionally show that RNA integrity was preserved for at least 3.5 months when pure RNA was stored in RNAshell, RNAstable, or at −80°C. Furthermore, RNA integrity is preserved for as long as 12 months with the RNAstable matrix (the only RT° condition besides −80°C storage assessed for 12 months).
Time-course study of RNA quality under different RT° storage conditions following contamination with RNase. Pure and RNase-contaminated RNA samples from the same donor were stored under four conditions: frozen at −80 °C, RNAstable, RNAshell, or “liquid RNA no matrix”. ), 2 (), 3.5 (■), or 12 ( ) months. N.d., not done (experiment was not performed); N/A, not applicable, RIN could not be calculated from the electropherogram by the Agilent 2100 Expert software. ), 2 (), 3.5 (■), or 12 () months. N.d., not done. ), 2 (), 3.5 (■), or 12 () months. N.d., not done.
RNase contamination of RNA immediately resulted in a decrease in RIN values from 7.5 (intact RNA) to 4.1 just prior to application of any storage condition (Fig. 4A). Contaminated RNA preserved for 1 month in RNAshell gave the highest RIN (5.6) of all RNase-contaminated samples, but RIN at the 3.5-month time point could not be determined. RIN values for RNAstable, −80°C, and “liquid RNA no matrix” were low (between 4.6 and 1.2). The analytical variability of RIN measurements is known to be high (F. Betsou, personal communication). A clear time-course tendency could only been seen for “liquid RNA no matrix” stored at RT°, where rRNA integrity decreased continuously. Contaminated RNA preserved for 12 months in RNAstable resulted in a RIN value of 2.2, highly similar to the −80°C condition with a RIN value of 2.8.
Real-time PCR data for ACTB and ORM1 showed similar expression profiles as a function of the storage conditions (Figs. 4B and 4D, respectively). The stability study of ACTB gene quantification in pure RNA samples showed minimal quantification differences between 1-month-old samples and 3.5-month-old samples or even 12-month-old RNAstable and “−80°C” samples. Surprisingly, for pure RNA stored in RNAshell, a 0.4 lower Cq value was detected after 3.5 months storage. For “liquid RNA no matrix”, Cq levels increased by 0.72 Cq (from Cq 17.71 to Cq 18.43) over 2.5 months. For contaminated samples, there was a sharp increase in Cq levels over time for the condition “liquid RNA no matrix” [ΔCq ACTB of +5.35 (from Cq 28.14 to Cq 33.49)]. This increase in Cq was much higher than for pure samples stored in “liquid RNA no matrix” (+0.72 Cq). Thus, the difference in amplification cycles between pure and contaminated RNA for each of the three time points was used to estimate the degradation rate of liquid RNA at RT°. At the 1-month time point, the difference was 10.4 Cq; at 2 months, the difference increased to 12.82 Cq; and at 3.5 months, a 15.06 cycle difference was attained. These data suggest that RNA degradation under these conditions increases exponentially and can be expressed by the equation 541.09 e1.27x (R 2 =0.982) (Fig. 4C). After 3.5 months in storage, real-time PCR quantification showed that contaminated RNA in RNAshell performed equally as well as the −80°C storage (+0.06 ΔCq ACTB; +0.13 ΔCq ORM1), whereas RNAstable showed a visible Cq increase (+1.72 ΔCq ACTB; +1.32 ΔCq ORM1) when compared to the −80°C control (Figure 4B, D).
GenTegra
The cause of the low real-time PCR performance observed for all GenTegra samples (cf. Fig. 3) was further investigated for genes ACTB and ORM1 (Table 3). To assess whether a constituent of the GenTegra matrix was interfering with the real-time PCR reaction, the quantity of RNA used for cDNA preparation was increased 3-fold for all samples and showed, as expected, ACTB Cq values which were 1.2 Cq and 1.1 Cq lower, respectively, for the conditions “−80°C” and RNAstable; (ORM1 Cq values were 1.4 and 1.6 Cq lower) compared to the initial cDNA input. However, for the GenTegra samples, the ACTB Cq values increased by 17.7 cycles (Cq=46) (ORM1 Cq values were not detectable); suggesting an inhibitory effect of the GenTegra matrix on some step of the analytical process. By performing RNA sample clean-up, the Cq values for the GenTegra samples diminished by 21.7 cycles and eventually were measurable for ORM1. For RNAstable and −80°C samples, the purification resulted in slightly increased Cq values, most likely because sample purification caused detectable RNA quantity loss.
Discussion
In this study, our objective was to assess the fitness-for-purpose of RT° RNA storage matrices for use in the context of the ISBER proficiency testing schemes which require intercontinental shipments of RNA. 11 We assessed the 2-week stability of RNA at RT° which corresponds to roughly three times the longest shipment duration in the proficiency testing schemes. These findings can also be extended to any biobanking application where shipment of RNA is needed.
RIN measurement is now broadly implemented in the scientific community as the common RNA quality control tool that provides an unambiguous and comprehensive index of the overall RNA quality of the starting material.10,12 In general, samples with RIN values ranging from 10.0 to 7.0 are considered good quality. 13 However, even RIN values as low as 4 resulted in good gene microarray data. 14 RIN essentially evaluates the global ribosomal RNA integrity and is not the most sensitive RNA quality control tool, also reported by Bustin et al., 15 because there is no direct correlation between ribosomal RNA and degradation of a specific messenger RNA. Bioanalyzer RIN values also do not provide information on RNA purity or potentially inhibitory substances. It is important to stress that there is no standardized RNA quality metric that can be used as a strict threshold for RNA applications, as variables such as downstream protocol, analysis platform, and specificity/sensitivity of the kits, have to be considered. Therefore, the goal of the present study was to compare various storage matrices using different RNA quality metrics, and not to set absolute recommendations.
Nucleic acids differ in their resistance to degradation. Compared to DNA, RNA is more easily cleaved in mild alkaline solutions 16 and at high temperatures. 17 Surprisingly, in terms of oxidation, RNA has been shown to be more resistant to oxidative stress than DNA; 18 this might explain why liquid RNA and dry RNA without matrices at RT° both performed surprisingly well in our experiments. Besides oxidation and hydrolysis, the most important factor for RNA degradation is the presence of ribonucleases (RNases). These are either endogenous RNases, released during the harvesting of the cells, or exogenous RNases, added involuntarily during sample handling. In our study, endogenous RNases were inactivated by the RNA-stabilizing solution of the PAXgene Blood RNA tube, thus resulting in highly pure RNA samples with high rRNA integrity (RIN>7) and high mRNA quality even after 2 weeks of RT° storage in liquid conditions. These data are contradictory to the common opinion that RNA degrades rapidly at RT° which probably originates from a period when the RNA extraction kits were not yet optimized. Increased RNA recovery percentages were detected for the GenTegra condition and for the liquid RNA stored without matrix. Actually, RNA recovery percentages above 100% might result from spectrophotometric analytical variability, but RNA recovery percentages above 100% for RNA stored in RT° storage matrices have already been reported.2,19 Our study showed that pure extracted RNA is stable in solution for up to 2 months at RT° and that successful real-time PCR experiments with liquid RNA stored for 3.5 months at RT° could even be performed. These results are in agreement with a recent RNA degradation study by Opitz et al. 20
Und., undertermined.
In all three of the RNA RT° storage matrices that we tested, RNA was stored in the dehydrated state so as to prevent enzymatic reactions. Our results showed that simply by dehydrating RNA without any matrix, in clean RNase-free tubes, it was possible to preserve rRNA and mRNA integrity for high-quality-demanding downstream applications.
After 2 weeks of storage at RT°, RNA stored in RNAstable or RNAshell, and RNA stored dry or liquid without matrix were shown to preserve rRNA integrity and mRNA quality for downstream real-time PCR. Only the GenTegra technology gave unsatisfactory real-time PCR results, which were worse than for liquid RNA stored at RT°, our negative control. Further investigations strongly suggested a real-time PCR and/or RNA to cDNA conversion inhibitory effect of the GenTegra matrix. RNA stored in GenTegra tubes was not degraded as shown by high RIN values (Fig. 2B) and gel electrophoresis (data not shown), but RNA was impure, as assessed by RNA purity ratio measurements. Both 260/280 and 260/230 ratio values for RNA stored in GenTegra matrices were lower and less reproducible than in other conditions studied. At the end of our experiments, we communicated our results to the suppliers. The GenTegra supplier concluded that there had been a batch error in the production of the GenTegra tubes. A small test of new GenTegra tubes resulted in much better real-time PCR data. The GenTegra tubes have previously been successfully used in microarray and real-time PCR applications.21,22 Dried RNA in GenTegra tubes and dried RNA stored at 25°C showed similar actin real-time PCR Cq values when assessed after 2 weeks of storage, suggesting that RNA samples stored in GenTegra matrices are in general fit for real-time PCR amplification. 19
Preliminary results from a deliberate addition of skin RNases and longer times in RT° storage showed that storage of low quality RNA requires an absolutely RNase-free environment for liquid RNA storage at RT°, as RNA degradation rates, indirectly assessed by RIN and real-time PCR quantification, increase rapidly in RNase-contaminated samples. Interestingly, for initially pure RNA stored in liquid state without additives at RT°, intermediate RNA integrity (RIN 4) could be determined after 2 months of storage at RT° and real-time PCR data with less than a 1 Cq increase could be obtained even after 3.5 months RT° storage. In our hands, RNAshell and RNAstable both performed equally well for pure RNA samples. However, better RIN and real-time PCR results were obtained in RNAshell when compared to RNAstable, suggesting that partial protection against degradation of non-pure RNA samples might be conferred by the completely inert environment of RNAshell. When RT° matrices were compared to “liquid RNA no matrix”, both RNAstable and RNAshell provided degradation protection; actually RNAshell performed as well as the gold standard −80°C control. These real-time PCR results were in agreement with the RIN values. In general, we observed that the RT° RNA stabilization matrices preserved the original quality state of the sample.
In terms of user-friendliness, the RNAshell encapsulation requires an RNAshell encapsulation station either installed on site or at the manufacturer's site. Thus, the RNAshell technology may not avoid initial RNA shipment on dry ice before encapsulation, but offers unambiguously good storage conditions. RNAstable and GenTegra are both very user-friendly. The GenTegra technology offers the easiest sample handling, as Biomatrica's RNAstable technology recommends applying a semi-permeable adhesive membrane to each tube before drying the sample. In our study, 4 of the 5 preparation centers commented that the adhesive membranes were difficult to apply, especially when wearing gloves. However, results were consistent, independent of whether the semi-permeable membrane was applied. From an environmental point of view, RT° storage solutions are more ecological compared to frozen storage, as also underscored by Jensen et al., 1 and power failures would not alter RNA sample integrity.
In conclusion, in this study the preservation of high quality RNA was demonstrated for 2-week storage (including shipment) with RT° storage matrices RNAstable and RNAshell, and also for liquid and dried RNA without matrix at RT° when the initial RNA samples were highly pure. However, variability in RIN analytical results was higher when RNA was stored without stabilization matrix. These data suggest that short-term storage in RNAstable and RNAshell is equivalent to RT° liquid or dry storage without additive, whereas GenTegra performance was poorer than RNA storage without additives at RT°. These observations are important for researchers or biorepository managers who are concerned about the impact that shipment conditions will have on their RNA samples. To further assess the characteristics and cost-effectiveness of RT° storage matrices in the long term, it will be necessary to conduct long-term stability studies over several years or even decades. The conclusion from this study is that shipment and short-term storage of pure RNA for up to 2 weeks in certain RT° storage matrices, but also storage without stabilization additives, are warranted as fit-for-purpose for RNA recovery, purity, integrity, and real-time PCR applications.
Footnotes
Acknowledgments
We are thankful to Biomatrica, IntegenX (GenVault), and Imagene for providing their storage matrices and for collaborating in this study. In addition, we thank Imagene for applying RNA to the RNAshell for this study. We are grateful to Dominic Allen for editorial support and to Michaël Heymann for informatics support. This study was performed by members of the International Society for Biological and Environmental Repositories (ISBER) Biospecimen Science Working Group, independently of suppliers.
Disclosure Statement
No competing financial interests exist.