
Abstract
Statistical estimation of the osmotic damage of red blood cells (RBCs) during the removal of cryoprotective agents (CPAs) from cryopreserved blood has been a very difficult issue. In this paper, the discrete mass transfer model developed in our previous work is modified to study the volume variation of individual RBCs and thereby to estimate the osmotic damage of all RBCs statistically during CPA removal by the dilution-concentration method we proposed recently. The model is validated with respect to the experimental results either with or without RBCs. Then, it is used to investigate the effects of blood volume, hematocrit, blood and diluent flow rates on the osmotic damage of RBCs, as well as the washing time of CPAs. Our results show that both the increase of blood flow rates and the decrease of diluent flow rates can bring about a reduction in osmotic damage of RBCs; however, only the former can cause a decrease in the washing time of CPAs. The blood volume could also affect the osmotic damage of RBCs. For a given flow condition, there could exist an optimal blood volume range for the dilution-concentration system. The effect of blood volume could be alleviated by an increase in the dilution region volume. In addition, the osmotic damage of RBCs decreases as the hematocrit decreases. Therefore, in practice, the increase of blood flow rates is the best solution to reduce both the osmotic damage of RBCs and the washing time of CPAs simultaneously. A lower hematocrit in the cryopreserved blood and/or longer tubing in the dilution region are also recommended to achieve better performance for the dilution-concentration method.
Introduction
Traditionally, a multi-step centrifugation method is used to remove CPAs from cryopreserved blood. In this method, an isotonic saline solution is added to the cryopreserved blood step-by-step; in each step, the blood is centrifuged and the supernatant with CPAs is removed.7–11 As blood is repeatedly centrifuged and transferred during an operation, this method is not only laborious and time-consuming, but also could cause cell contamination, cell clumping and cell loss.12,13 Alternatively, the dialysis method with a hollow fiber module has been adopted to replace the centrifugation method.14–18 During the process, the blood flows inside hollow fibers whereas the isotonic saline solution flows outside the hollow fibers countercurrently. Driven by the differences of concentration and pressure across the hollow fiber membrane, CPAs within the fibers (but outside cells) will be transferred outside the fibers gradually. Thus, a friendly environment for RBCs is created, in which a stepwise decreasing CPA concentration around RBCs is realized. By controlling the flow conditions, the dialysis method can reduce the osmotic damage to cells (i.e., increase the recovery rate of cells), and affect automation of the washing process, but the removal efficiency is limited by the mass transfer limitation of the hollow fiber membrane.
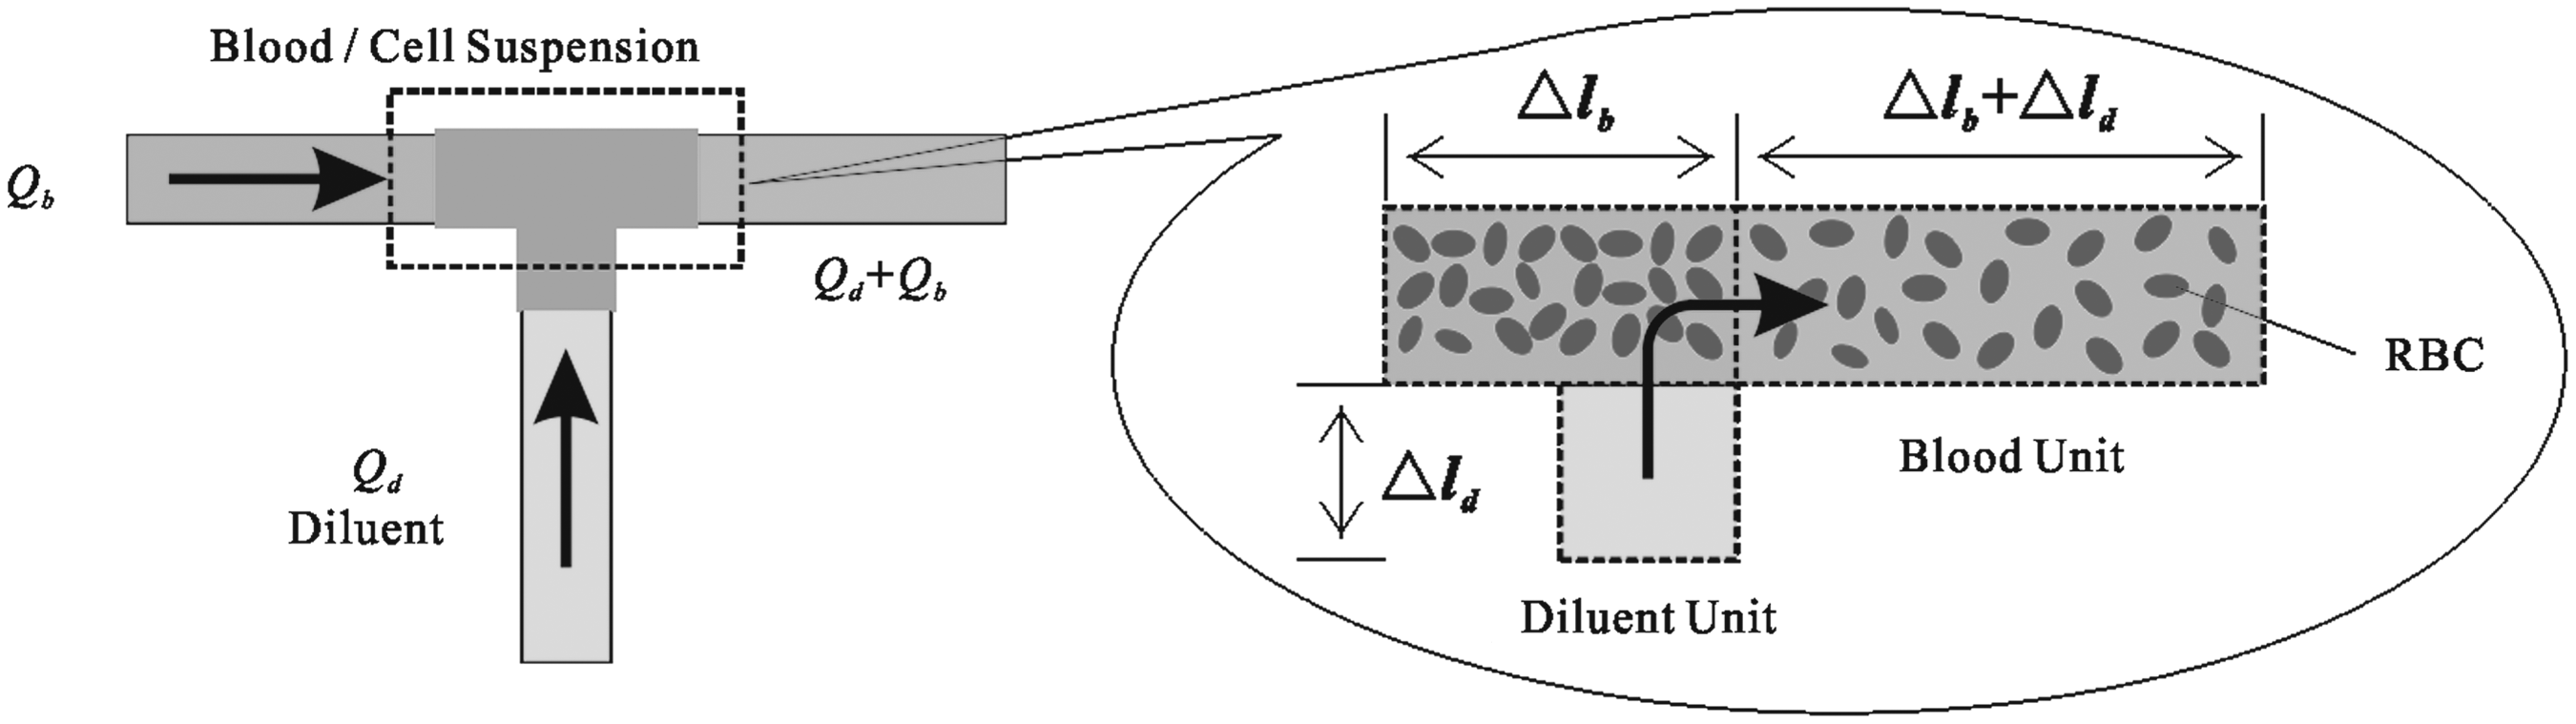
Recently, we proposed a dilution-concentration system to remove CPAs from cryopreserved blood. In this method, shown in Fig. 1, blood is diluted by an isotonic saline solution first and then concentrated by a plasma filter repeatedly. By doing so, the extracellular CPAs can be filtered out gradually. In our previous work, 19 a continuum mass transfer model was developed to study the volume variation of RBCs, where the behaviors of all cells were assumed to be identical. This model can give us some general guidance on reducing the osmotic damage of cells by adjusting operational conditions, but it fails to represent the volume variations of individual cells and thereby fails to statistically estimate the osmotic damage of all cells under a given condition.

Schematic of removing cryoprotective agents with the diluent concentration method.
Statistical estimation of the osmotic damage to RBCs from the above CPA clearance methods remains a difficult issue. In our previous study, 20 for the first time, a discrete model was developed for the dialysis method, to theoretically predict the osmotic damage to RBCs. That model can provide a feasible strategy for tracking the variation of individual cells, but the mass transfer equations used are not suitable for the dilution-concentration method. The reasons are as follows: (1) in the dialysis method the decrease of extracellular CPA concentration is due to CPA transport across the fiber membrane whereas in the dilution-concentration method it is due to dilution; (2) in the dialysis method the hollow fiber module provides a stepwise decreasing CPA concentration environment for RBCs whereas in the dilution-concentration method it concentrates RBCs and removes CPAs; (3) in the dilution-concentration method the extracellular CPA concentration will decrease sharply due to sudden dilution. Therefore, in this study, the discrete model is modified so that it cannot only statistically estimate the osmotic damage to RBCs from the dilution-concentration method but can also accurately provide safe and effective operating conditions for avoiding the osmotic damage to RBCs. This modified model could also be used in the future to study the effect of the polydispersity (heterogeneity of size) of RBCs on the osmotic damage of RBCs.
Theory
In the dilution-concentration method (Fig.1), the blood with CPAs flows into a buffer bag, and then is driven by a peristaltic pump into peripheral circulation, in which it is mixed with isotonic saline solution from the diluent bag, followed by CPA clearance in a plasma filter. The circulation continues until CPAs are removed. RBCs in the whole system go through five parts: the tubing from the buffer bag outlet to the dilution point (part I), the tubing from the dilution point to the plasma filter inlet (part II: dilution region), the plasma filter (part III: concentration region), the tubing from the plasma filter outlet to the buffer bag (part IV), and the buffer bag (part V). Due to continuous dilution with the isotonic saline solution, the volume of RBCs expands and recovers repeatedly. Meanwhile, as RBCs are concentrated by the plasma filter, CPAs are removed.
It is hard to accurately predict the volume of RBCs and the concentration of CPAs in practice, for they are influenced by many factors, for example, the polydispersity of cells, 21 the components of both cell suspension and dilution solutions, the configuration of the plasma filter, and so on. In order to simplify our theoretical model, some assumptions used are as follows: (a) the configuration of the plasma filter is ideal and can produce an even flow inside hollow fibers; (b) the extracellular and intracellular solutions only consist of one permeable CPA, glycerol and one impermeable solute, NaCl; (c) all cells are identical and blood is homogeneous; (d) at the dilution point, blood is well mixed with the dilution solution and uniform mixing is reached instantly; (e) mass transfer by diffusion along the flow direction is ignored because convection is dominant in the system.
Discrete model
In order to monitor the behaviors of cells, the blood with a total volume Vb is divided into N units equally (the volume of blood units ΔVb equals to Vb/N). Each unit contains the same number of cells and enters the washing system randomly. If the flow rate of the blood in the tubing of part I is set to be Qb, the time interval Δt for blood units entering the system will be ΔVb/Qb. Similarly, the dilution solution is also divided into finite units with an identical volume ΔVd, which is determined by the diluent flow rate Qd and the above time interval (ΔVd=QdΔt) (the number of diluent units here is assumed to be large enough to complete the CPA clearance). Corresponding to this kind of division, part I is divided into NI compartments with an identical length
Schematic of the blood unit change at the dilution point.
As for part III, the division is more complex due to the filtration process in the plasma filter (Fig. 3). Because of the pressure difference across the hollow fiber membrane, the filtration rate varies along the flow direction and the flow rate of the blood decreases from Qb+Qd to Qb. That is to say, the length of compartments inside the plasma filter should decrease stepwise when using the discrete model (according to Q=SΔl/Δt, if Δt and the cross-section area S remain constant, the decrease of flow rates can be represented by the decrease of the unit length). Regarding the pressure distributions on both sides of the hollow fiber membrane, one could use equations in the literature22,23 to get more accurate solutions. In this study, we assumed that the pressure difference, i.e. the filtration rate, decreases linearly along the flow direction of the blood (Fig.3). The assumption used here is based on the following facts: the first is that the numerical solutions of the pressure distributions on both sides are close to linear 22 (thus, the pressure difference or the filtration rate is also close to linear); the second is that when cells go through the dilution point, they expand and recover rapidly (this process only takes several seconds). During filtration, the volume variation of cells is relatively small and the function of the plasma filter is only to enrich cells, i.e., remove CPAs. Accordingly, the accurate pressure difference for the axial filtration is not the key to this study (Of course, if a small plasma filter with high-performance is chosen, which can effect rapid enrichment, the above issue does not exist at all).
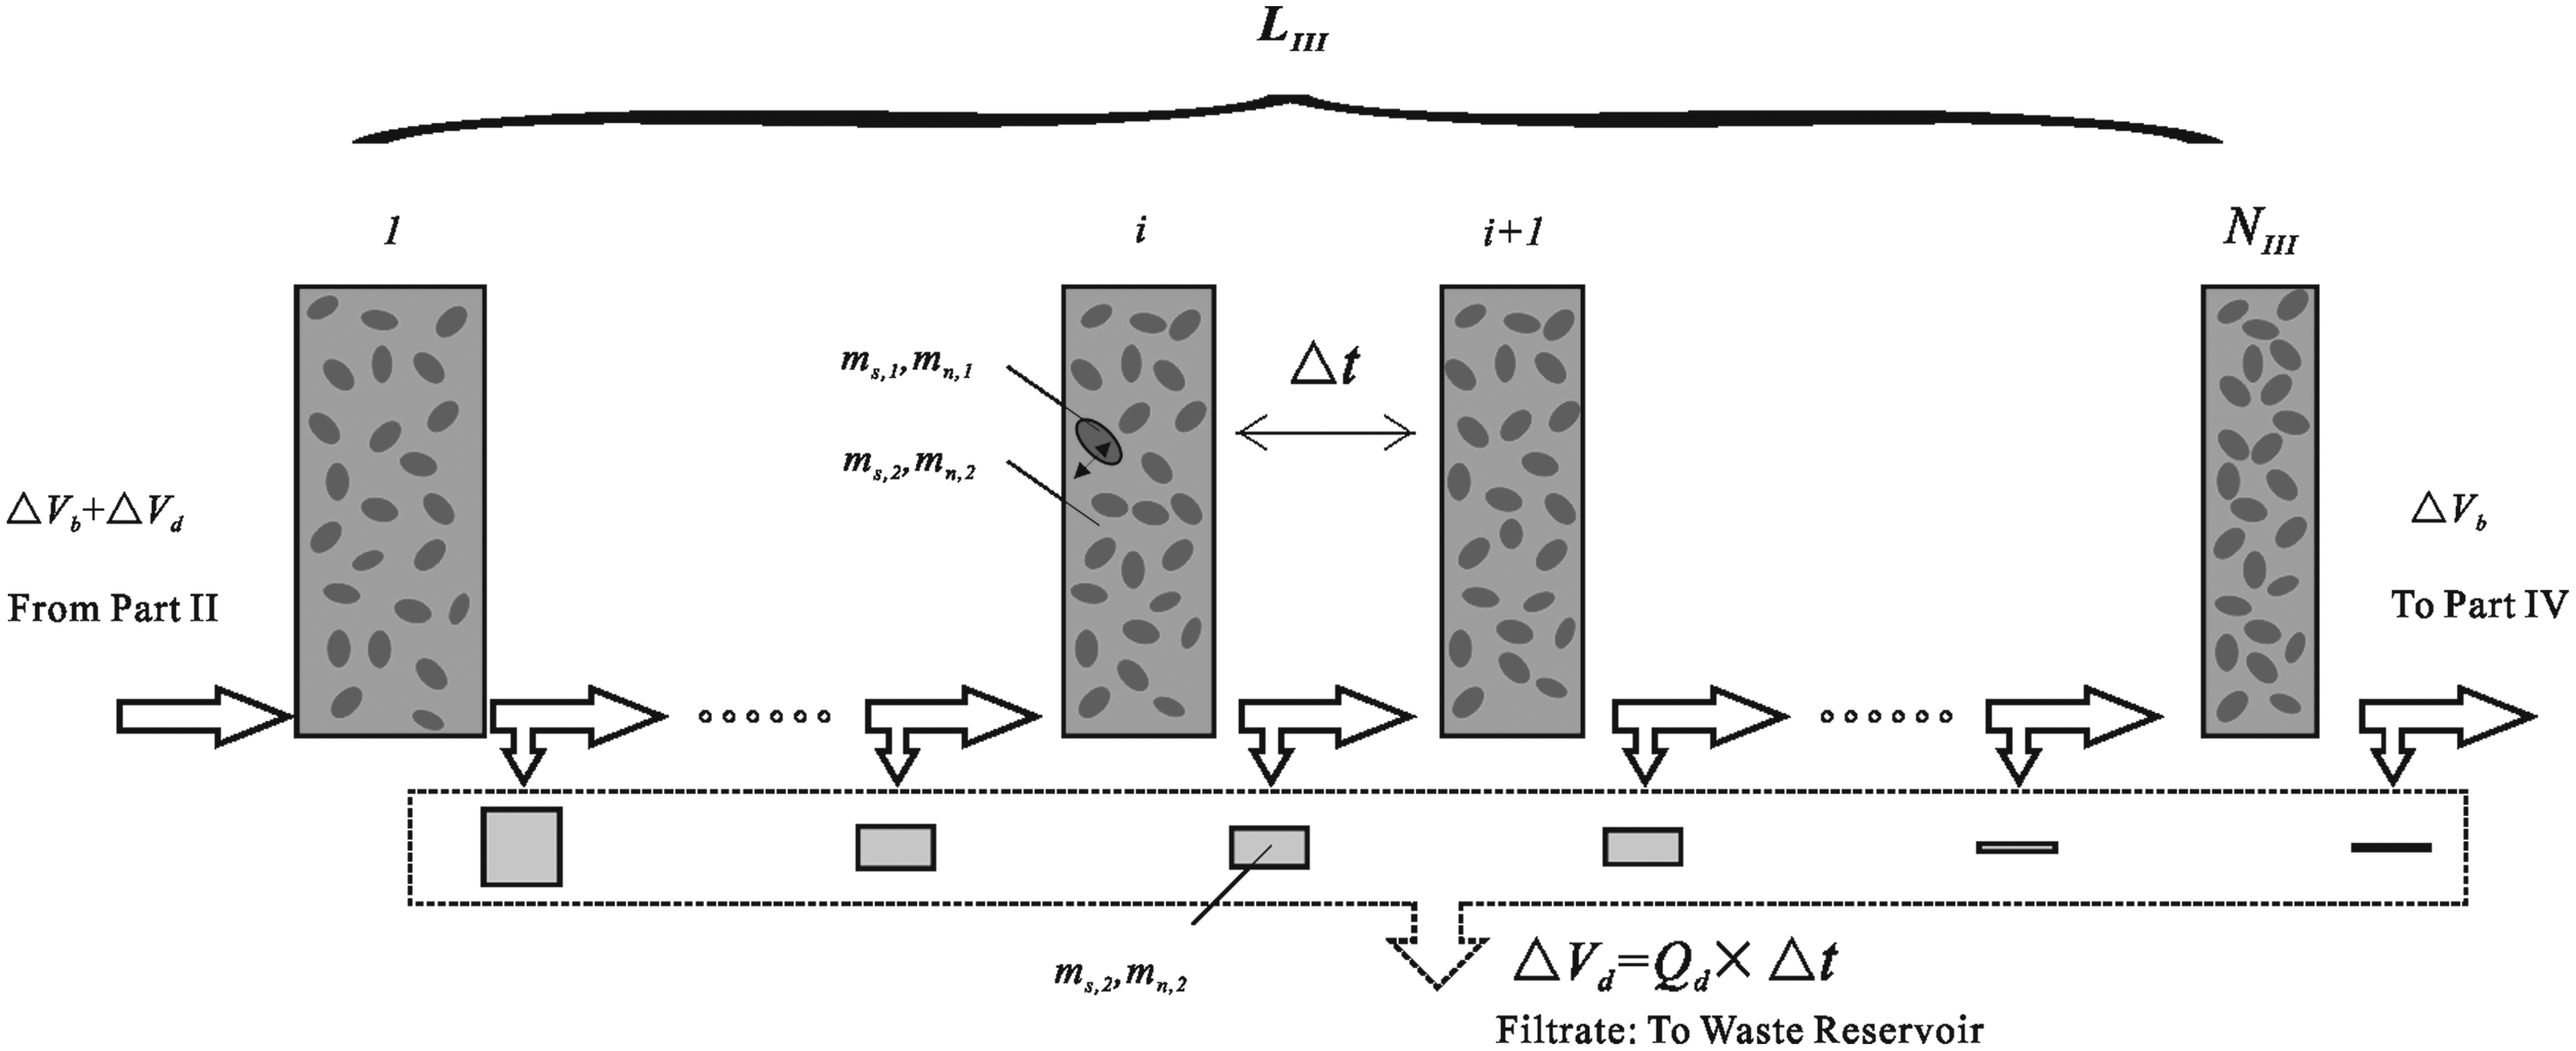
Schematic of the red blood cell concentration/cryoprotective agent removal process in the plasma filter.
According to the above analysis, the volume of compartments inside the plasma filter is assumed to decrease from ΔVb+ΔVd to ΔVb as an arithmetic sequence (Fig.3). Then, the number of compartments NIII can be decided by the following equations:
where d is the arithmetic item, Nh is the number of hollow fibers in the plasma filter, rh is the inner radius of hollow fibers, and LIII is the effective length of hollow fibers.
In part V, sometimes no blood unit is left in the buffer bag because the number of blood units to be washed is small. In this situation, the mixing among units in the buffer bag does not exist. Otherwise, the mixing process must be taken into consideration.
Mass transfer equations
In the dilution-concentration method, the mass transfer in any part from I to IV can be unified as two steps: one is the CPA mass transfer from inside to outside of cells; the other is the shift of blood units from one compartment to the next.
Part I, II, and IV
In part I, II, or IV, the volume of blood units remains constant and the CPA transport in any blood unit is a redistribution process of CPAs on both sides of the cell membrane. By means of a similar derivation method in the literature,18,20,23–25 the equations for calculating RBC volume, CPA and NaCl concentrations can be obtained as follows:
where subscripts 1 and 2 refer to the intracellular part (inside of cells) and the extracellular part (outside of cells), respectively; subscripts s and n represent the permeable solute (CPA: glycerol) and the impermeable solute (NaCl), respectively; Lp,c, Ps,c and σc are hydraulic permeability, solute permeability and reflection coefficient of the cell membrane, respectively; the superscript 0 represents the previous time, m is the solute concentration, Vc is the volume of cells, Ac is the cell membrane area, R is the universal gas constant, T is the absolute temperature, Vbc refers to the osmotically inactive volume of cells at the isotonic condition,
Part III
In the plasma filter, CPA clearance experiences two transmembrane transports and the shift of blood units is accompanied by a linear reduction of the unit volume due to filtration. In order to simplify the problem studied here, we assumed that the CPA concentration in the filtrate is always the same as that in blood units (it should be noted that this assumption is based on two facts: one is that for a plasma filter the convection transport is dominant; the other is that the negative pressure produced by Pump C makes the filtrate and the solution in blood units almost the same). Thus, in this work, the filtrate is included in the calculation of the CPA concentration outside cells. Consequently, the above equations can still be used to calculate the variations of RBC volume and CPA concentration except that the volume of blood units Vu linearly decreases (here
Part V
In part V, if the number of blood units is large, mixing in the buffer bag could occur, which would complicate the washing process. In this study, we assumed that when each unit returns to the buffer bag the solution outside the cells of this unit is mixed with others whereas the cells are confined and do not mix with those in other units. In addition, we also assumed that the mixing is quick and uniform. In that case RBC volume, intracellular CPA and NaCl concentrations can be described by equations (2), (3) and (5), whereas other parameters can be calculated by the following equations [18, 20]:

In the dilution-concentration method, at the dilution point between part I and II, CPA and NaCl concentrations will change (Fig.2). Based on mass conservation, the relationships for them between parts I and II are as follows:
where superscripts I and II denote blood units before and after the dilution point, respectively, and
Materials and Methods
In the cell-free experiment for validating a modified discrete model in this study, three OEM peristaltic pumps (400F/M, Watson-Marlow Co., USA) and one plasma filter (PlasmfloTM AP-05H/L, ASAHI Co., Japan) were used. 19 Tubing with a length of ∼40 cm and a radius of ∼2 mm was used for parts I, II and IV. A ternary solution with NaCl, Glycerol and deionized water was used to mimic blood (200 ml). The initial concentrations of NaCl and Glycerol were 290 mOsm and 6280 mOsm, respectively. Isotonic solution was used for dilution, in which the NaCl concentration was 290 mOsm. Blood and diluent flow rates were set to 200 and 20 ml/min, respectively.
In experiments with human RBCs, the blood with glycerol was used. All parameters needed for this model can be found in our previous work, 19 and are listed as follows: the volume varied from 200 to 210 ml/min, the hematocrit from 21 to 30%, the blood flow rate was 200 ml/min, the dilution rate was set to be: 3 (0∼5 min), 5 (6∼10 min), 7 (10∼15 min), 9 (16∼20 min), 12 (20∼2 5min), 15 (26∼30 min) ml/min, and the NaCl concentration was 290 mOsm. All experiments were conducted once at ∼25°C. 19 Before and after experiments, the numbers of living cells were counted and then the recovery rate of cells was obtained.
A random algorithm, written in FORTRAN 77, was used to control entry of blood units into the tubing. 20 First, all blood units are numbered. Then, the program produces a random integer with uniform distribution. Finally, the program checks whether the blood unit exists in the buffer bag: if not, it produces another random integer; if yes, it permits the blood unit to enter the peripheral system. The random program runs continuously until a blood unit in the buffer bag is chosen. In calculation of the above equations the first-order Euler method was used and the redefinitions of time step and unit volume were adopted to ensure the simulation accuracy. Other parameters used from the literature are listed in Table 1.26–28
From the literature [26]; bFrom the literature [27]; cFrom the literature [28].
Results and Discussion
Validation of discrete model
In order to validate the discrete mass transfer model modified in this study, theoretical results were compared with experimental results with and without cells. In the situation without cells, the strength of the discrete model cannot be fully displayed. However, the experiments without cells can be used to verify the CPA washing efficiency of the dilution- concentration system and the correctness of the program code when the cell density is set to be zero. The results show that the theoretical glycerin concentration variation in the buffer bag agrees well with the experimental one (Fig. 4).
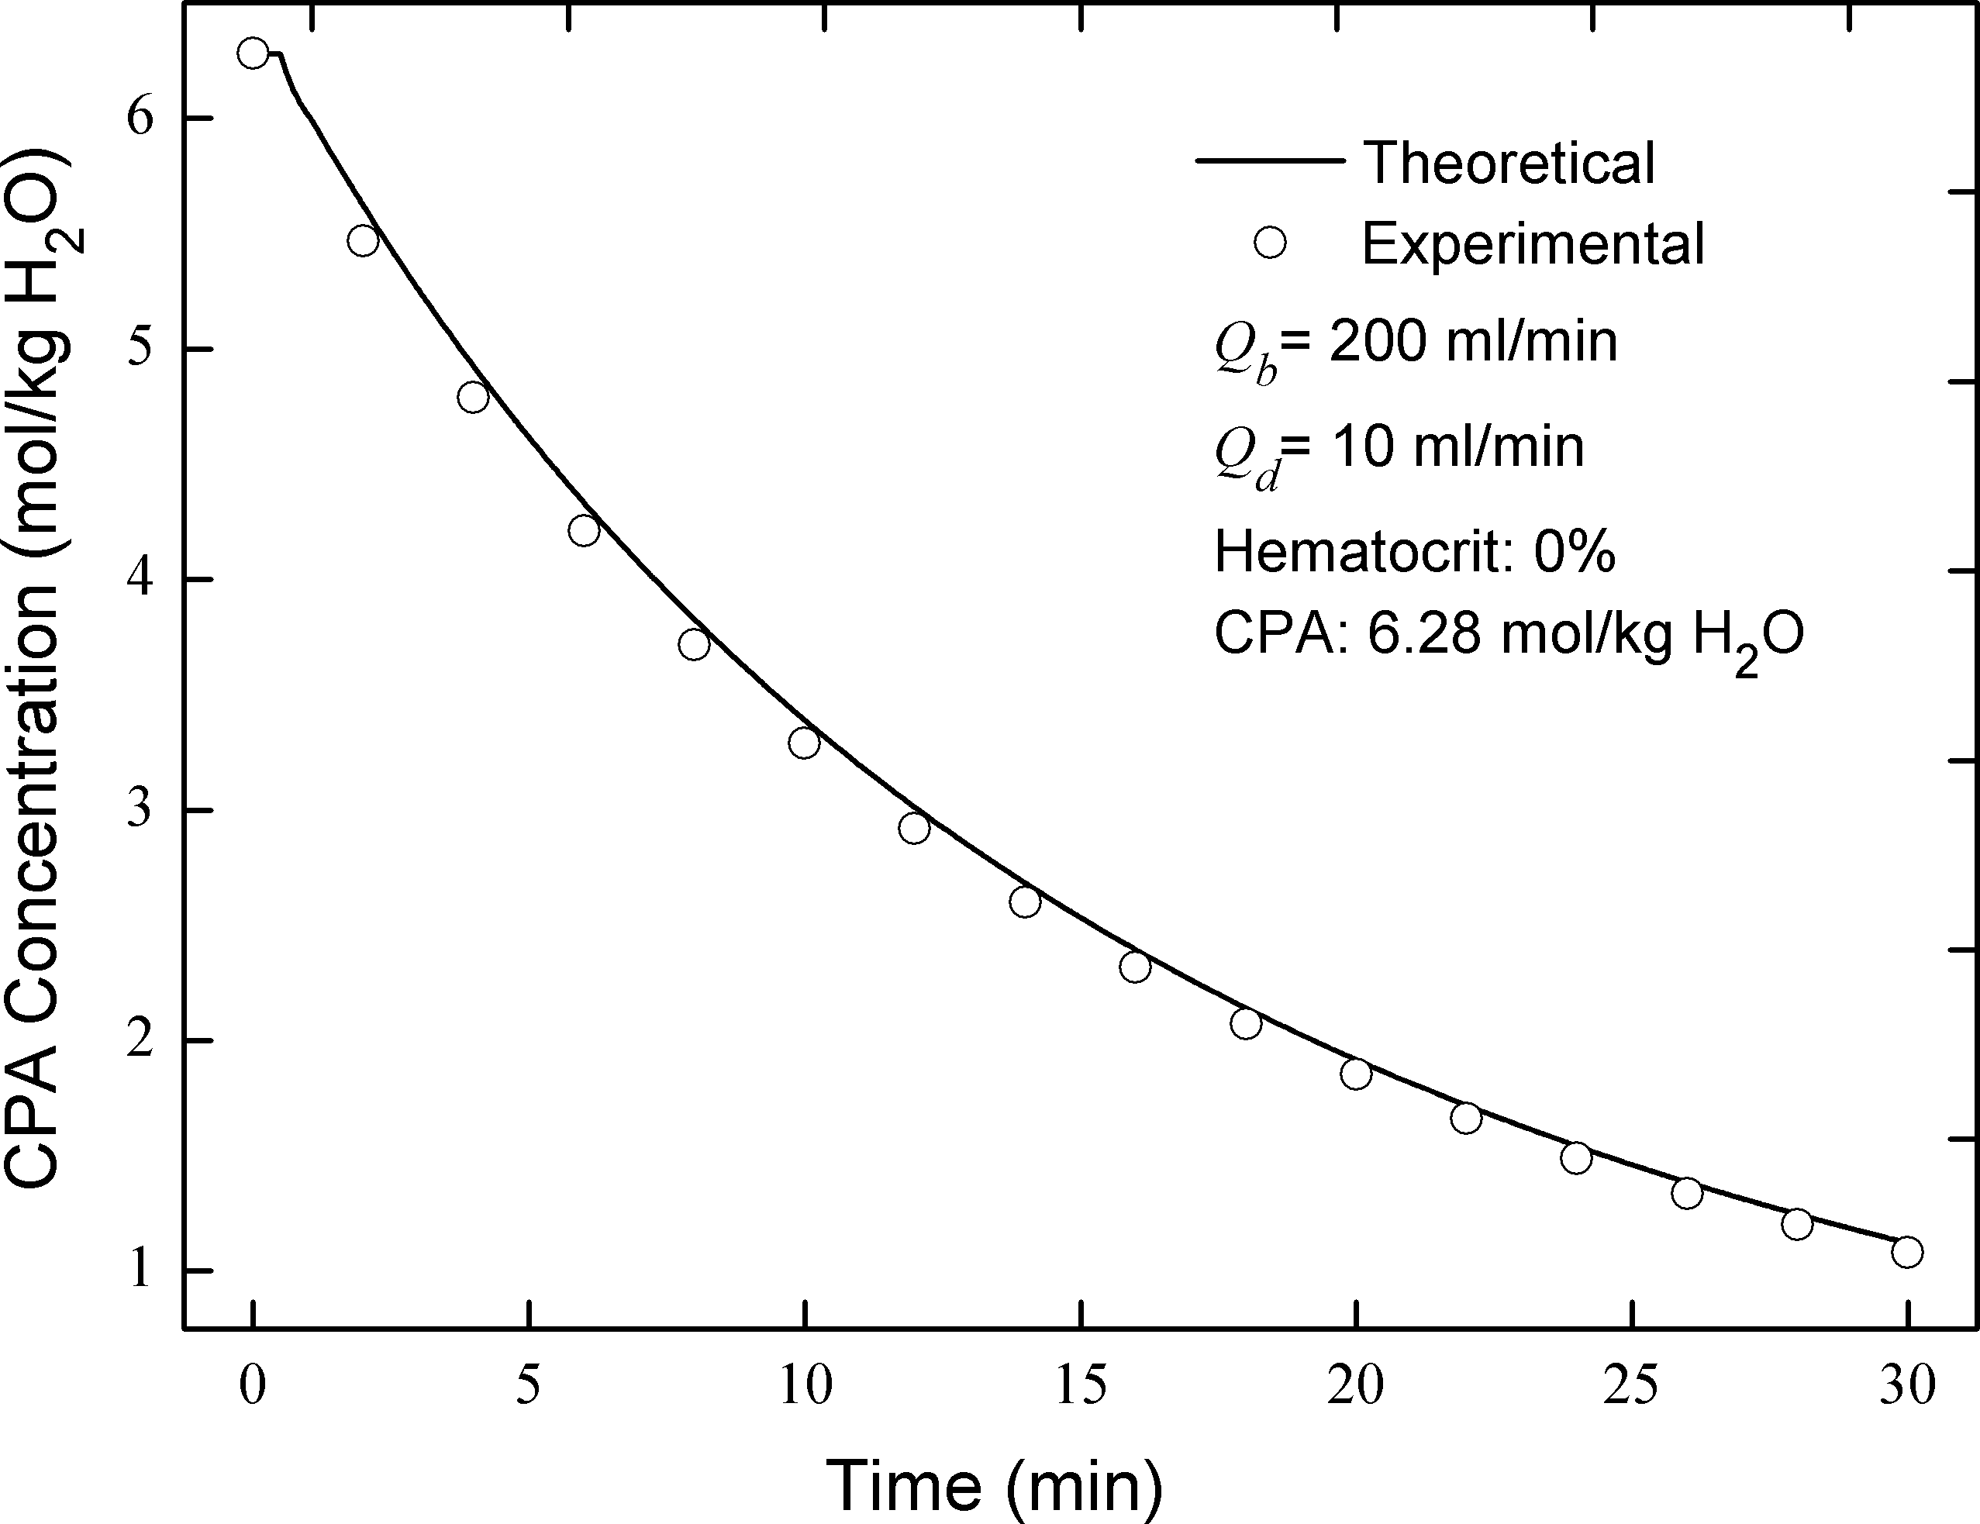
Comparison of cryoprotective agent concentrations between theoretical and experimental results.
With cells present, the comparison between theoretical and experimental recovery rates of cells also shows that the model presented here has very good ability to predict the recovery rate of cells during CPA removal (Table 2). It should be noted that for the first time the discrete model for tracking individual cells is validated experimentally, which makes theoretic estimation of osmotic damage of cells during the clearance of CPAs possible (the blood flow rate was 200 ml/min; the diluent flow rate varied with time from 3 to 15 ml/min).
Effects of blood volume
In the dilution-concentration method, the blood volume could affect the osmotic damage of RBCs. For a given blood volume, taking blood and diluent flow rates into account, blood units could entirely or partly circulate in the peripheral system. (In this study, all of the RBC volumes in figures were simulation results normalized by the RBC volume in an isotonic condition).
If blood units circulate entirely in the peripheral system, no mixing occurs in the buffer bag. In this situation, the changes in all blood units, including cell volume, glycerin concentration and NaCl concentration, are identical. Our results show that all cells periodically experience expansion and shrinkage, and the peak volume of cells initially increases and then decreases (Fig. 5A). In each cycle, at the dilution point, cells begin to expand with the sudden decrease of glycerin concentration outside cells. During volume recovery of cells, due to limited tubing length in the dilution region, the residence time is not long enough for cells to reach an equilibrium status. Thus, cells in the recovery phase expand again and reach a higher peak volume in the next cycle. Therefore, the peak volume of cells increases initially but as glycerin is removed by gradual filtration, the net volume change of cells changes from positive to negative and finally tends to zero (the net volume change in one cycle is equal to the final volume minus the initial volume, as shown in Fig.5A). The earlier accumulation is gradually offset by the latter decrease. Consequently, the peak volume of cells decreases after experiencing a high point (in this work, peak denotes the maximal value in one cycle whereas maximum denotes the maximal value among all peaks).
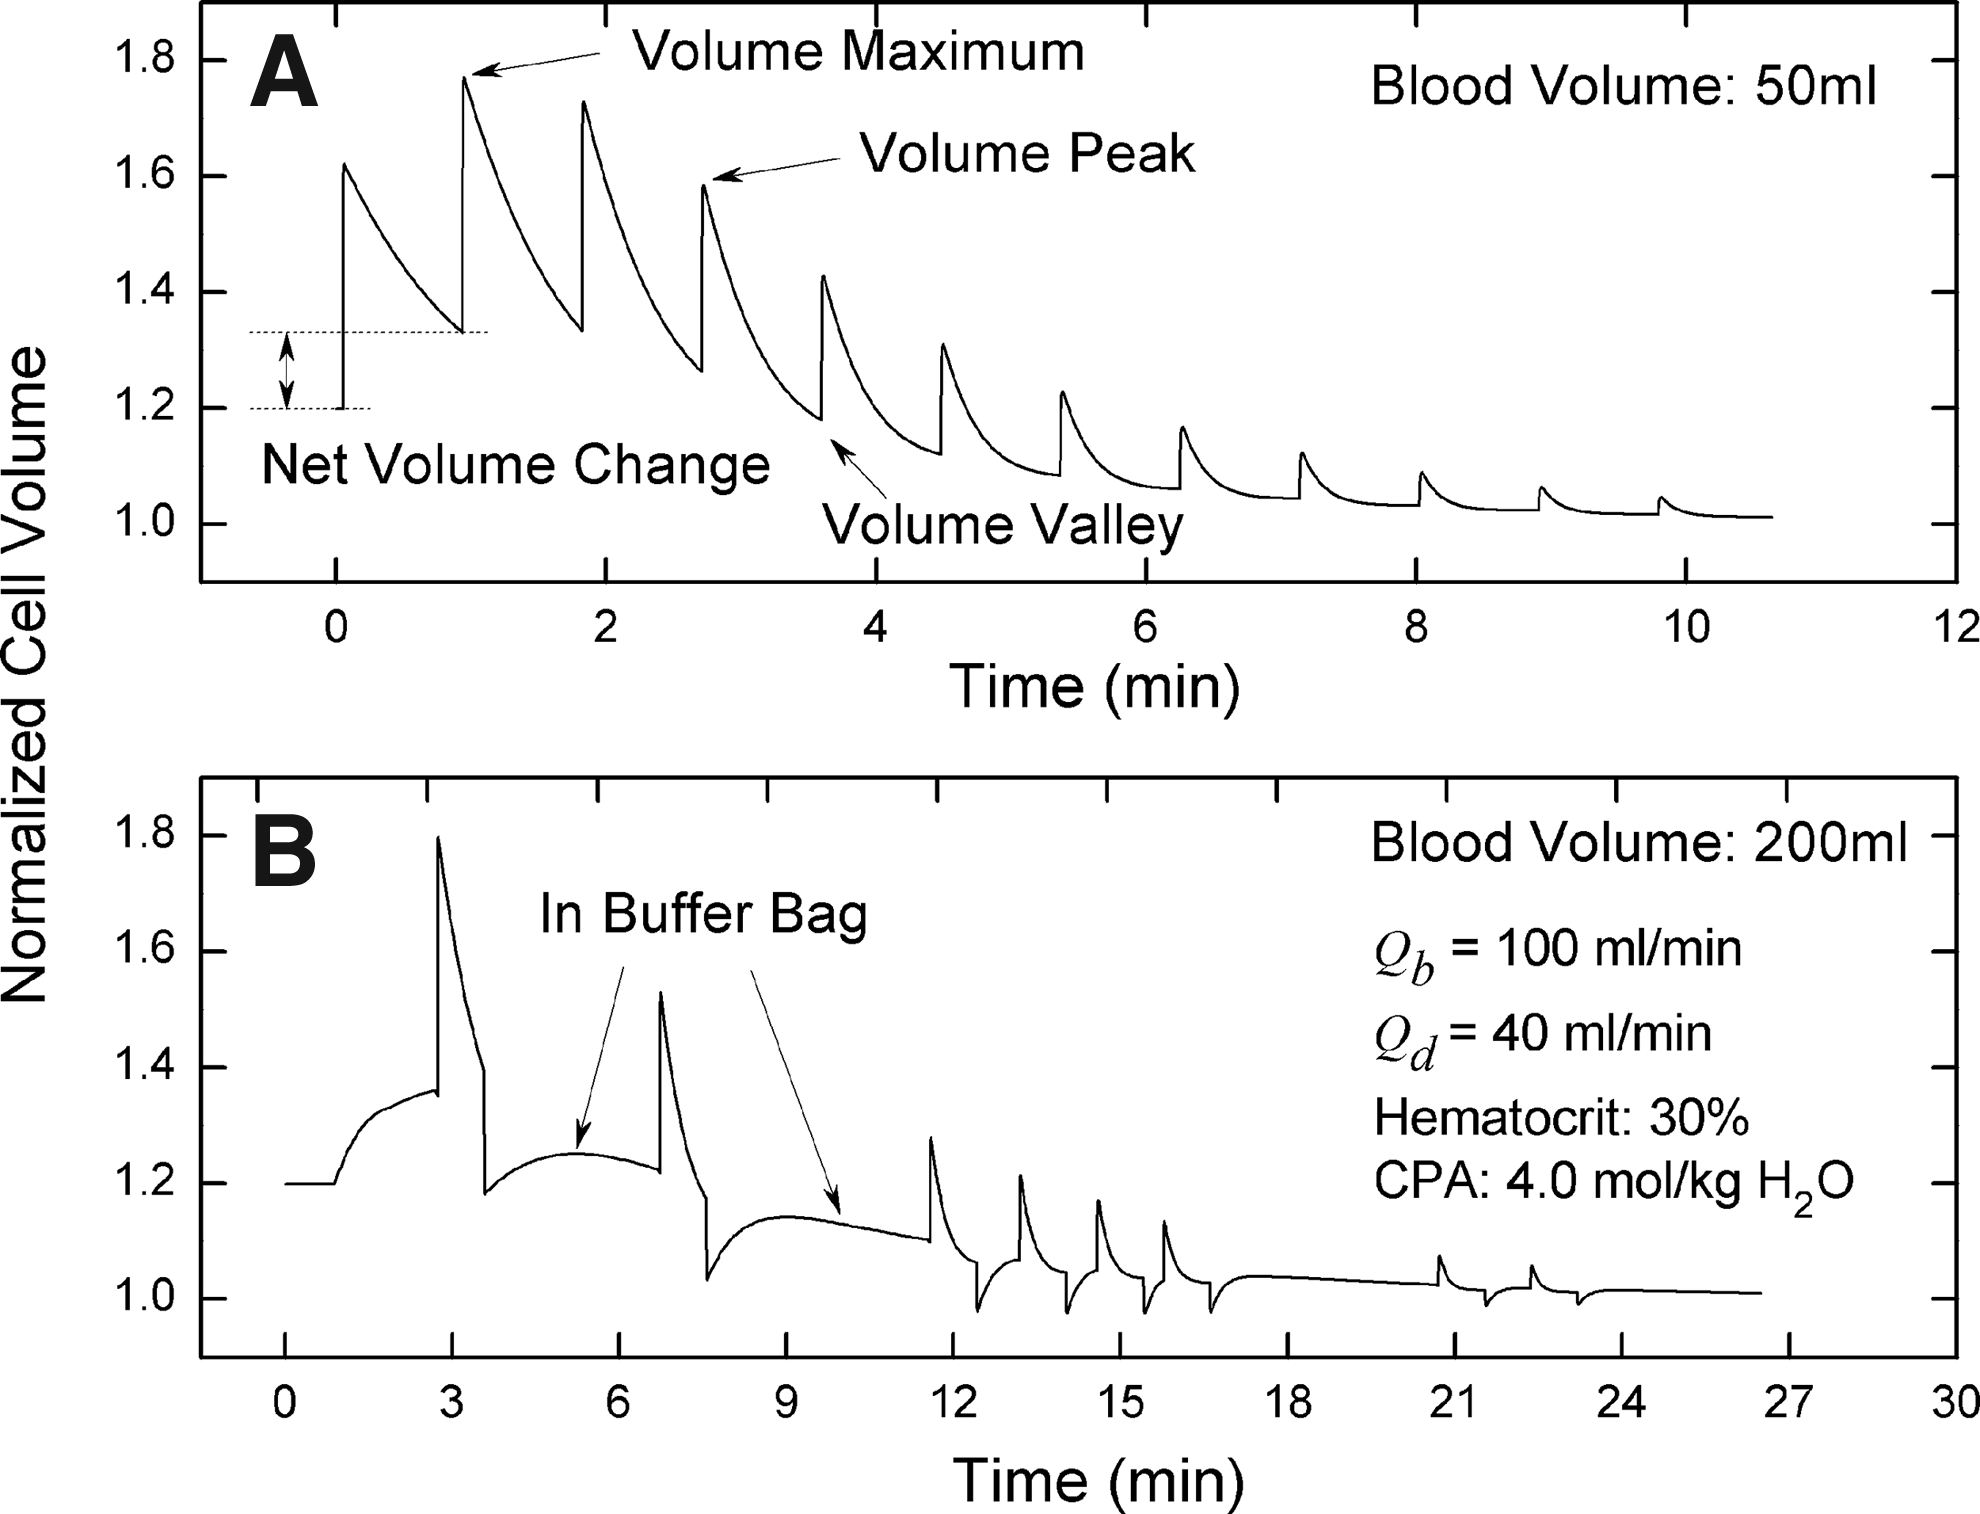
Comparison of cell volume variations between situations with and without mixing.
In the situation without mixing, the behaviors of all cells and blood units are identical. Thus, the optimal operational condition derived from one unit is suitable for all units. In order to reduce or even avoid osmotic damage of cells, the maximum volume of cells should be controlled below the expansion limit of cells. According to the above analysis, the short tubing length in the dilution region is a drawback which could cause an increase of the maximum volume of cells by the accumulation effect and thereby the reduction of the recovery rate of cells. Hence, in practice, longer tubing in the dilution region is highly recommended.
In the situation where mixing occurs in the buffer bag, the issue becomes more complex because blood units enter the tubing randomly; therefore, the behaviors of cells in different units are totally different. Figure 5B shows a typical cell volume variation when mixing happens. In this simulation, the blood was divided into 2000 units. Considering that the total peripheral volume (the volume sum of part I, II, III and IV) was ∼100 ml and the diluent flow rate was 40 ml/min, ∼1110 units were left in the buffer bag during the washing process (the diluent entering the system occupied space, which caused decreased space to be available for blood units). After blood units return from the peripheral system, mixing occurs in the buffer bag. Because blood units enter the system randomly, some units could be pumped into the system immediately after they return whereas others could wait for a long time for the next opportunity (Figure 5B). Because the frequency of blood units being selected to enter the system is non-uniform, the volume variation of individual cells is also non-uniform. Therefore, some units reach the volume maximum in the buffer bag whereas others achieve it in the peripheral system.
With random mixing, the accumulation effect is not continuous and thereby not evident. If the number of blood units is slightly larger than the number of compartments in the peripheral circulation, some blood units which enter the system later could reach a volume maximum higher than those in the situation without mixing. Consequently, a short increase of the average volume maximum appears as the blood volume increases (Figure 6A). As the blood volume increases, the number of blood units left in the buffer bag increases, and then the average frequency for all blood units entering the system decreases. As a result, the negative accumulation effect is alleviated and the average volume maximum is decreased. Therefore, an increase in blood volume is not always an effective way to reduce hypotonic damage (in this study, for each operating condition, the system clock was varied to simulate different experiments; the program code was run under 6 system clocks; different system clocks result in different random sequences for blood units and thereby different simulation results; all results shown are the statistical average of 6 simulation values; the standard deviations are also shown in the figures; the stop condition for the system is that glycerin concentration inside cells is lower than 0.05 mol/kg H2O).

Effects of blood volume on washing time, cell volume, and osmotic damage.
For a given flow condition, when the blood volume was large enough, hypotonic damage of cells could be avoided completely. However, a large blood volume also brings the new problem of potential hypertonic cell damage (Fig.6B). Furthermore, the larger the blood volume, the more serious the hypertonic damage of cells, because when the blood volume is larger, glycerin concentration in the buffer bag decreases more slowly. Then, the cells from the peripheral system have to face an environment with a higher glycerin concentration in the buffer bag, which results in more shrinkage and a smaller volume minimum; hypertonic damage of cells could result. Statistical results in this study show that for a given flow condition, there could exist an optimal blood volume range. For example, when blood and diluent flow rates were 60 and 40 ml/min, respectively, the hematocrit was 30% and glycerin concentration was 4.0 mol/kg H2O, the optimal blood volume range for our system was 300-400 ml, as shown in Fig.6B (In this work, two values of RBC volume tolerance limits were assumed: expansion and shrinkage limits were 2.0 and 0.8 of the isotonic volume of RBCs, respectively).
From an ideal point of view, the volume of the peripheral system should be smaller, which not only can reduce the contamination of cells, but also can increase the portability of the washing system. From a practical point of view, the volume should be larger, which not only can reduce the osmotic damage, but can increase the removal efficiency of CPAs as well (square dot in Fig. 6A).
Effects of hematocrit
Hematocrit also could affect the osmotic damage of RBCs and thereby the recovery rate of RBCs. The results in this work show that an increase of hematocrit can cause increase of the maximum volume of cells (Fig. 7A) and thereby an increase of hypotonic damage of cells (Fig.7B). According to equation 9 if the hematocrit is higher, the extracellular glycerin concentration after the dilution point is lower; then, glycerin concentration difference across the cell membrane is larger. Consequently, the maximum volume cells can reach is larger. Therefore, the higher the hematocrit is, the lower the recovery rate of cells is. Although an increase of hematocrit can also increase the minimum volume of cells (i.e., reduce the hypertonic damage of cells) and shorten the washing time of CPAs simultaneously, these two positive effects are relatively trivial (Fig.7A).
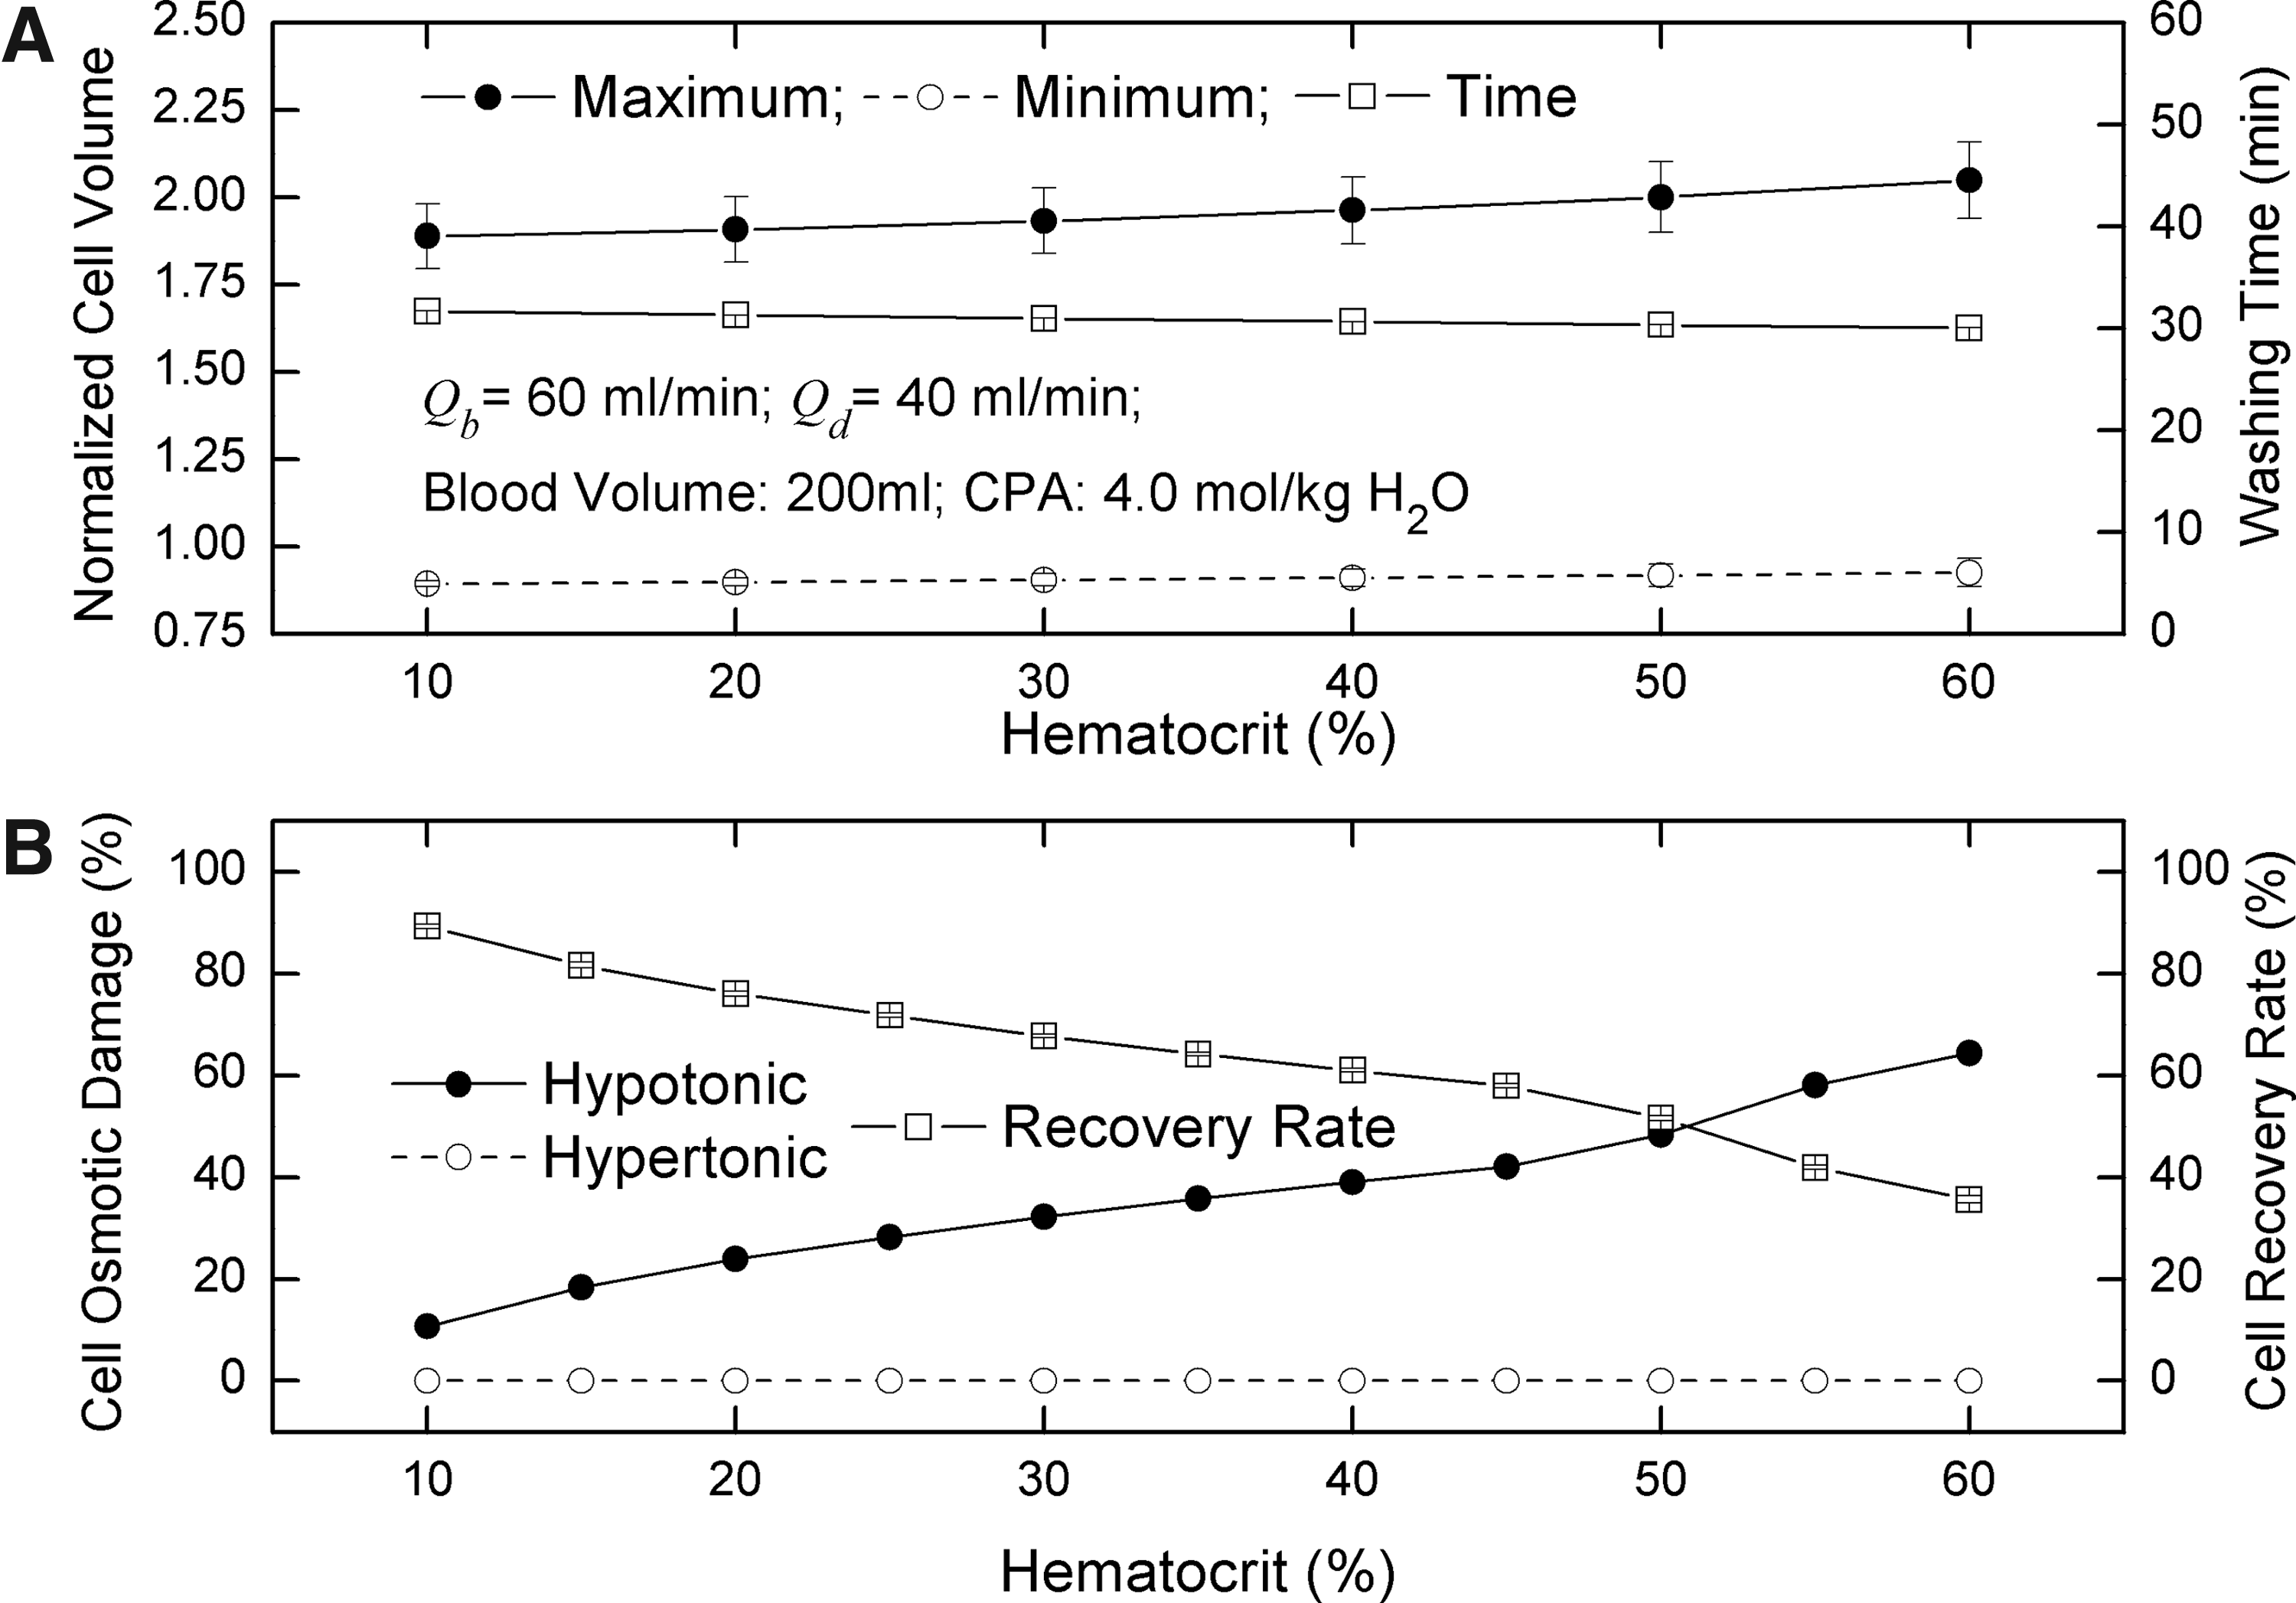
Effects of hematocrit on washing time, cell volume. and osmotic damage.
Effects of blood flow rates
For a given blood condition, in order to reduce osmotic damage to RBCs and increase the removal efficiency of CPAs, one only has two choices: one is to adjust the blood flow rate, the other is to control the diluent flow rate.
For a single cycle, the increase of blood flow rates can decrease the removal efficiency of CPAs due to the reduction of the flow ratio of diluent to blood; however, for the whole washing process, the removal efficiency is enhanced due to the increase of the frequency of blood units entering the peripheral system. Therefore, the higher the blood flow rate is, the shorter the washing time is (Fig. 8A). Because glycerin is removed quickly, the accumulation effect of the volume change of cells is reduced. As a result, the average maximum volume of cells decreases (Fig.8A). As for hypotonic damage of cells, when the blood flow rate increases, it increases slightly at first and then decreases sharply (Fig.8B). The reason for the increase is that when the blood flow rate is lower, the accumulation effect is offset by the lower minimum volume. As the blood flow rate increases, the positive offset effect disappears gradually. Therefore, the hypotonic damage of cells increases. The increase of blood flow rates also can increase the minimum volume of cells (Fig.8A) and thereby decrease hypertonic damage of cells (Fig.8B). For a given diluent flow rate in each cycle, the lower the blood flow rate is, the more glycerin is removed. Then, when the blood flow rate is lower, those blood units entering the peripheral system earlier with more rapid glycerin removal, must confront a relatively more hypertonic outside environment after they return to the buffer bag. Consequently, hypertonic damage of cells could result. Hence, from the point of view of either reducing both hypertonic and hypotonic damage to RBCs or shortening the washing time of CPAs, a higher blood flow rate is highly recommended.

Effects of blood flow rates on washing time, cell volume, and osmotic damage.
Effects of diluent flow rates
The diluent flow rate is another controllable factor affecting the osmotic damage of RBCs and the washing time of CPAs. The results show that increasing the diluent flow rate can dramatically reduce the washing time of CPAs; however, it also can result in an increase of the maximum volume and decrease of the minimum volume of cells (Fig. 9A). That is to say, both hypertonic and hypotonic damage of cells could occur when the diluent flow rate increases (Fig. 9B). Hence, in order to increase both the recovery rate of RBCs and the removal efficiency of CPAs simultaneously, to adjust the diluent flow rate is not a perfect method. For a fixed flow ratio of blood to diluent, as the diluent flow rate increases, the washing time of CPAs decreases whereas both maximum and minimum volumes of cells increase (Fig. 10), which implies that the diluent flow rate is dominant in determining the washing efficiency of CPAs and hypotonic damage of RBCs whereas the blood flow rate is dominant in affecting hypertonic damage of RBCs.
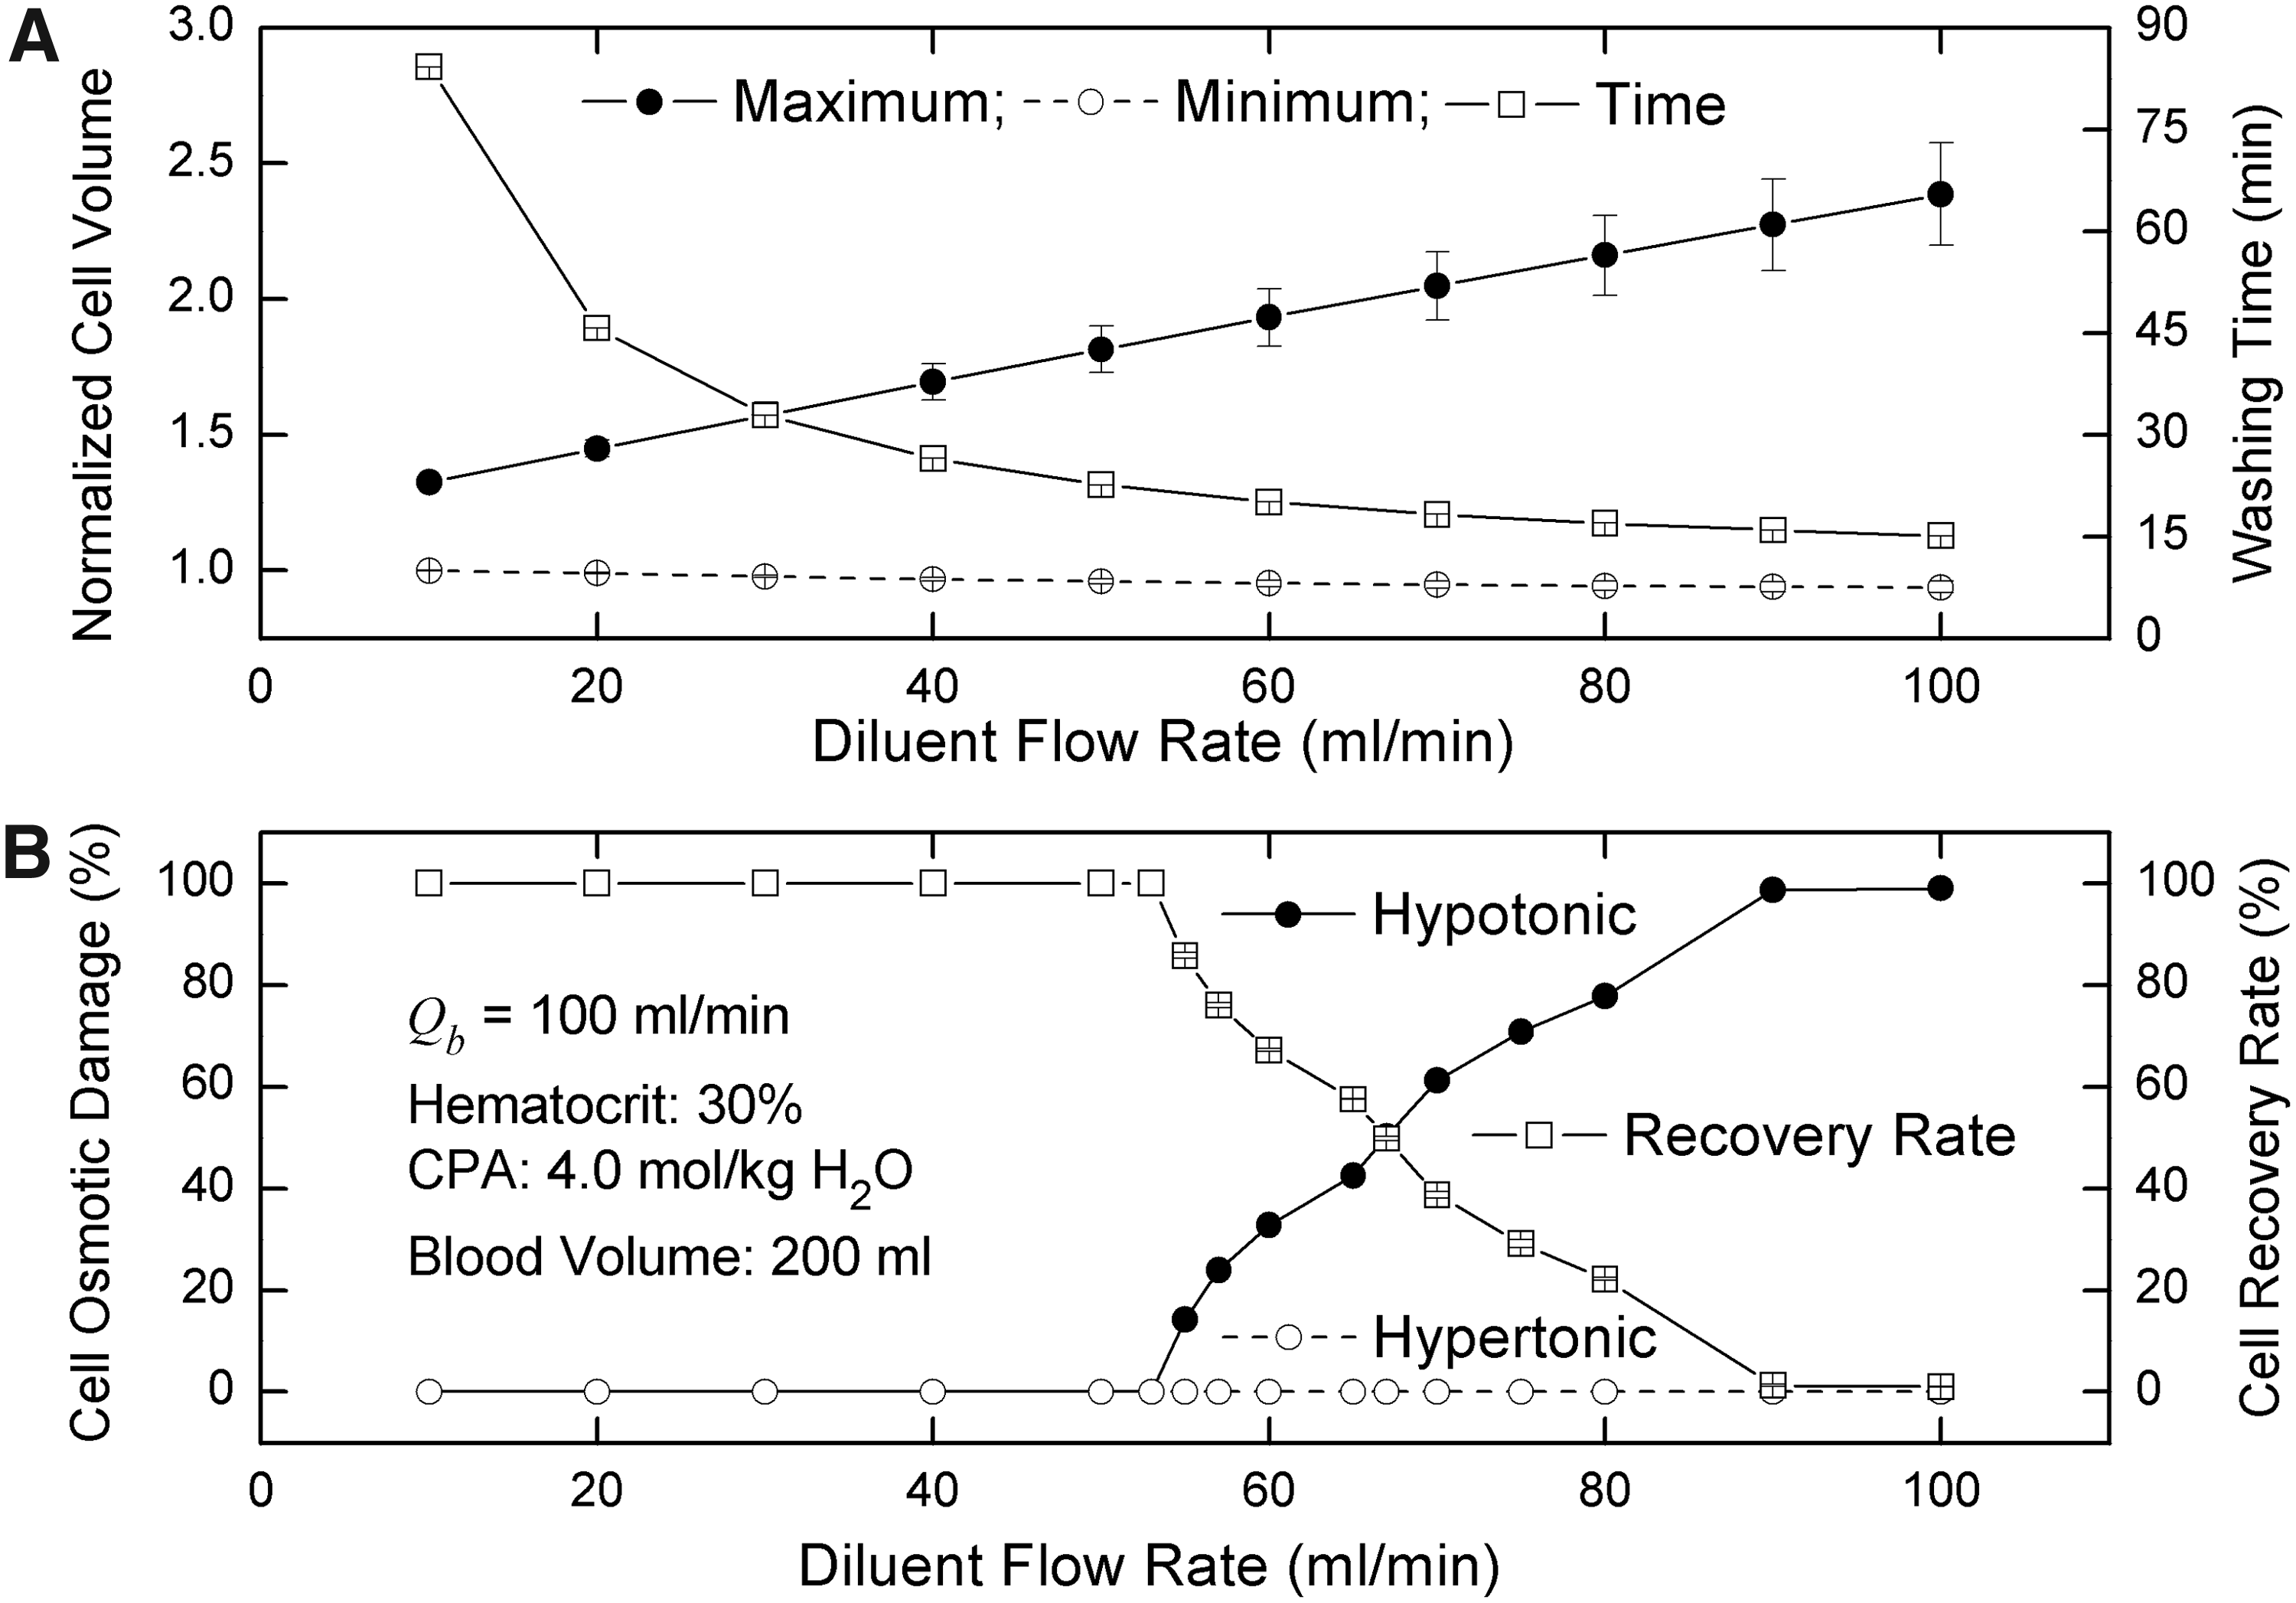
Effects of diluent flow rates on washing time, cell volume, and osmotic damage.

Effects of diluent flow rates with a fixed flow ratio of blood to diluent.
In addition, an interesting result is that the standard deviation of the maximum volume decreases as the blood flow rate increases, whereas it increases as the diluent flow rate increases (See Figs. 8A and 9A). This phenomenon is strongly related to the average frequencies of blood units entering the peripheral system. Although the increase of blood flow rates reduces the cycle numbers, it still improves the frequencies, i.e., makes the cycle numbers of all blood units more uniform. Therefore, the standard deviation is smaller when the blood flow rate is higher. However, if the diluent flow rate is higher, the washing time is shortened, which decreases the cycle numbers. Consequently, the dispersion of the cycle numbers of all blood units becomes more serious, causing an increase of the standard deviation.
Conclusions
In this article, the discrete mass transfer model we developed earlier was modified for the dilution-concentration method to study the removal of CPAs from cryopreserved blood. Compared with the continuum model proposed in our previous work, this discrete model can not only statistically estimate the osmotic damage of RBCs for the dilution-concentration method, but also accurately can provide safe and effective operating conditions for avoiding the osmotic damage of RBCs. Here, the continuous process can be described by a discrete method, which is essentially based on the fact that diffusion is negligible when compared with convection. In this situation, the total moles of each solute remain constant in each unit; the mass transfer of CPAs across the cell membrane can only cause the redistribution of CPAs on both sides of the cell membrane. If blood units with CPAs are not diluted, no mass transfer across the cell membrane occurs; however, when the dilution is carried out, the CPAs inside cells will be transferred out of cells, which results in a decrease of intracellular CPA concentration. This process occurs only in single units, but not between units. In the plasma filter, the filtration process still can be considered as a redistribution process of extracellular solution, which not only concentrates RBCs, but also removes CPAs.
The modified discrete model was validated with respect to the experimental results either with or without cells. The predicted results agree well with the experimental data. More importantly, the discrete model for the first time permits prediction of the osmotic damage of cells. The results show that in the dilution-concentration method, both increasing blood flow rates and decreasing diluent flow rates can reduce the osmotic damage of cells; however, only the former can shorten the washing time of CPAs. Therefore, in practice, increasing blood flow rates is highly recommended. As for the hematocrit effect, after balancing pros and cons, a lower hematocrit is better. In the dilution-concentration method, blood volume could also affect the recovery rate of cells; however, this could be solved by increasing the tubing length between dilution point and filter inlet.
In practice, some factors, for example, rouleaux formation and turbulence, could also affect osmotic damage of cells, which increase the difficulty of the theoretical prediction and thereby were not taken into account in this study. Additionally, it is necessary to point out that, the polydispersity of RBCs was not taken into account in this study. As a matter of fact, red blood cells in different growth stages have different isotonic volumes, surface areas, osmotically inactive volumes, and membrane properties. The polydispersity of RBCs makes it more difficult to find the proper operational condition for reducing or even avoiding osmotic damage of cells because it is not only a mass transfer problem, but also a statistical one. Fortunately, the discrete model developed here provides an effective tool to solve this problem and the detailed strategy will be presented soon.
Footnotes
Author Disclosure Statement
The authors have no conflicts of interest or financial ties to disclose.
This work was supported by the Fundamental Research Funds for the Central Universities of China (No. WK2100000001) and the National Natural Science Foundation of China (Nos. 51076149 and 51276179).