
Abstract
The question of how best to attribute the unit costs of the annotated biospecimen product that is provided to a research user is a common issue for many biobanks. Some of the factors influencing user fees are capital and operating costs, internal and external demand and market competition, and moral standards that dictate that fees must have an ethical basis. It is therefore important to establish a transparent and accurate costing tool that can be utilized by biobanks and aid them in establishing biospecimen user fees. To address this issue, we built a biospecimen user fee calculator tool, accessible online at www.biobanking.org. The tool was built to allow input of: i) annual operating and capital costs; ii) costs categorized by the major core biobanking operations; iii) specimen products requested by a biobank user; and iv) services provided by the biobank beyond core operations (e.g., histology, tissue micro-array); as well as v) several user defined variables to allow the calculator to be adapted to different biobank operational designs. To establish default values for variables within the calculator, we first surveyed the members of the Canadian Tumour Repository Network (CTRNet) management committee. We then enrolled four different participants from CTRNet biobanks to test the hypothesis that the calculator tool could change approaches to user fees. Participants were first asked to estimate user fee pricing for three hypothetical user scenarios based on their biobanking experience (estimated pricing) and then to calculate fees for the same scenarios using the calculator tool (calculated pricing). Results demonstrated significant variation in estimated pricing that was reduced by calculated pricing, and that higher user fees are consistently derived when using the calculator. We conclude that adoption of this online calculator for user fee determination is an important first step towards harmonization and realistic user fees.
Introduction
H
The design, scope, and aim of biobanks vary depending on the type of biobank and the research it is intended to support. Small collections aimed at supporting a specific research project or mono-user biobanks 4 may have few staff members, a small-scale accrual scope with little to no initial intention of releasing or distributing biospecimens to secondary parties. Collections associated with several research groups or clinical trials (oligo-user biobanks) typically have limited numbers of staff members and may or may not be designed to release biospecimens outside their collaborative group. Larger formal collections are most likely to identify themselves as biobanks (poly-user biobanks) and it is this group that generally has a larger accrual scope, resources, and multiple users outside the biobank proper. 4
It has long been recognized within many types of core research service facilities that true cost estimates and user fees are difficult to define. For instance, when facilities use the space and utilities already existing within an institution, these indirect costs are hard to attribute uniformly. For biobanks, several cost categories (e.g., consenting) can be direct costs but are also often indirect and it is hard to factor in contributions from clinical personnel (e.g., pathologists), and databases (e.g., cancer registries).
We have built a biospecimen user fee calculator that incorporates the concepts of biobank activities, classification, and a development phase to aid biobanks in modeling the costs of appropriate user fees. This tool can be adapted for use by different types of biobanks and incorporates many variables that can be changed to determine user fees. We hypothesize that the cost modeling tool will change the behavior of assessing biospecimen user fees. The short-term purpose of the tool is not to equalize pricing, but rather to enable biobanks and users to better appreciate ‘total’ costs associated with biobanking and to help biobanks within networks to appreciate where and how differences in their costs and fees arise. In the long-term, this may serve to promote harmonization and common ranges for biobank fees (e.g., consulting fees etc.) and guide users in creating a more consistent biobank fee structure.
Methods and Results
Design of a biospecimen user fee calculator tool
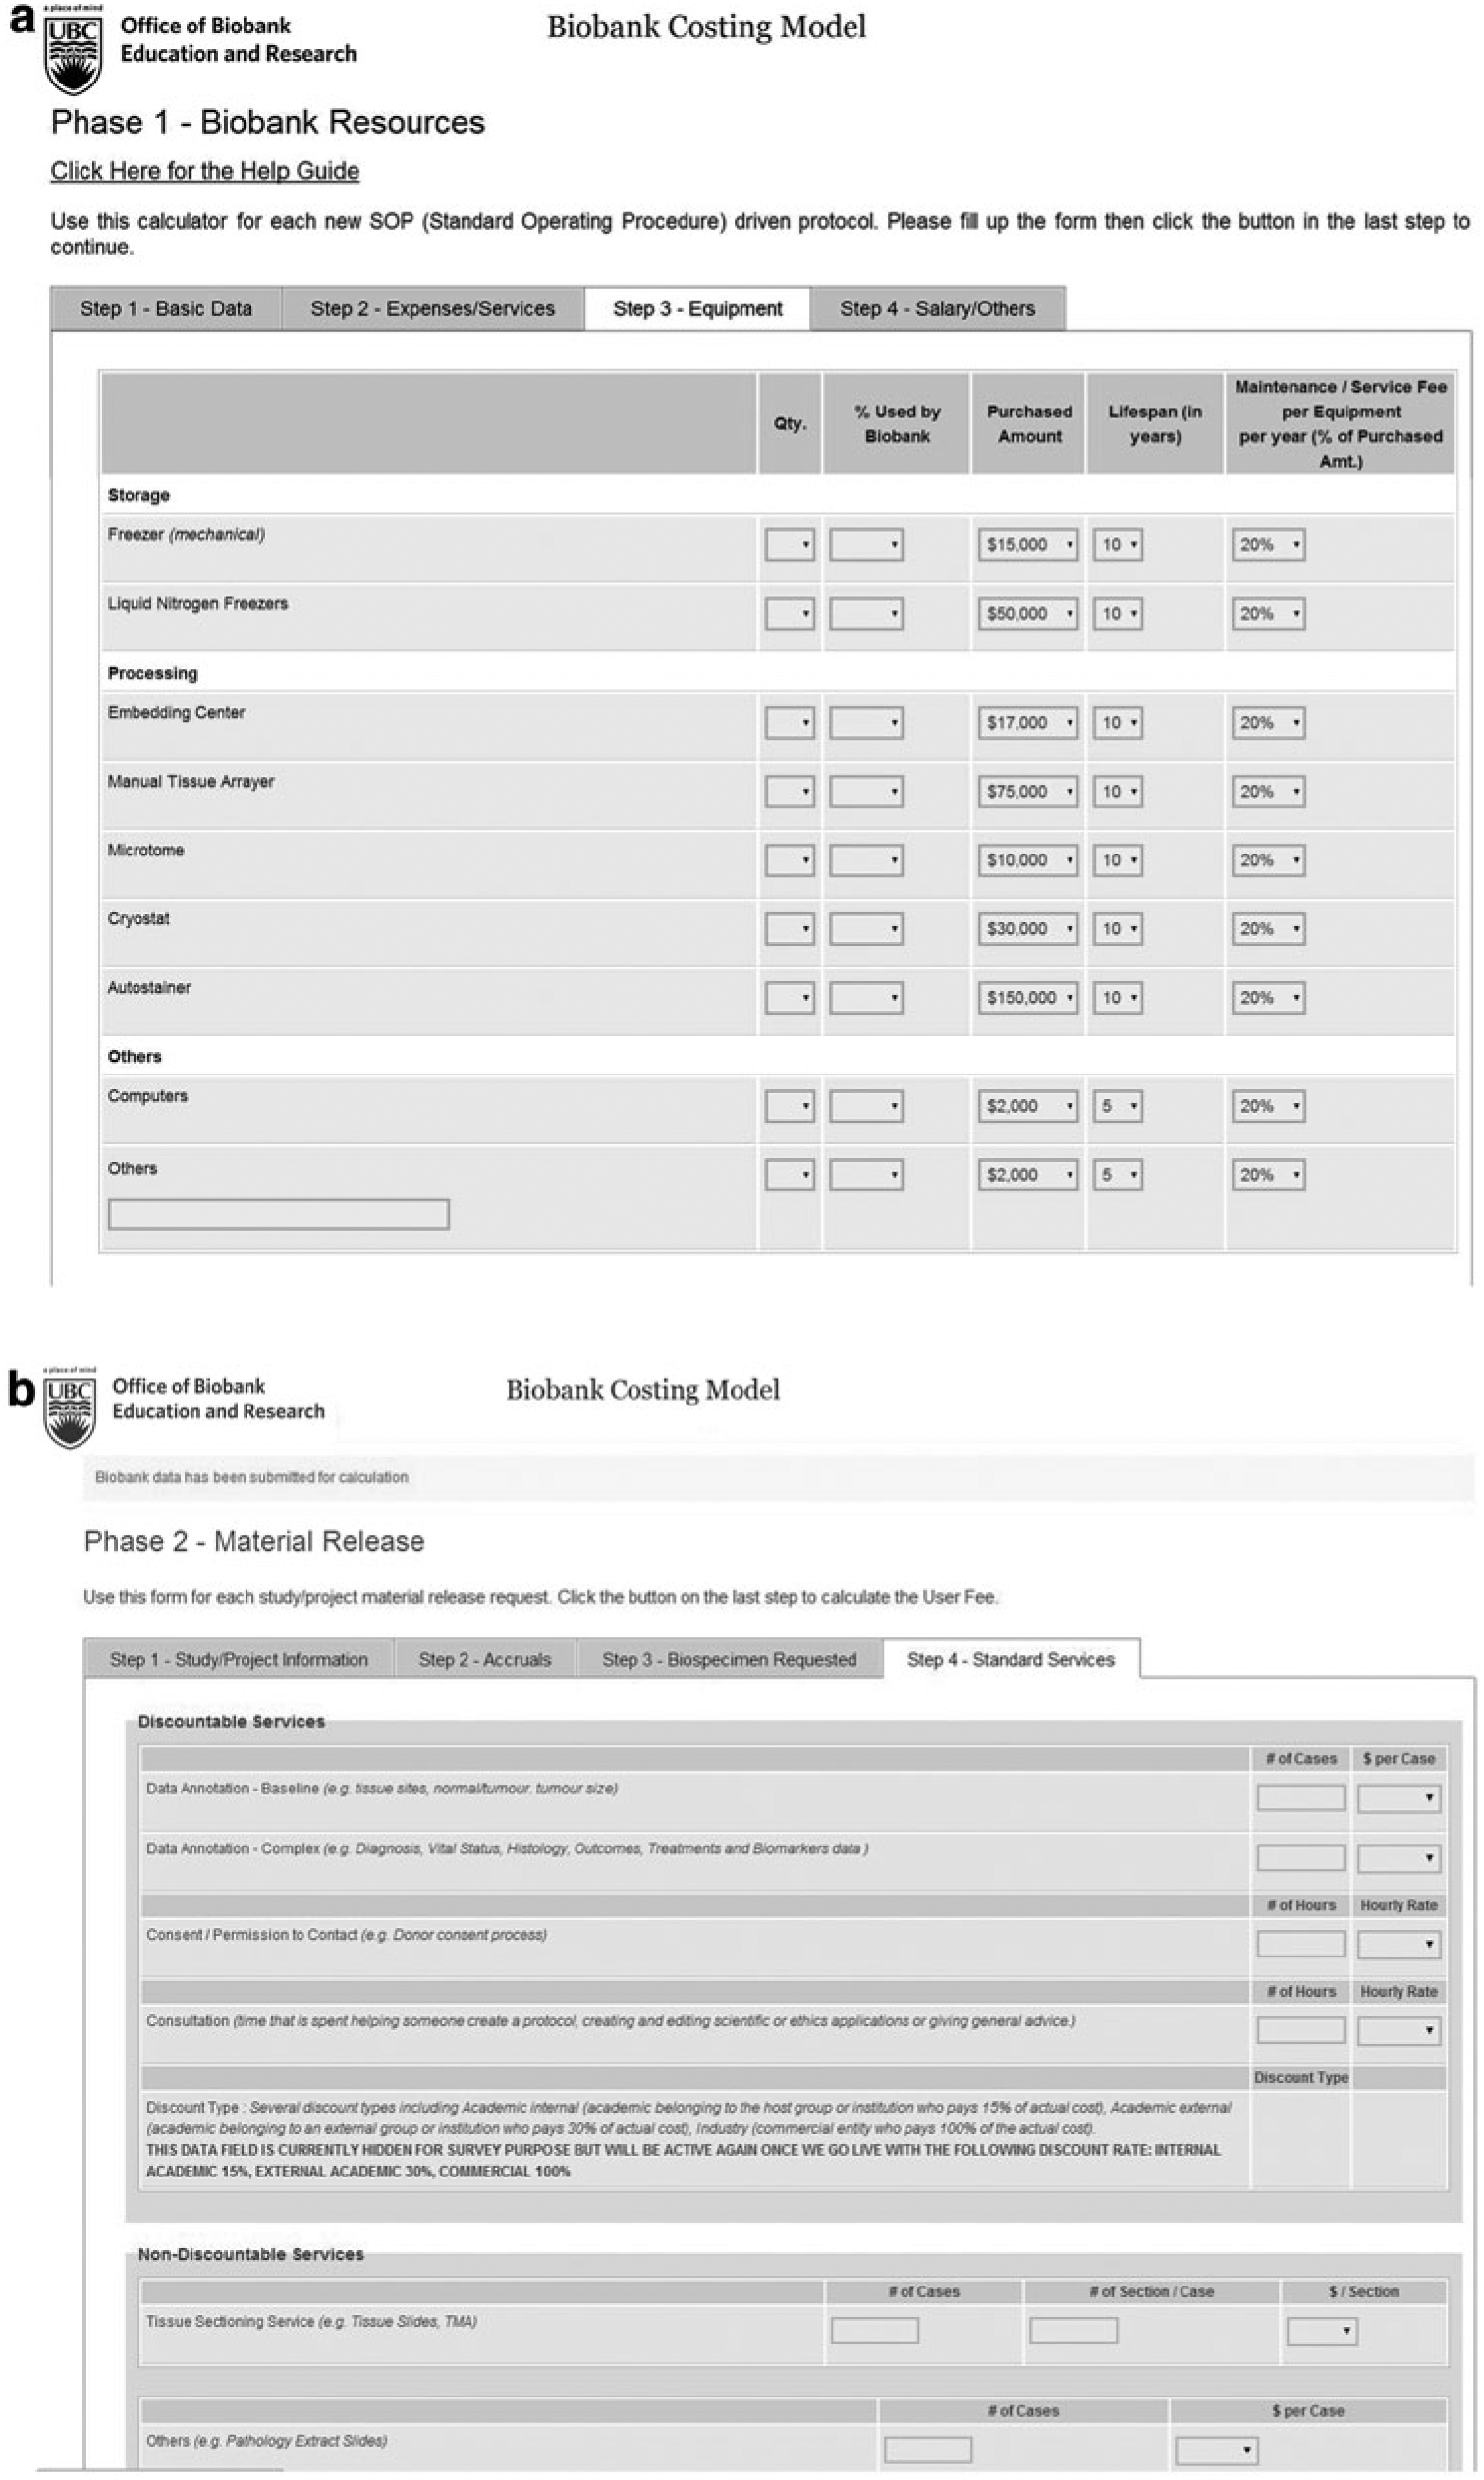
We designed a biobank user fee calculator tool that is available online at www.biobanking.org. The calculator tool was planned in order to calculate user fees on the basis of input provided in two phases (Fig. 1a and b). Phase 1 allows users to annually input and update costs associated with overall capital and operating expenses. This phase includes fields to enter annual biobank expenses such as liquid nitrogen and laboratory supplies, as well as purchased services (e.g., pathology accrual, histology annotation); laboratory equipment (mechanical freezers, key histology equipment), and employee salaries. Phase 1 values are imported into phase 2 to serve as a foundation for the calculation of biospecimen release fees on the basis of biobank operational and research user requirements. Users first enter characteristics surrounding the collection and attribution of the biospecimens to the biobank's initial collection: that is input basic accrual information around the biospecimen type; priority of the biospecimen type (i.e., rank of biospecimen type in the context of strategic collection priority); proportion of biobank resources devoted to collecting the specific biospecimen type (i.e., % of actual operational focus of biobank); and value for the proportion of cases associated with type of specimen (e.g., 40% cases have frozen blocks). Next, users enter information specific to the research request: number of biospecimens requested and type or format requested. Lastly, information regarding requested services can be entered that can include: cohort selection, consultation and data annotation fees, as well as nondiscountable services (e.g., shipping) and discounts that can be applied to the requesting party (i.e., internal, external, or industry users).
Development of a biospecimen user fee calculator tool
To create the working calculator as an online tool, it was developed using an open source software/web-enabled database, MySQL (Oracle Corporation, Redwood Shores, CA,) and is hosted by the University of British Columbia (UBC) Faculty of Medicine IT (MEDIT) Infrastructure. The software stacks that make the core of the system include Apache and PHP in a Windows 2008 R2 platform. The calculator tool is designed to allow users to selectively enter biobank resource related data elements as recommended by the biobanking community: Phase 1 tabs have the following categories (Biobank Profile, Expenses/Services, Equipment, and Salary/Others). Phase 2 tabs have fields for entering accruals, biospecimens requested, and standard services. Users are provided with default values for many fields and are not required to fill in all fields but can modify or populate specific fields as relevant to specific aspects their biobank. Some fields consist of drop-down lists to facilitate standardized data entry where possible. Upon completion of the form, submission of the data to the underlying database enables calculation of the material release cost.
Default value determination for the biospecimen user fee calculator tool
After creating the beta version of the online calculator tool, we surveyed the Canadian Tumour Repository Network (CTRNet) management team 5 biobank members (seven biobanks) with set biobank examples in order to determine commonly agreed default values across a national network. This survey also sought to identify user interface issues, modify terminologies, and confirm common data definitions for fields. This survey was followed by a second round of design modification and revisions based on this input to create the final release version of the tool and to test its effects on approach to pricing (see below). In the survey across the biobank network, we found a wide variation in suggested values for operational default values such as personnel salaries (Biobank Coordinator; Data Manager, Consent Staff ), most naturally a direct result of individual biobank's funding sources and budgets. Additionally, the calculator allows the application of different discounts for local and distant academic users and industry users, which was an area of variation and subsequent debate. Across CTRNet, members identified that there were different approaches to applying these discounts primarily dependent on the scope and scale of the request type. Therefore, in the final release version we installed agreed upon default values but ensured the ability to apply different discounts (e.g., academic vs. industry) and also made this a nonmandatory field. The biggest source of user variation across CTRNet included the approach to charging for standard services such as histology services, clinical chart data abstraction, and pathology-related services (e.g., requesting paraffin blocks). Prices applied to aliquots—especially tissue aliquots—were a big source of variation. Some biobanks create extra aliquots when processing biospecimens according to a set protocol (e.g., extra tubes, blocks) while some biobanks create their aliquots on demand. In the latter scenario, costs attributed to time and services to create these aliquots tended to increase the release scenario costs. Similarly, abstracted data showed two inherent pricing trends: while some banks charged it as a service piece when external databases needed to be accessed to compile all the data, others attributed the cost as a nonitemized part of the release ‘package’ when this work was done within the biobank.
Testing the final release version
Approaches to user fee determination varies substantially between biobanks, even those within established networks such as CTRNet where each node has different origins, stakeholders, and funding sources that predate the formation of the network. We therefore elected to test the calculator using three theoretical scenarios that comprised a “typical” biobank and several “typical” release examples relevant to all biobanks in the network (Table 1). We enrolled four participants from CTRNet biobanks who had not been involved in the first survey in order to test the final version of the calculator using these scenarios and also to test the hypothesis that the calculator tool could change the way biobanks approached user fees and reduce variation between user fee pricing. Each subject was first presented with the background information on the theoretical biobank, followed by each scenario in turn, and then asked to estimate user fee pricing based on their experience (estimated pricing). Once all responses were recorded, the participant was then presented with the cost calculator and asked to calculate and record fees for the same three scenarios using the online cost modeling tool (calculated pricing). Subjects were coached to help them navigate the calculator for consistency but were free to determine what to enter in the relevant fields and to alter default values as they chose based again on their interpretation of the biobank in the example. Subjects were also asked for input on interface and general comments on the use of the calculator while working on these same scenarios.
Participants were given the background to a hypothetical tumor biobank
The results for the three release scenarios are presented in Table 2. As anticipated, the responses for estimated prices for scenario 1, the least complex scenario, were the lowest, while those for the third scenario, the most complex, were the highest. There was an unexpected degree of variation in estimated pricing amongst participants, with 3-, 11-, and 10-fold spreads between the lowest and highest estimates in each respective scenario. In contrast, the calculated prices showed considerably less relative variation, with between 1.7-, 1.5-, and 4-fold differences in pricing within respective scenarios. Moreover, when using the calculator the participants all arrived at significantly higher prices for all three scenarios (Fig. 2, p<0.0005, Wilcoxon t-test) and the mean calculated prices were 3.3-, 1.7-, and 1.7-fold higher than the mean estimated prices for each scenario.
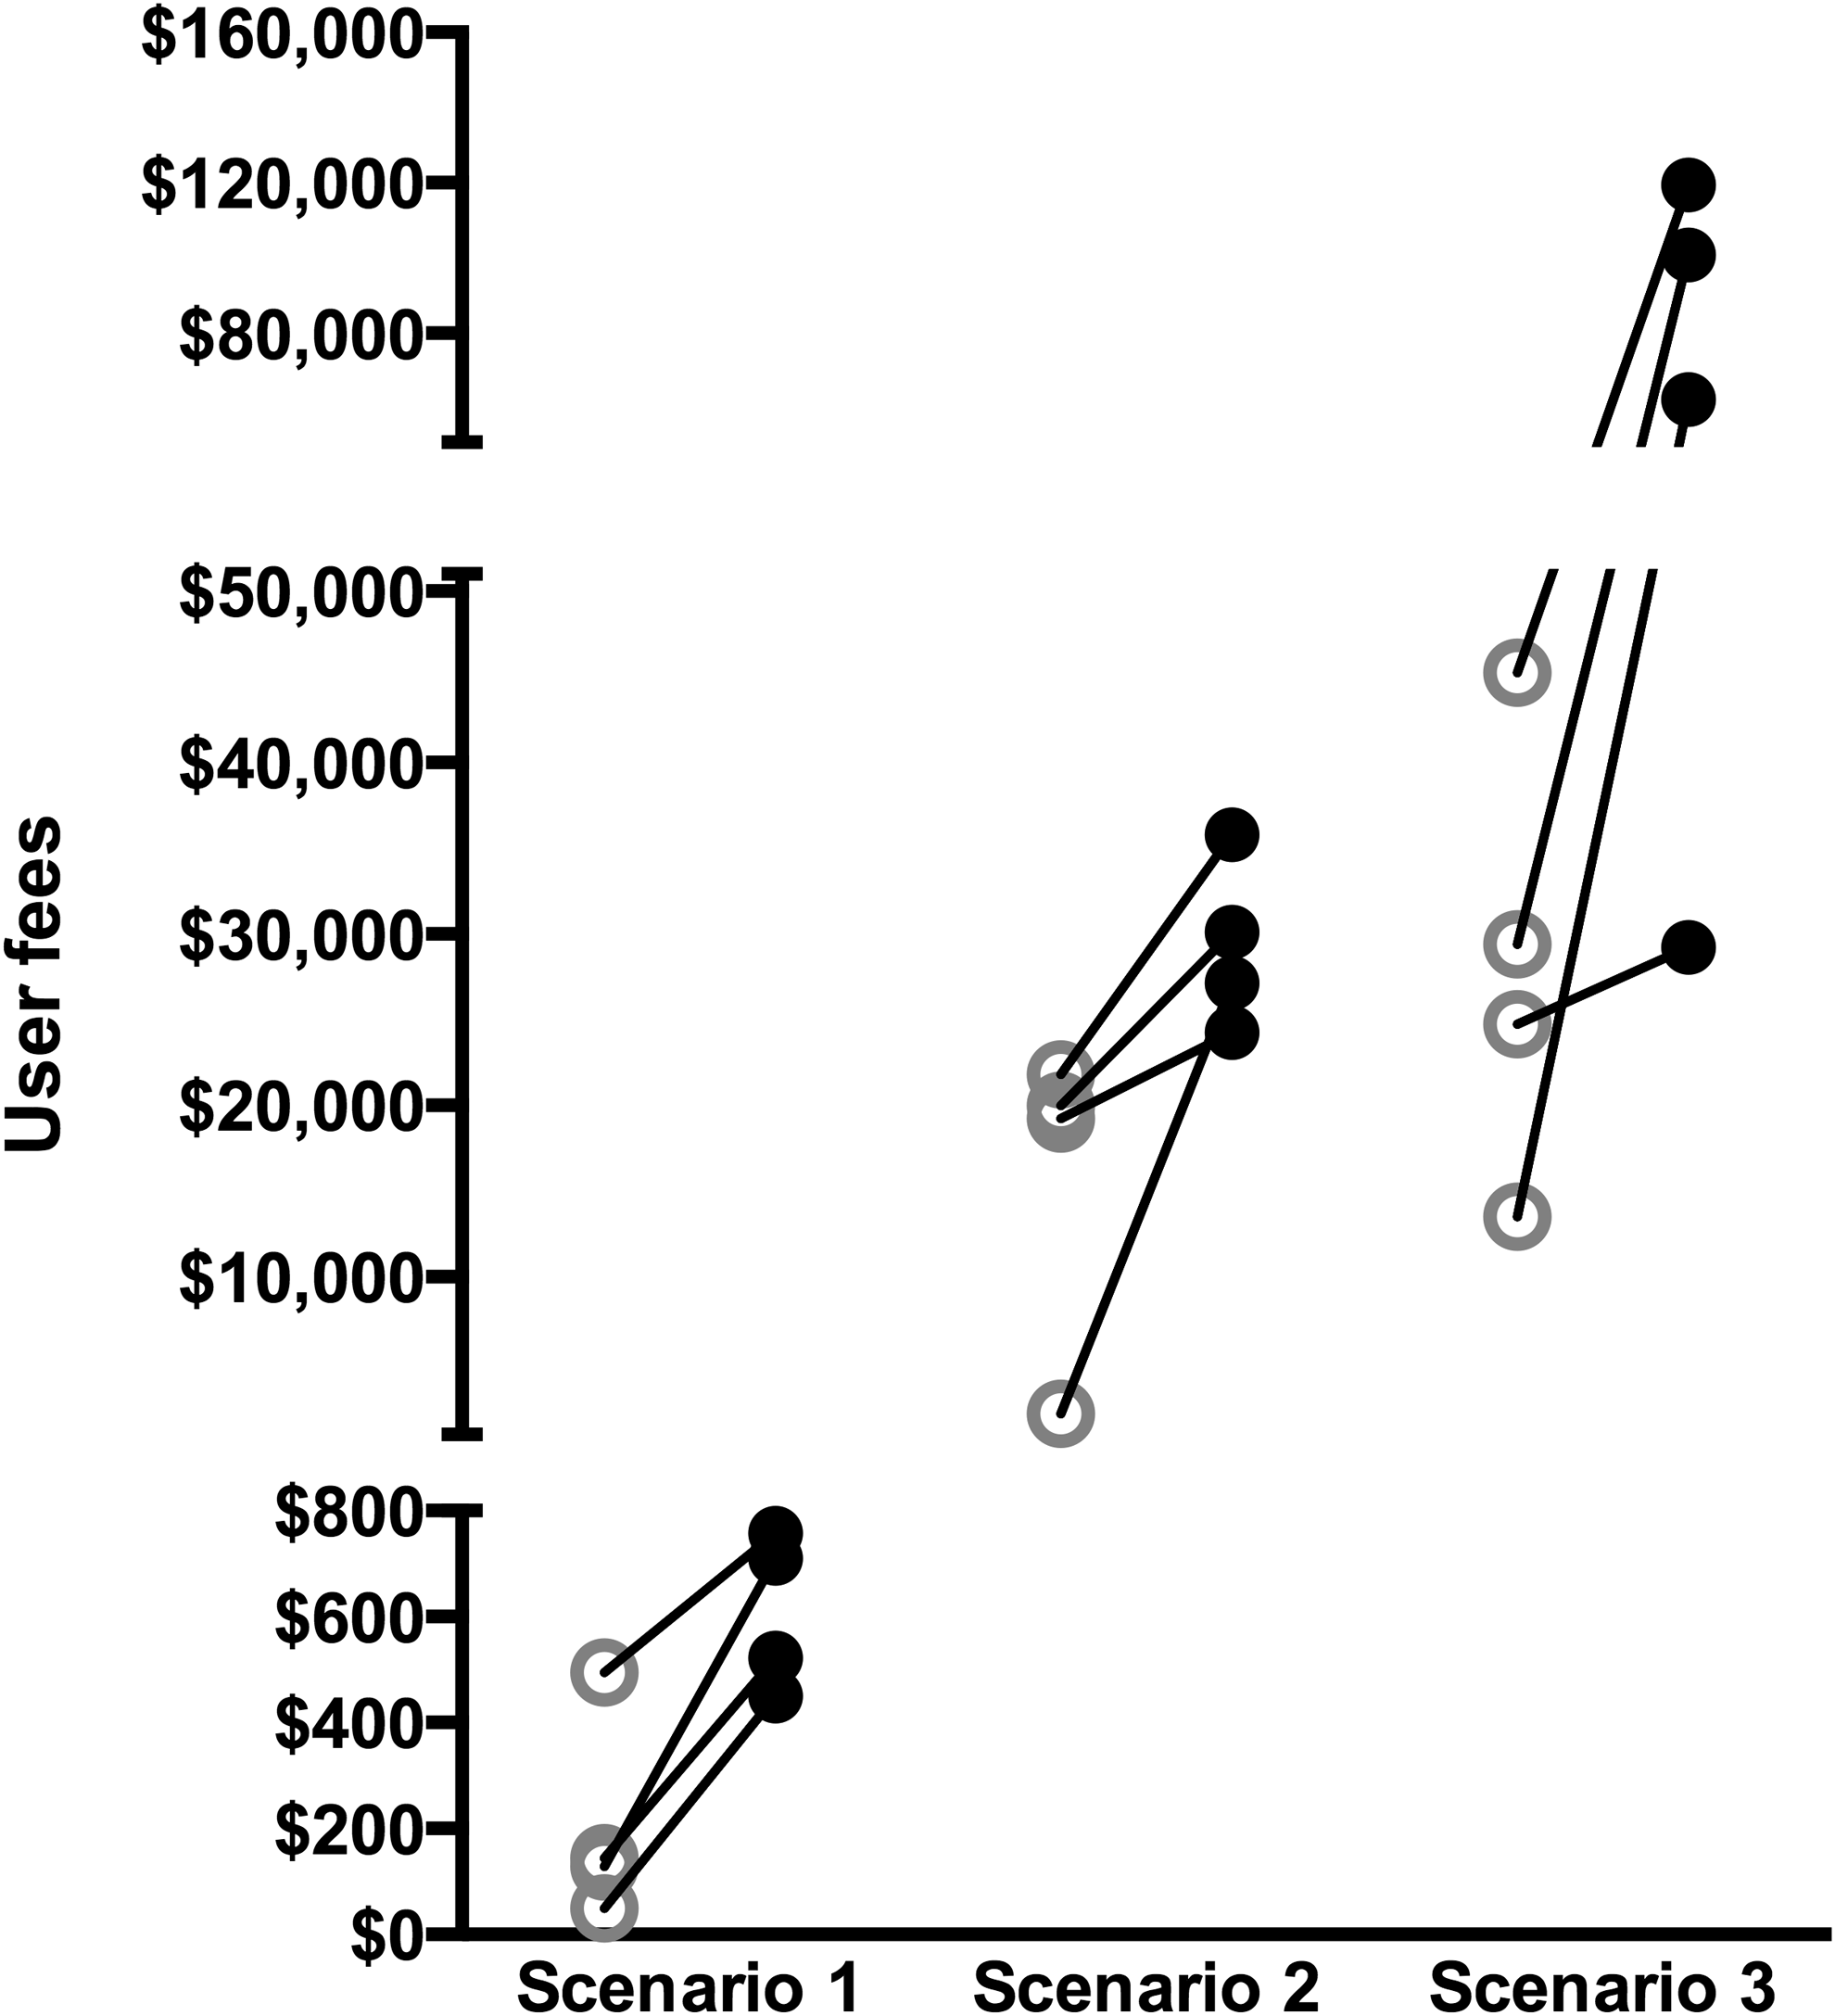
Graph showing differences in participant determination of Estimated (open circles) and Calculated (solid circles) user fee values for each scenario. The Y-axis has been divided into three segments to accommodate the different pricing ranges between scenarios. The increase in pricing between estimated and calculated values was significant (p<0.0041, two-way ANOVA).
Discussion
We have developed an online user fee calculator and demonstrated that significant variation in current approaches to estimate user fee pricing can be reduced by calculated pricing. We have also demonstrated that higher user fees are consistently derived when using the calculator.
Some of the factors influencing user fees are activities associated with capital and operating costs, internal and external demand and market competition, and moral standards that dictate that fees must have an ethical basis. Several funding formulas have been proposed; the proposal of biospecimen user-fees is not new but there are no standard approaches in common use. In generating this calculator, we set out to increase consistency and transparency in deriving such fees. Inherent in this study are “philosophies” held by those that create biobank fees that influences how and when they attribute costs. Understanding these nuances, combined with a universally available tool, may be the first and necessary steps in the discussion around how to develop a standardized approach to user fees and eventually pricing harmonization.
To meet the needs of, and ensure that translational research proceeds rapidly and efficiently, biobanks assume several challenges. One challenge is the assembly of case numbers in sufficient scale to enable selection of study cohorts comprising biospecimens and treatment and outcomes data that can take many years. For example, tumor biobanks may take up to five years to accrue sufficient numbers of cases representing a single tumor type and then many additional years (typically another three to five years or more) to acquire sufficiently informative outcomes data on all cases. The research conducted on the selected cases also takes time to result in publications. Publications are an intermediate indicator of value, and ultimately the impact of biobanks is to enable research to be translated into improvements in patient care. But this often requires cycles of iterative basic and translational research, validation, and clinical trials over many more years. Another challenge or inefficiency is that once cases have been assembled by the biobank to enable selection on the basis of multiple research criteria, a significant fraction of cases, typically between 50%–90% of the biobanks stocks, 6 will often remain unused. Just predicting and/or determining the optimal scale and diversity of the “stock” can be an added cost (e.g., by conducting quality control on all biospecimens at the outset to weed out substandard biospecimens or those with features such as high tumor cell composition more likely to be requested) and hard to predict (e.g., cases associated with therapies that become outmoded and less important to study during the lifespan of the biobank). Since storage costs are usually much lower than accrual costs, it may not always make sense to cull from the collection. But cumulative costs of maintaining infrastructure over many years without direct results makes securing long-term stable funding a common problem in biobanking. 7 Broadly accepted measures of biobank impact are clearly lacking but are essential to make the business case for long term funding. 8
The scope and scale of biobank infrastructure varies, as does the formula of funding such costs. Common funding models for academic biobanks include funding from government sources, institutions through infrastructure assignments, research agencies and commercial entities through direct and indirect grants, charitable donations from the public to not-for-profit foundations, and user fees. 9 In our view, 5 the optimal funding formula for an academic institutional multiuser biobank is a combination of core platform funding through institutional and public philanthropy (>= 50%), research grants tied to specific prospective project goals (25%–40%), and user fees related to access to the biobank stock (10%–25%).
Revenue from user fees is unpredictable and may take many years to realize. These fees are nevertheless an important component to ensure that the investment in biobanks as a research infrastructure is scaled and geared to the activity of research. Several factors should be considered in assessing user fees. These include internal biobank capital and operating activities required to generate the product, market forces that influence decisions to access a specific biobank and the trade-off between quantity and quality, and moral standards that dictate that costs should have an ethical basis.
As it is unethical to “sell” human tissue and fluids, it is essential to adopt costing models that provide an ethical basis for user fees that relate only to the services provided by the biobank (collection, processing, annotation, storage, and release). The manner in which these services are attributed to individual biospecimens and ultimately to user fees should be informative. For a generalized fee structure to have wider appeal and greater impact, biospecimen users need to understand the reality of the attribution of costs and prospective fees and currently education about the reality of costs to the users is inconsistent and variable amongst biobanks. When shared with users, this information could be used to accurately forecast budgets and the costs could be embedded within research grant proposals for biospecimen use.
Use of the calculator by participants showed an increase in all three scenario prices compared to baseline scenario pricing. Although hypothetical, the biobank costs and the release scenarios we have used here are typical for many tumor biobanks. To put this into perspective, considering just these three scenarios that might comprise a portion of the typical annual release activity from a tumor bank, the revenue based on the average estimated pricing before any discounts are applied would have been $35,361 while the revenue from calculated pricing would have been $86,330. In current practice, it is our experience that biobanks generally take the stance of keeping pricing too low in order to increase uptake and encourage usage of biospecimens by as many researchers as possible. This may be partly because some biobanks have often been converted from old research collections and/or developed by academics with support of research funding agencies with the philosophy that the biobank should not charge. Another factor is that many researchers make requests that have not been previously adequately planned for or budgeted for within grants. Underpricing of biospecimen user fees is endemic, and this study is a first step in further discussions around evaluating ethical biospecimen user fee pricing in the biobanking community as a whole. This dialogue is important to ensuring the sustainability of biobanks in the future.
The first release of this tool is accessible for any biobank, and available online at www.biobanking.org. In this first iteration, users must enter all data on each occasion to generate the user fee. Plans for the second release of the tool include additional features such as user account creation and data storage. This would allow for the re-use of biobank capital cost data and saving this for preparing new releases. Additionally, we plan to enable a PDF report to be generated for each release. These updates will improve the system while fostering process automation and will further enhance usability while maintaining the same robustness that end users experienced in the testing version described here.
Conclusions
We have built a cost modeling tool that incorporates the concepts of biobank activities, classification, and development phase to aid biobanks in modeling the costs of their biospecimens and appropriate user fees. The first version of this tool was built with a poly-user tumor biobank involved in passive case accrual to enable future retrospective case selection, but can be used and adapted for use by any biobank type, including nontumor focused biobanks.
We have also demonstrated that there is wide variation amongst users in their approach to pricing biospecimen user fees. Use of the calculator showed an overall increase in values when compared to estimated prices. We suggest that this study is a first step in a larger and important discussion around biospecimen user fees.
Footnotes
Acknowledgments
We would like to thank individuals from the CTRNet member biobanks that participated in and gave insightful comments into the creation and production of this tool, including Sindy Babinszky, Candace Carter, Manon Deladurantaye, Charlene Karnoven, Sugy Kodeeswaran, and Shakeel Virk. Additionally, we thank Stefanie Cheah for time and effort in the review of the data, and Sheila O'Donoghue and Sara Nußbeck in providing valuable comment on the calculator tool itself.
Author Disclosure Statement
There are no conflicts of interest to disclose.