
Abstract
The optional RNase digest that is part of many DNA extraction protocols is often omitted, either because RNase is not provided in the kit or because users do not want to risk contaminating their laboratory. Consequently, co-eluting RNA can become a “contaminant” of unknown magnitude in a DNA extraction. We extracted DNA from liver, lung, kidney, and heart tissues and established that 28–52% of the “DNA” as assessed by spectrophotometry is actually RNA (depending on tissue type). Including an RNase digest in the extraction protocol reduced 260:280 purity ratios. Co-eluting RNA drives an overestimation of DNA yield when quantification is carried out using OD 260 nm spectrophotometry, or becomes an unquantified contaminant when spectrofluorometry is used for DNA quantification. This situation is potentially incompatible with the best practice guidelines for biobanks issued by organizations such as the International Society for Biological and Environmental Repositories, which state that biospecimens should be accurately characterized in terms of their identity, purity, concentration, and integrity. Consequently, we conclude that an RNase digest must be included in DNA extractions if pure DNA is required. We also discuss the implications of unquantified RNA contamination in DNA samples in the context of laboratory accreditation schemes.
Introduction
E
Purified DNA can be quantified in two ways, both of which are potentially compromised by RNA co-elution: OD 260 nm spectrophotometry on a device such as a NanoDrop (which will overestimate DNA concentration because both DNA and RNA absorb light at 260 nm) or spectrofluorometry using an intercalating dye that specifically binds to double-stranded DNA (dsDNA), such as PicoGreen (but the quantity of co-purified RNA contaminating the DNA sample will be unknown).
Although it is generally known that RNA can co-purify with DNA, a journal search has failed to reveal any independent, peer-reviewed publications that describe or quantify this phenomenon. This is an issue that needs to be addressed because the implications of overestimated DNA concentrations could be serious if multiple DNA samples are destined for a downstream application that requires normalization of sample starting quantities. Also, biobank laboratories adhering to the Best Practice guidelines issued by the International Society for Biological and Environmental Repositories (ISBER) or those complying with laboratory accreditation standards such as ISO 17025:2005 must ensure that their biospecimens are accurately characterized in terms of their identity, purity, concentration and integrity. 1
The options facing laboratories are therefore to remove the RNA by incorporating an RNase step in the DNA extraction protocol (and accept the risks of contaminating equipment with RNase) or to establish that RNA co-elution in a DNA extraction is not an issue of significant magnitude and adopt a quantification protocol that will account for it. The lack of publications describing or quantifying RNA co-elution in a DNA extraction is a potential problem for laboratories that have a quality management system where their standard operating procedures need to be supported by evidence.
We have addressed these issues by experimentally quantifying the amount of RNA that is co-eluted in a DNA extraction using fresh-frozen rat tissue blocks of tissue-types known to yield different quantities of nucleic acids and endogenous nucleases: liver, lung, kidney, and heart.2–5 We carried out a series of DNA extractions with and without an RNase digest using a widely-used spin column kit (Qiagen's QIAamp DNA Mini Kit). We quantified total nucleic acid using OD 260 nm spectrophotometry and dsDNA using PicoGreen spectrofluorometry and present the results in terms of DNA purity, where “purity” is defined as protein contamination of nucleic acids and RNA contamination of DNA.
Materials and Methods
Liver, lung, kidney, and heart biospecimens were taken from 13 male Sprague Dawley rats that had been euthanized by cervical dislocation (ethical approval was granted by the Imperial College London Ethics Committee). Immediately after excision, the tissues were flash-frozen by immersion in liquid nitrogen, then stored at −80°C. Tissue cores (24 from liver, kidney, and heart plus 36 from lung) were taken from each biospecimen at <−130°C using a CryoXtract XT350 (CryoXtract Instruments, Woburn, Massachusetts, USA). This is a liquid nitrogen-cooled biospecimen aliquotting machine that uses probes to drill and extract multiple 3 mm cylindrical cores from a frozen biospecimen without thawing either the parent biospecimen or its daughter cores.
Each tissue core was weighed, homogenized in ATL lysis buffer using a Tissuelyser LT, then digested for 18 h in Proteinase K (all Qiagen, Hilden, Germany). DNA was extracted from the homogenate using the QIAamp DNA Mini Kit according to Qiagen's protocol, with the optional RNase digest being included in half of the extractions; so, in total, there were 12 liver, 18 lung, 12 kidney, and 12 heart extractions in each of the RNase positive (RNase+ve) and RNase negative (RNase-ve) cohorts.
The experiment was structured so that each cohort comprised tissue cores originating from 12 different rats, and that if a particular rat had been used in the RNase+ve cohort for a tissue type, the same rat was used in the equivalent RNase–ve cohort. The only exception to this were the lung samples, where 13 rather than 12 rats were used. Although the sample cores in each cohort were matched in terms of their rat origin, they ranged in weight from 2.3–30.6 mg. Because RNase is not included in the QIAamp DNA Mini kit, we used the RNase A Solution recommended by Qiagen.
DNA concentrations were assessed by spectrophotometry (OD 260 nm absorbance using a Take 3 plate fitted to a SyneryMx (BioTek Instruments, Highland Park, Winoosky, Vermont, USA)) and by spectrofluorometry using the Quant-IT PicoGreen dsDNA Assay (Life Technologies, Gent, Belgium). Purity was assessed by 260:280 and 260:230 (Synergy Mx). The DNA was also separated by electrophoresis on a 1% agarose gel, stained with Gel Red DNA and RNA stain (Biotium, Hayward, USA) and imaged on a ImageQuant LAS 4000 (GE Healthcare Bio-Sciences AB, Uppsala, Sweden). Statistical significances were calculated using the Student t-test.
The calculation that we used to quantify total nucleic acid, dsDNA, RNA, and ssDNA was as follows: total nucleic acid (quantified by spectrophotometry)=dsDNA (calculated using spectrofluorometry)+RNA (calculated using spectrophotometry of RNase-ve samples−spectrophotometry of Rnase+ve samples)+ssDNA (calculated using spectrophotometry in RNase+ve samples−spectrofluorometry in RNase+ve samples).
Results
When the DNA was assessed by spectrophotometry (OD 260 nm absorbance), the addition of RNase reduced the mean yield (μg per mg tissue) by 55.3% in liver, 22.5% in lung, 57.0% in kidney, and 50.9% in heart (Fig. 1A). Considerable sample-to-sample variation in yield within each tissue type was evident, even after normalizing for block weight, reflected in the large error bars (one standard deviation) in Figure 1A. Nevertheless, the differences in yield between the mean RNase+ve and RNase-ve cohorts were statistically significant in liver (p=0.009), kidney (p=3.2×10⁻⁷), and heart (p=0.03). In contrast, spectrofluorometry-assessed DNA yields (μg per mg tissue) were not affected by RNase (Fig. 1B): although three tissue-types (liver, kidney, and heart) showed a slight reduction in yield with RNase (11%, 3%, and 17%, respectively) the differences (including in the lung where yields were 30% higher in the RNase+ve cohort) were not statistically significant (p=0.27–0.84).
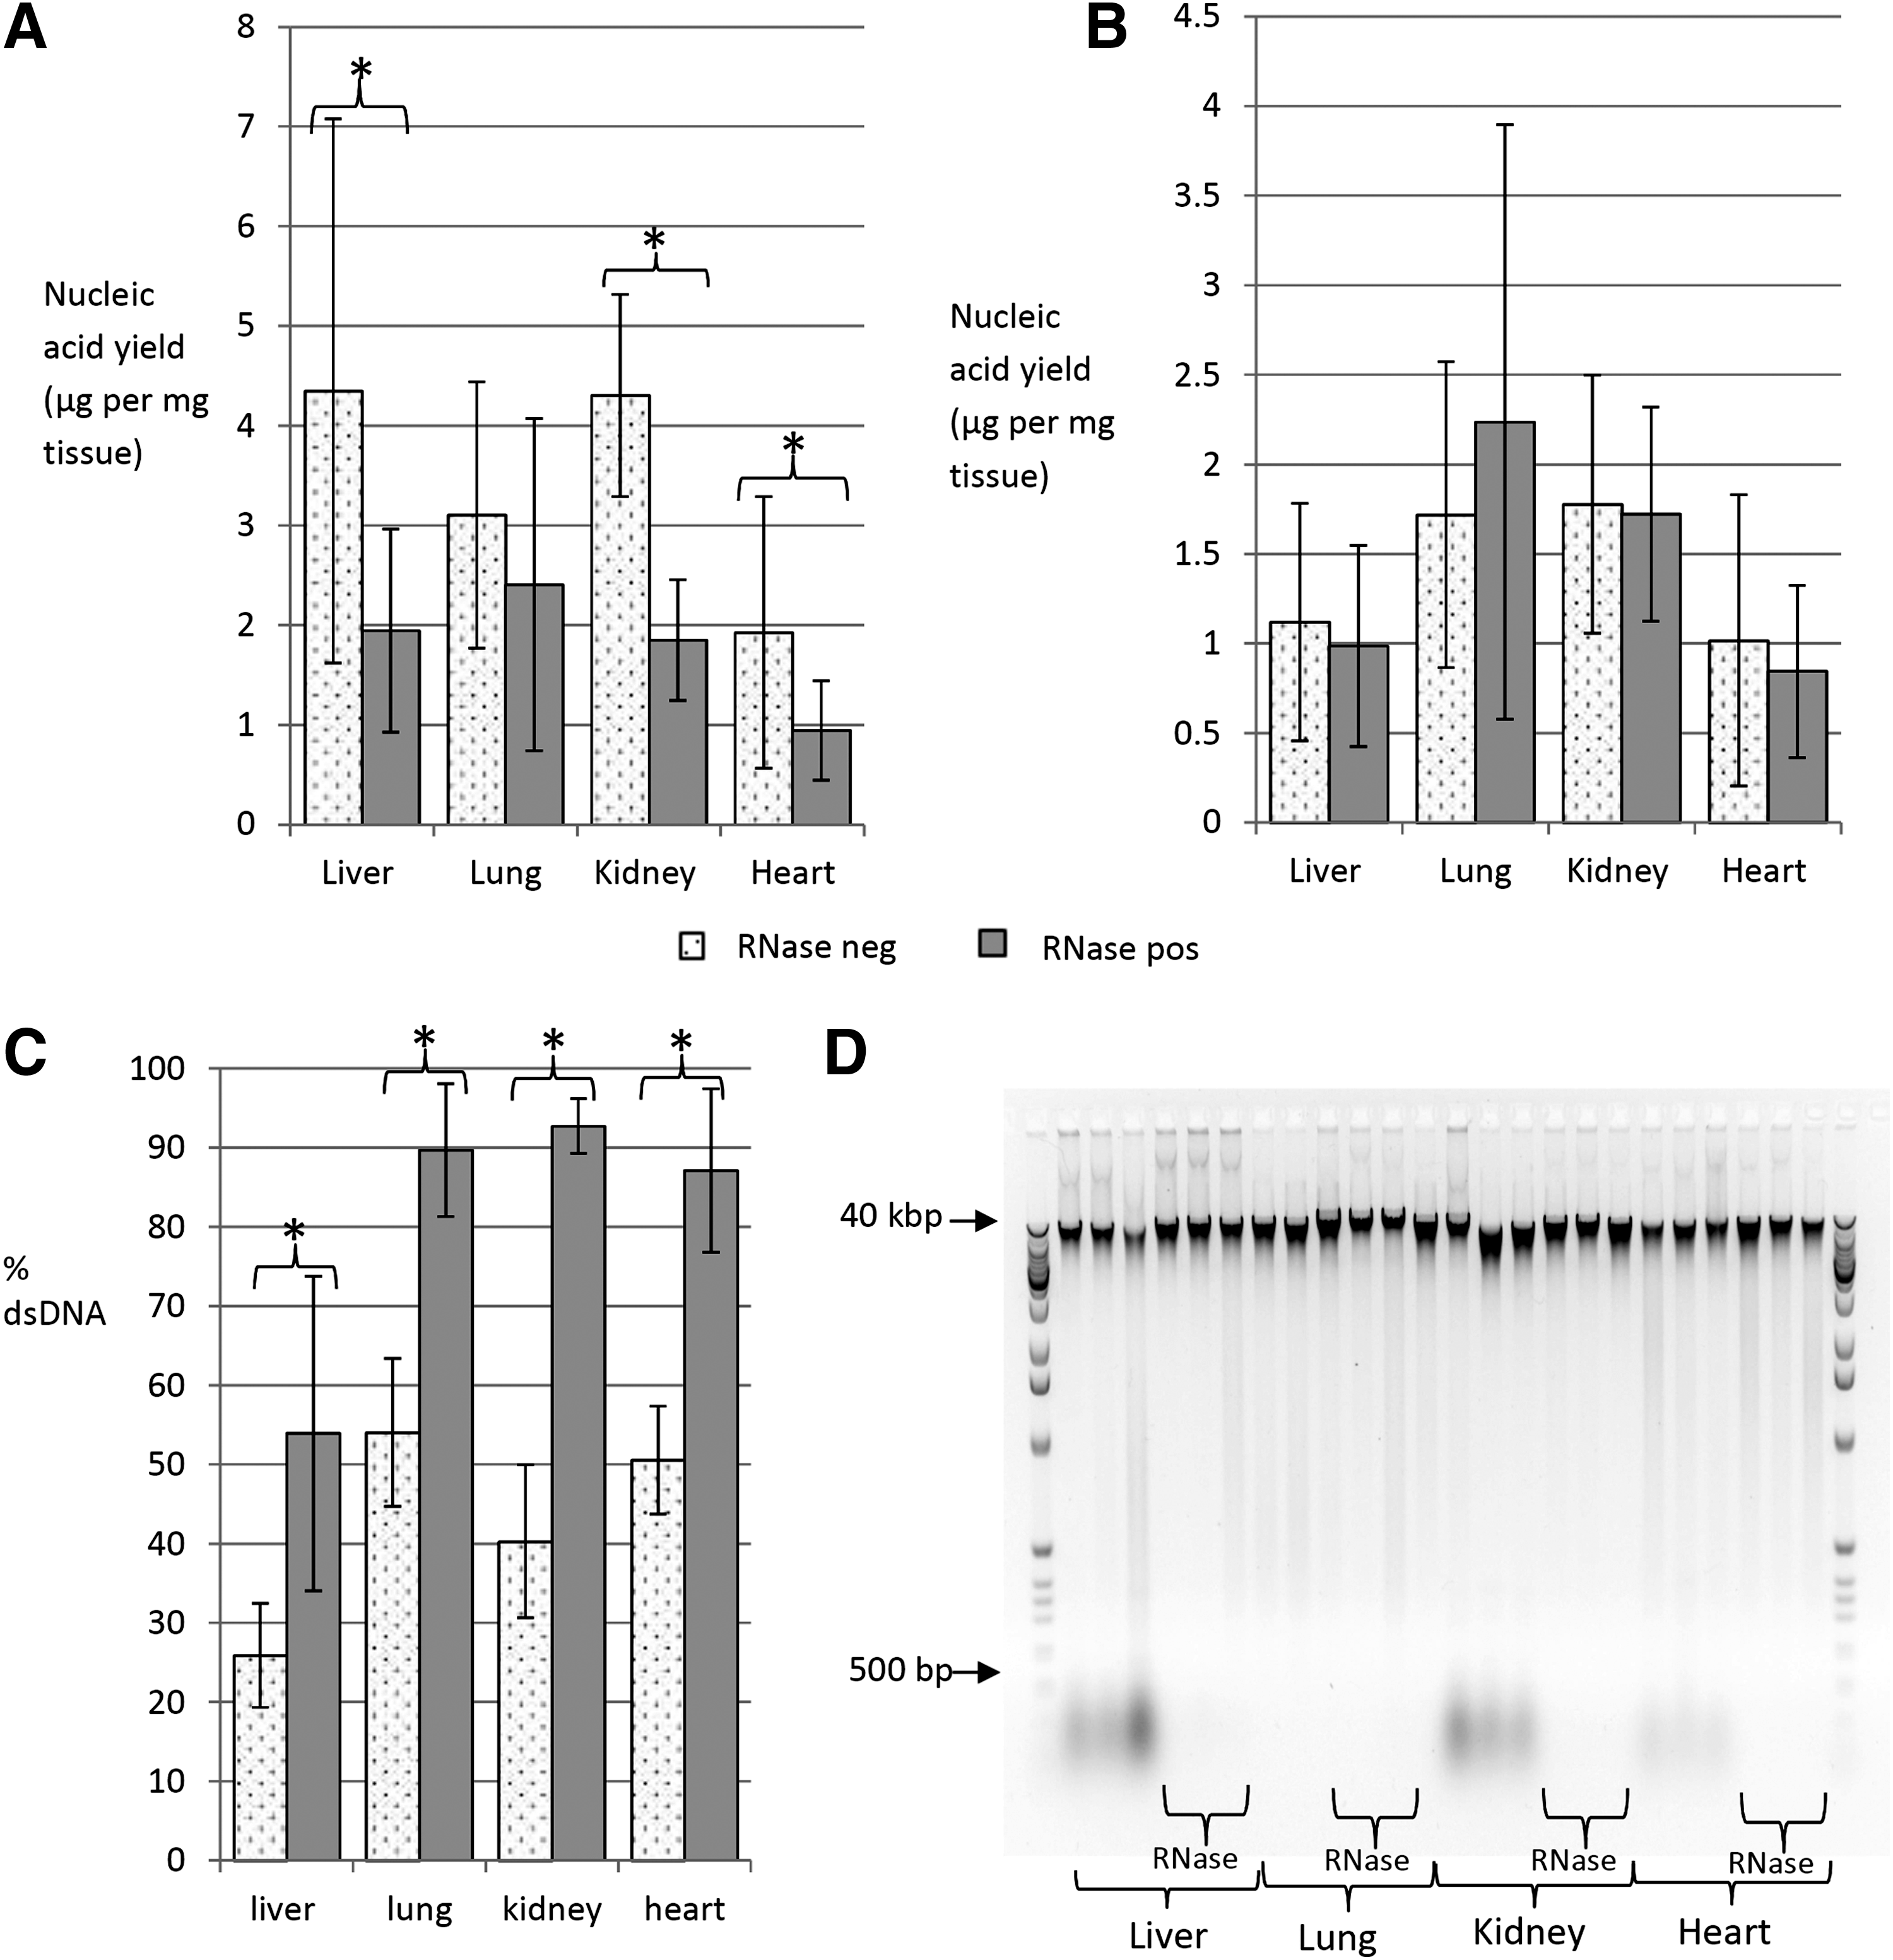
Mean total nucleic acid as assessed as “DNA” by OD 260 nm spectrophotometry was reduced by 22.5%–57.0% when an RNase step was incorporated into the extraction protocol
The data were also analyzed by calculating the percentage of total nucleic acid (OD 260 nm spectrophotometry) that was dsDNA (PicoGreen spectrofluorometry) for each sample and then averaging the difference in % dsDNA between the RNase-ve and RNase+ve extractions from each tissue-type (Fig. 1C). We found that adding RNase increased the % dsDNA in the extractions from 25.9% to 53.9% in liver (p=4.2×10⁻⁴), from 54.0% to 89.7% in lung (p=9.7×10⁻¹⁴), from 40.3% to 92.7% in kidney (p=7.3×10⁻¹¹), and from 50.5% to 87.1% in heart (p=3.4×10⁻⁹). Therefore, in the absence of an RNase digest, the inaccuracy in quantification was 28.0% in liver, 36.2% in lung, 51.6% in kidney, and 36.5% in heart biospecimens.
However, the actual percentage of RNA contaminating the DNA sample would be lower than this (22.4% in liver, 28.9% in lung, 41.3% in kidney, and 29.2% in heart) because the molar extinction coefficient of RNA is 125% that of dsDNA (0.025 μg/mL−1 cm−1 versus 0.02 μg/mL−1 cm−1). The dsDNA concentrations were accurate when spectrofluorometry had been used for quantification, but when the RNase digest had not been included in the extraction, the quantity of contaminating RNA was unquantified and therefore unknown. By comparing the RNase+ve and RNase-ve cohorts, we could establish that the percentage of co-eluted RNA in the RNase-ve extractions was variable (coefficient of variation was 0.63 (liver), 0.26 (lung), 0.17 (kidney), and 0.27 (heart)). So, it was not possible to predict the amount of inaccuracy that would occur for any individual biospecimen in the absence of RNase, regardless of whether the quantification was carried out using spectrophotometry or spectrofluorometry.
RNA that had co-eluted with DNA was visualized on a gel (Fig. 1D). In the presence of Gel Red (which stains both DNA and RNA), a band of nucleic acid at 30 kbp (the appropriate size for genomic DNA) was present in every extract. In addition, a low molecular weight smear <500 bp was present in the RNase-ve extractions in liver, kidney, and heart. This smear was not present in the RNase+ve extractions, so it must be the RNA. It is noteworthy that this smear was less intense in the RNase-ve heart extractions and was not present in any of the lung extractions. However, we think this is logical because the heart had slightly lower and the lung had significantly lower quantities of co-eluted RNA compared to the liver and kidney samples.
The inclusion of the RNase digest had no effect on the 260:230 ratios, but it did influence 260:280 ratios (Fig. 2), reducing them in liver from 1.76 to 1.47 (p=1.5×10⁻⁶), from 2.02 to 1.85 in kidney (p=1.5×10⁻¹¹), from 1.95 to 1.83 in lung (p=1.9×10⁻⁷), and from 1.94 to 1.81 in heart (p=0.01). There was no relationship between 260:280 and sample weight (R 2 =0.008–0.47 in all instances).
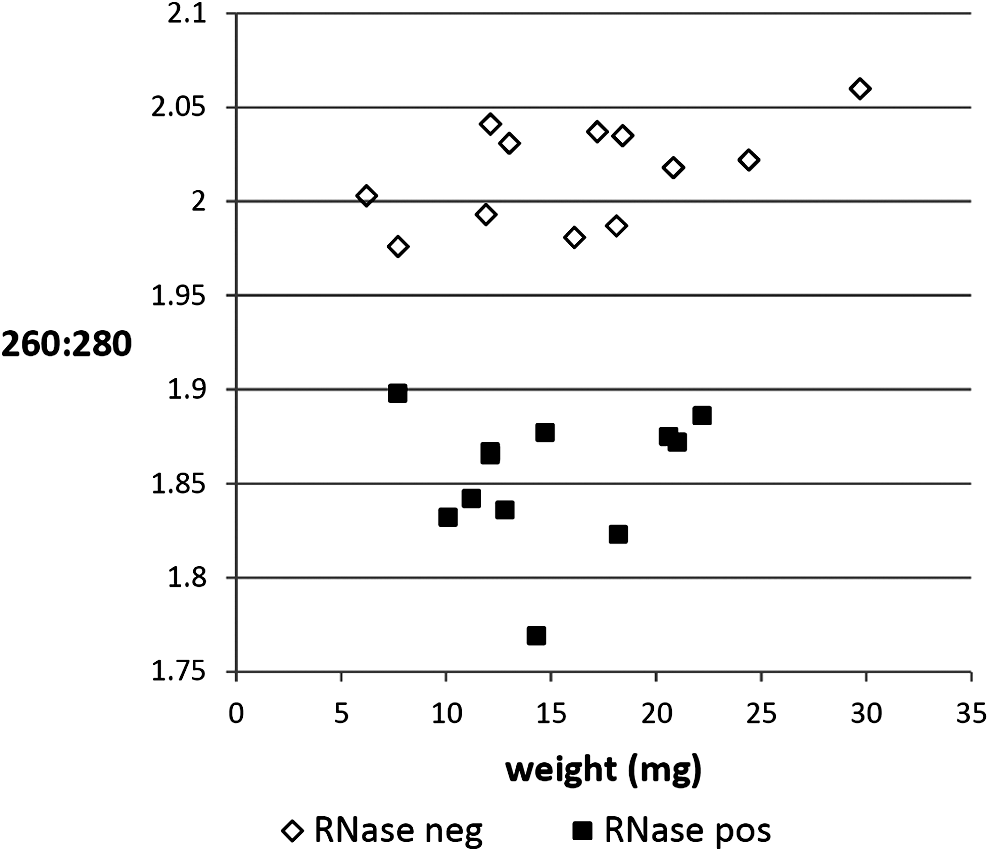
260:280 purity ratios were significantly lower in all tissue types when RNase was incorporated into the DNA extraction protocol. The data shown here apply to kidney.
Discussion
Our data demonstrate that RNA readily co-elutes with DNA if RNase is not included in the DNA extraction protocol. Consequently, 28%–52% of the spectrophotometry-assessed “DNA” was actually RNA. Unquantified RNA was a hidden contaminant in spectrofluorometry-assessed dsDNA, with the quantity of RNA varying from biospecimen to biospecimen and with tissue-type. Including the RNase step in the protocol lowered the 260:280 ratios, which means that an overestimation of the amount of protein contamination in the sample might occur.
Our study specifically used Qiagen's QIAamp column, and we see no reason to believe that these phenomena are restricted to this extraction kit. Indeed, co-elution of RNA is to be expected in any silica-based extraction method (such as the QIAamp) because silica binds all nucleic acids. The same would apply for salting-out or alcohol precipitation-based methods, but the phenomenon would be expected to be less pronounced in magnetic bead-based methods where the beads can bind single-stranded DNA (ssDNA) or dsDNA with considerably higher specificity, depending on their buffer pH and composition.
It is possible that the lower 260:280 in the RNase+ve extractions occurred because the RNase enzyme had not been effectively removed in the wash steps, resulting in an increase in protein contamination. Alternatively, RNA could have driven up the 260:280 in the RNase-ve extractions because pure uracil has a higher 260:280 than pure thymidine (4.0 as opposed to 1.47). 7
We found large between-sample variations in DNA yield, driving a lack of statistical power when presenting results as μg nucleic acid per mg tissue. We think this is partly a consequence of each sample cohort originating from 12 different rats, but mostly because smaller cores tended to yield more nucleic acid per mg tissue than larger cores. Yields per mg tissue would be expected to be higher in smaller biospecimens because the homogenization and proteinase K digestion steps were identical for all the biospecimens, so larger biospecimens would have been less effectively homogenized than smaller biospecimens, and then digested with fewer proteinase K molecules per mg tissue. Therefore, the most accurate way to analyze the data was to calculate the percentage of nucleic acid that was dsDNA, because this parameter normalized for core size. When analyzed in this way, the RNase digest increased the percentage of dsDNA in the extraction from the 50%–60% range to the 80%–90% range.
Although the % dsDNA value is more informative than the concentration values obtained using spectrophotometry or spectrofluorometry alone, an RNase digest is still required if accurate quantification is to be achieved. Although the % dsDNA will show the quantity of single-stranded nucleic acid in the sample, the relative proportions of RNA and ssDNA will remain unknown. A DNA extraction with a low % dsDNA composition could be degraded, predominantly containing ssDNA; or equally consist of high quality dsDNA that is contaminated with a significant amount of RNA. In our biospecimens, approximately half of the single-stranded nucleic acid was RNA (assessed by comparing RNase+ve and RNase-ve yields). However, this calculation is based on the assumptions that the RNase was both 100% effective (and all the RNA was degraded) and 100% specific (so no DNA was digested).
The commercially-available RNase solutions for use in DNA extractions consist of RNase A (such as the solution provided by Qiagen that we used), although sometimes a second RNase such as RNase T1 is added. RNase A is an extensively-studied, highly efficient enzyme that is stable over a wide pH range, is resistant to heat and has extremely high specificity for RNA.6–8 So, although it is unlikely that the RNase digest will be completely effective and trace amounts of RNA will therefore remain in DNA extracts, the published data indicate that any inaccuracy will be inconsequential.
It should also be noted that both spectrophotometry and spectrofluorometry quantification methods have inherent analytical uncertainties. Nucleic acid concentrations in dilute samples can be overestimated by spectrophotometry when the extraction has been carried out using Trizol because residual phenol absorbs light at 260 nm.9,10 Also, the hyperchromic effect can cause the concentration of degraded DNA to be overestimated by spectrophotometry because ssDNA absorbs more light at 260 nm than dsDNA.11,12 The hyperchromic effect is routinely seen in PCR when melting curves are used and it has also been shown experimentally in a study where artificially-fragmented DNA was quantified. 13
However, the hyperchromic effect is not a phenomenon that is inevitably pertinent to DNA quantification because a second study assaying increasingly fragmented DNA failed to see any change in OD 260 nm absorbance as DNA fragmentation increased. 14 In spectrofluorometry, an increase in DNA fragmentation will cause a decrease in the measured concentration because the quantity of dsDNA becomes lower, and, as in spectrophotometry, inaccuracies can be caused by buffer contaminants such as salts and organic solvents. 15 In addition, spectrophotometry is also influenced by the % adenine and thymine content of the DNA and the pH of the buffer, 15 so unless these parameters are the same in both the standard curve (often made using lambda bacteriophage DNA) and in the samples, a small degree of inaccuracy is inevitable.
Clearly, RNA co-elution in a DNA extraction is a problem of significance unless an RNase step has been included in the DNA extraction protocol. In the absence of an RNase step, OD 260 nm spectrophotometry-based quantification of DNA returns overestimated DNA concentrations. If this problem is addressed by using a quantification method that is specific for dsDNA assay (such as PicoGreen), an unknown proportion of RNA will be present in the (now) quantified dsDNA sample. In either scenario, the “test item” (the DNA) will be of unspecified purity and consequently, such measurements would not satisfy the requirements of accreditation standards.
Biobank accreditation standards (e.g., ISO 17025:2005 or the College of American Pathologists` program 16 ) or certification to national ISO9001-based biobank standards require method validation. Biospecimen processing methods (such as DNA extraction) can be either experimentally validated on-site, by each biobank, and/or be justified by published evidence, and/or be continually validated through participation in External Quality Assessment programs.
Our work presents evidence for the following recommendations: (1) DNA extractions should include an RNase digest step; (2) If RNase treatment has been applied, accurate total and dsDNA quantification can be achieved by either spectrophotometric or spectrofluorometric methods, respectively; (3) If RNase treatment has not been applied, or if it is unknown whether it has been carried out (e.g., for historical collections), accurate dsDNA quantification can be achieved by spectrofluorometric methods. In this case, a photometric method is also necessary in order to be able to state the purity of the dsDNA in the context of the total nucleic acid contents of the sample; (4) Photometric measurement of total DNA is not robust in the presence of contaminating RNA; (5) Spectrofluorometric measurement of dsDNA is not influenced by the presence of contaminating RNA, but if no RNase step has been carried out, the quantity of this contaminating RNA and therefore the purity of the sample will remain unknown; (6) The accuracy of any DNA quantification method can be assessed through participation in a Proficiency Testing program.
Footnotes
Author Disclosure Statement
No competing financial interests exist.