
Abstract
In cryopreservation, the two-parameter (2P) model and the nondilute solution model have been developed to study the membrane transport properties of cells. However, to our knowledge, comparison of the fitting validity has never been made between the two models. In this study, to make this comparison, the permeability parameters of porcine adipose-derived stem cells (pADSCs) were first determined with the two models, and then the errors between the predictions and the experimental data were tested using the Lilliefors test. The results indicate that the 2P model is slightly better than the nondilute solution model in predicting the mass transport across cell membrane. The causes for this phenomenon are discussed and suggestions on using these two models are given.
Introduction
C
CPAs have been proven to dramatically suppress the freezing injuries suffered by the cells. On one hand, they slow down the water molecule diffusion by increasing the viscosity of the solution, and thus greatly reduce the ice nucleation and growth.1,5 On the other hand, CPAs are potentially useful in stabilizing the plasma membrane through electrostatic interactions 6 or reducing the harmful concentrated electrolytes by permeating into the cells. 1
However, CPAs themselves are harmful to cells. As chemical components, most CPAs are toxic to cells, while high concentration of CPAs are necessary to guarantee the survival rates. 4 In addition, cells would suffer excessive osmotic damage through adding or removing the CPAs during cryopreservation. 1 In order to optimize the cryopreservation procedure for cells, it is of great importance to understand mass transport across the cell membrane completely.
For this purpose, a plethora of mathematical models have been developed.7–11 The two-parameter (2P) model, which was proposed by Jacobs and Stewart,8,9 is very popular and is also simple. However, the dilute solution assumption used in this model may not be suitable for CPAs solutions. 7 In 2009, Elmoazzen et al. 7 presented a new nondilute solution model, which is comparatively more complex than the 2P model.
To make a precise prediction of the mass transport across the cell membrane, it is necessary to choose a better model that has high fitting validity. However, to our knowledge, comparison of the fitting validity has never been made between the 2P model and the nondilute solution model. To make such a comparison, in this study, the membrane transport properties of porcine adipose-derived stem cells (pADSCs) were determined first with the two models. The errors between the experimental data and the fitted data were then analyzed with statistical methods. The fitting validity of the two models was evaluated and compared.
Theories and Models
Two-parameter model
The 2P formalisms, which were developed by Jacobs and Stewart,8,9 provide a description of the osmotic responses of cells in solutions with both permeating and nonpermeating solutes. The volumetric responses of the cells in the 2P model are expressed as:
7
where Vw is intracellular water volume, Lp is the membrane hydraulic conductivity, A is the cell surface area, R is the universal gas constant, T is absolute temperature, π is the solution osmolarity, the superscripts 'e' and 'i' represent the extracellular and intracellular condition, respectively. The solute flux across the cell membrane in the 2P model is given by:
7
where Ns is the intracellular mole number of permeable solute, Ps represents the solute permeability, Cse is the extracellular solute molarity while Csi is the intracellular solute molarity.
Nondilute solution model
The nondilute solution model
7
was developed on the assumption that the intracellular solution contains water, a permeating solute (CPA) and a nonpermeating solute (NS1), while the extracellular environment contains water, permeating CPA, and another nonpermeating solute (NS2). In this study, NS1 and NS2 were regarded as NaCl. The changes in the number of water molecules and in the number of solute molecules as a function of time are described as:
7
where L and P refer to the water and CPAs permeability coefficients of the cell membrane; χ is the mole fraction. Subscripts 1, 2, and 3 represent water, CPAs, and NaCl, respectively; B+ is the second osmotic virial coefficient, which were regarded as constants in this study.7,12 This model describes cellular osmotic behavior in terms of intracellular molecules of water and permeating cryoprotectant without any dilute solution or equilibrium assumptions.
Data fitting
In order to acquire parameters of the two models, the Levenberg-Marquardt algorithm was used to calculate the curves that best fit the experimental data.13,14 The Levenberg-Marquardt algorithm is an iterative technique designed to find a local minimum of a function that is expressed as the sum of squares of nonlinear functions. It has become a standard technique for solving the nonlinear least-squares problems.
In this study, the extracellular osmolarity was assumed to have a step transformation at time t0,
15
when CPA is added into extracellular solution:
Statistical analysis
For further comparison of the two models, it is necessary to find an inner connection between the experimental volumetric data and the fitted data of the cells. It is proposed that the errors between experimental data and the fitted data follow a normal distribution when the theoretical model can be used to describe a certain phenomenon.16,17
The Lilliefors test is commonly used to determine whether the null hypothesis that a dataset is normally distributed around should be rejected.
18
Assuming that the x dataset consists of n data (xi, i = 1,2,…,n), the test initially transforms each data point into the following form:
where Mx and Sx are the mean and the standard deviation of the dataset, respectively. The criterion value of the Lilliefors test (L) is then calculated and compared with the critical value, which can be found by table lookup, to decide whether to accept the null hypothesis:
where Φ(zi) is the proportion of data that are smaller than or equal to zi in the z dataset, P(zi) is the probability of zi, which is from a standard normal distribution:
In this study, the Lilliefors test was performed by GNU Octave (Ver 4.0.0). Parameter H was returned by this test. The hypothesis that the given datasets come from a normal distribution will be rejected if H = 1. On the contrary, this hypothesis will be accepted if H = 0. The significance level is 0.05.
In order to determine graphically how the data obey a normal distribution, a normal probability plot (normplot) was utilized in this study. The more the data follow a normal distribution, the more linear the normplot of data will be.
Results
Data fitting
Original cell volume data was obtained from our previous study, in which we adopted a microperfusion system 19 to measure cell osmotic responses. The cells were first equilibrated in an isotonic solution (NaCl-H2O binary system) for 4 min before being exposed to a hypertonic solution (CPA-NaCl-H2O ternary system) for 10 min. Cell volume was calculated using the projected area in digital images. The volumetric changes of pADSCs being transferred into 1.5 M dimethyl sulfoxide (Me2SO) or ethylene glycol (EG) solutions were measured at −2°C, 8°C, 18°C, and 28°C, respectively. The number of cells in Me2SO solution at −2°C, 8°C, 18°C, and 28°C was 11, 16, 12, and 9, while in EG solution the numbers were 17, 18, 19, and 14, respectively.
The Levenberg-Marquardt method was applied to fit the experimental data with the 2P model and the nondilute solution model separately. The constant parameters used in these models are listed in Table 1. The fitted parameters are listed in Table 2.
2P, two-parameter; EG, ethylene glycol.
CPAs, cryoprotective agents.
Lilliefors test results
For each cell, the errors between the volumetric data and the fitted data were calculated and verified using the Lilliefors test to determine whether the errors obeyed the normal distribution. If so, the returned value H was 0. It can be deduced from Figure 1 that the total number of H = 0 of 2P model at each temperature is more than that of the nondilute solution model except for those at −2°C, indicating 2P model is slightly better than the nondilute solution model when describing the mass transport phenomenon across the cell membrane.
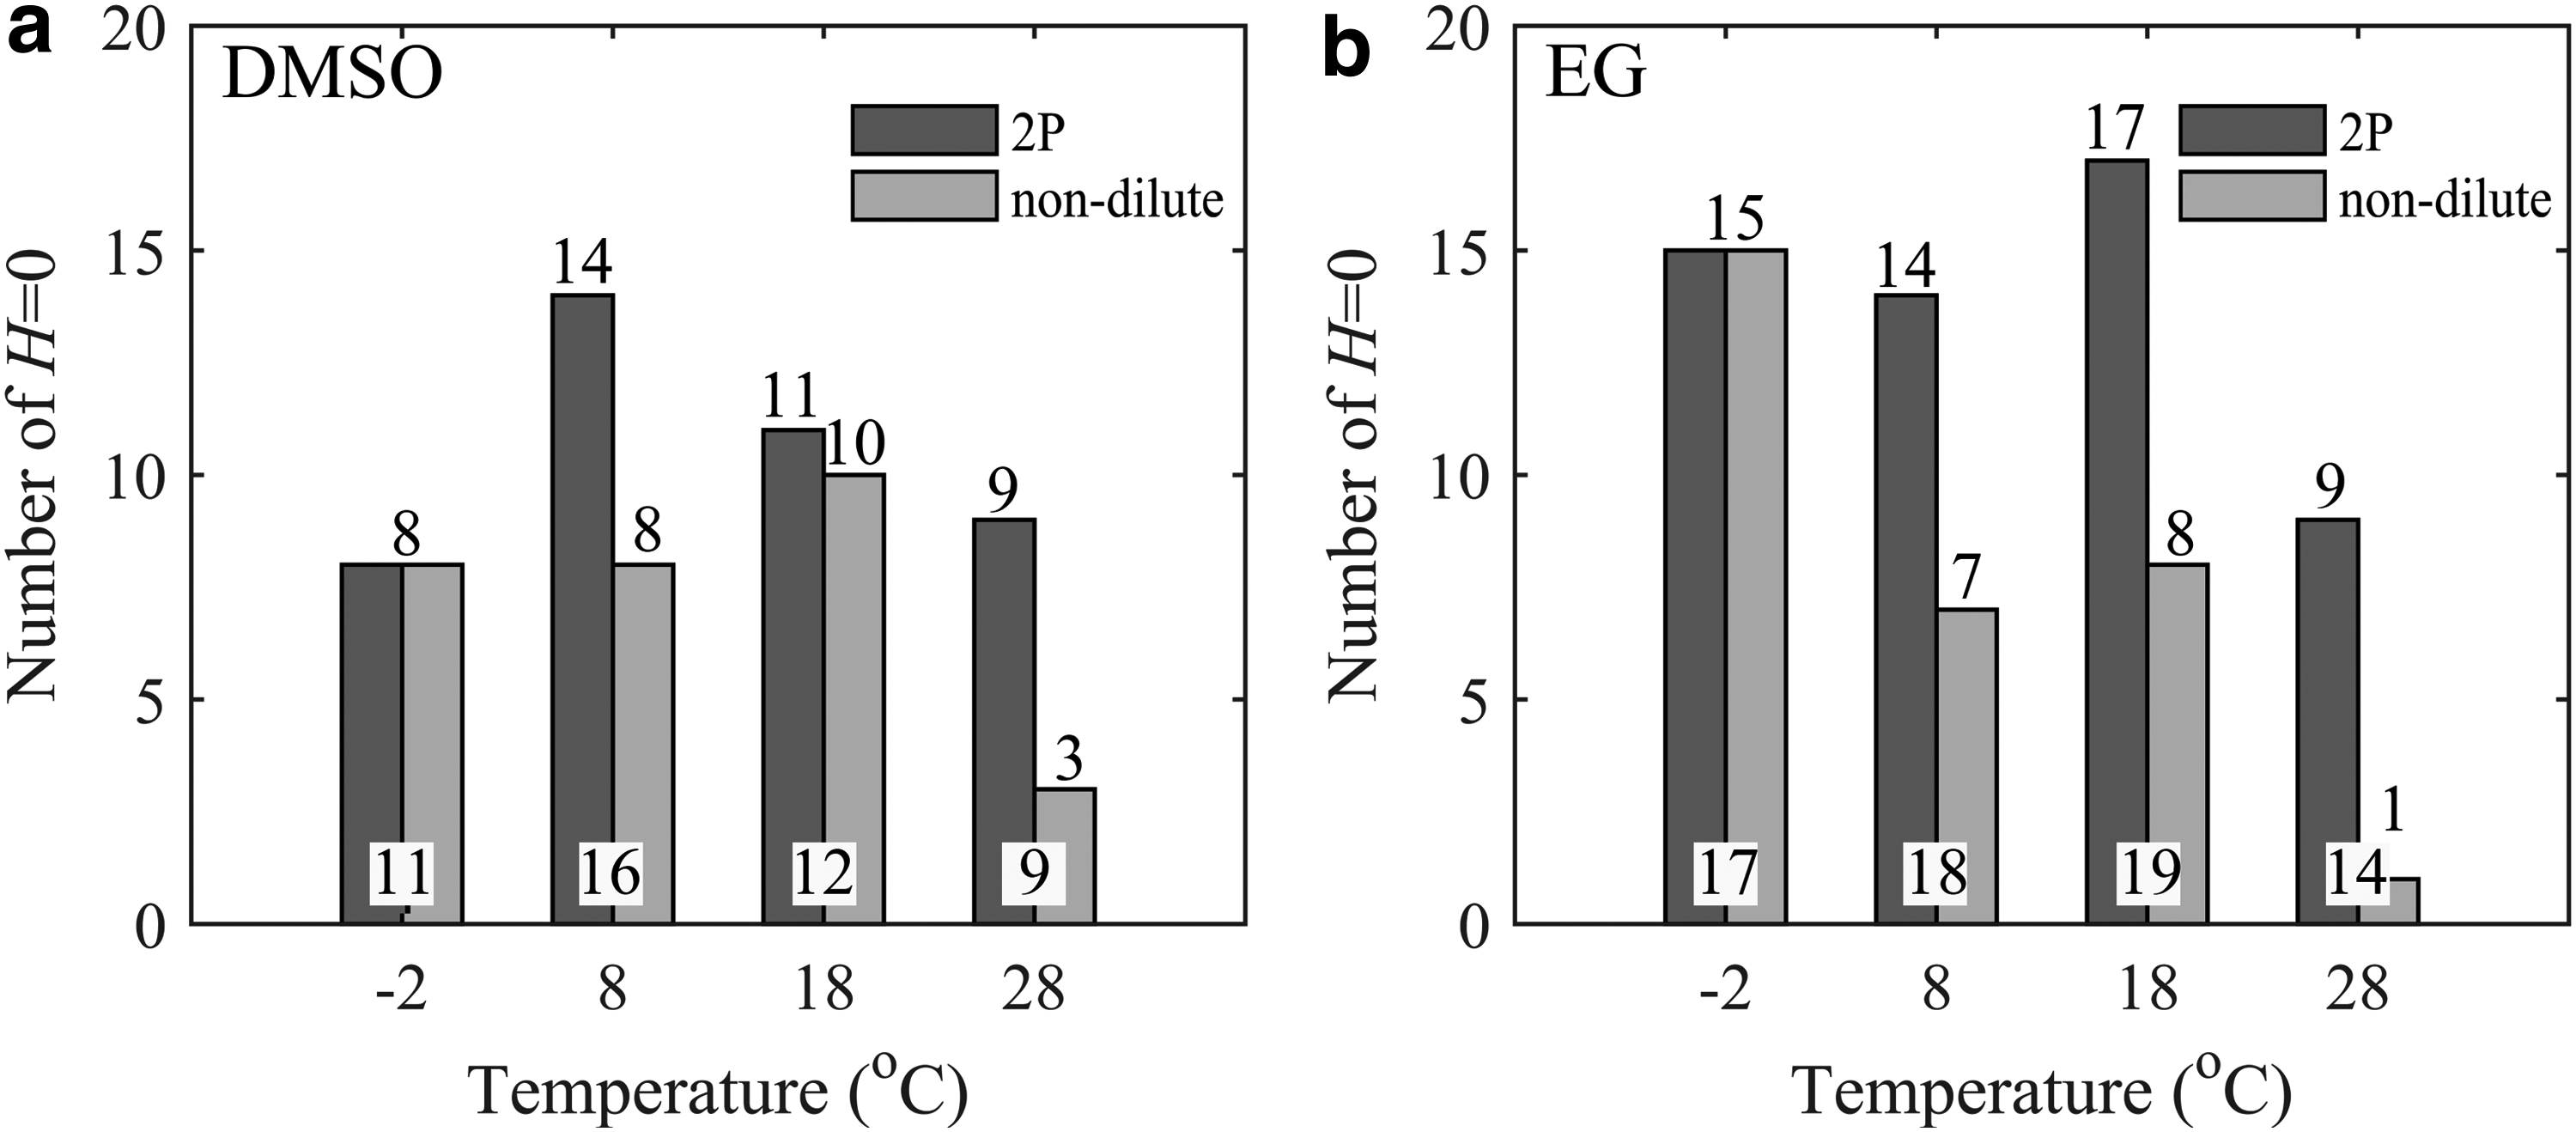
Lilliefors test results for 2P and nondilute solution models.
The failure of the Lilliefors test for both the 2P model and the nondilute solution model may be related to the image processing error when acquiring the projected cell volume of the cells. It could be seen from Figure 2a that the fitting curve matches the experimental data well for most part, except for the abnormal data in the red box. The histogram of these abnormal data would be the reason why the errors do not follow the normal distribution (Fig. 2b).
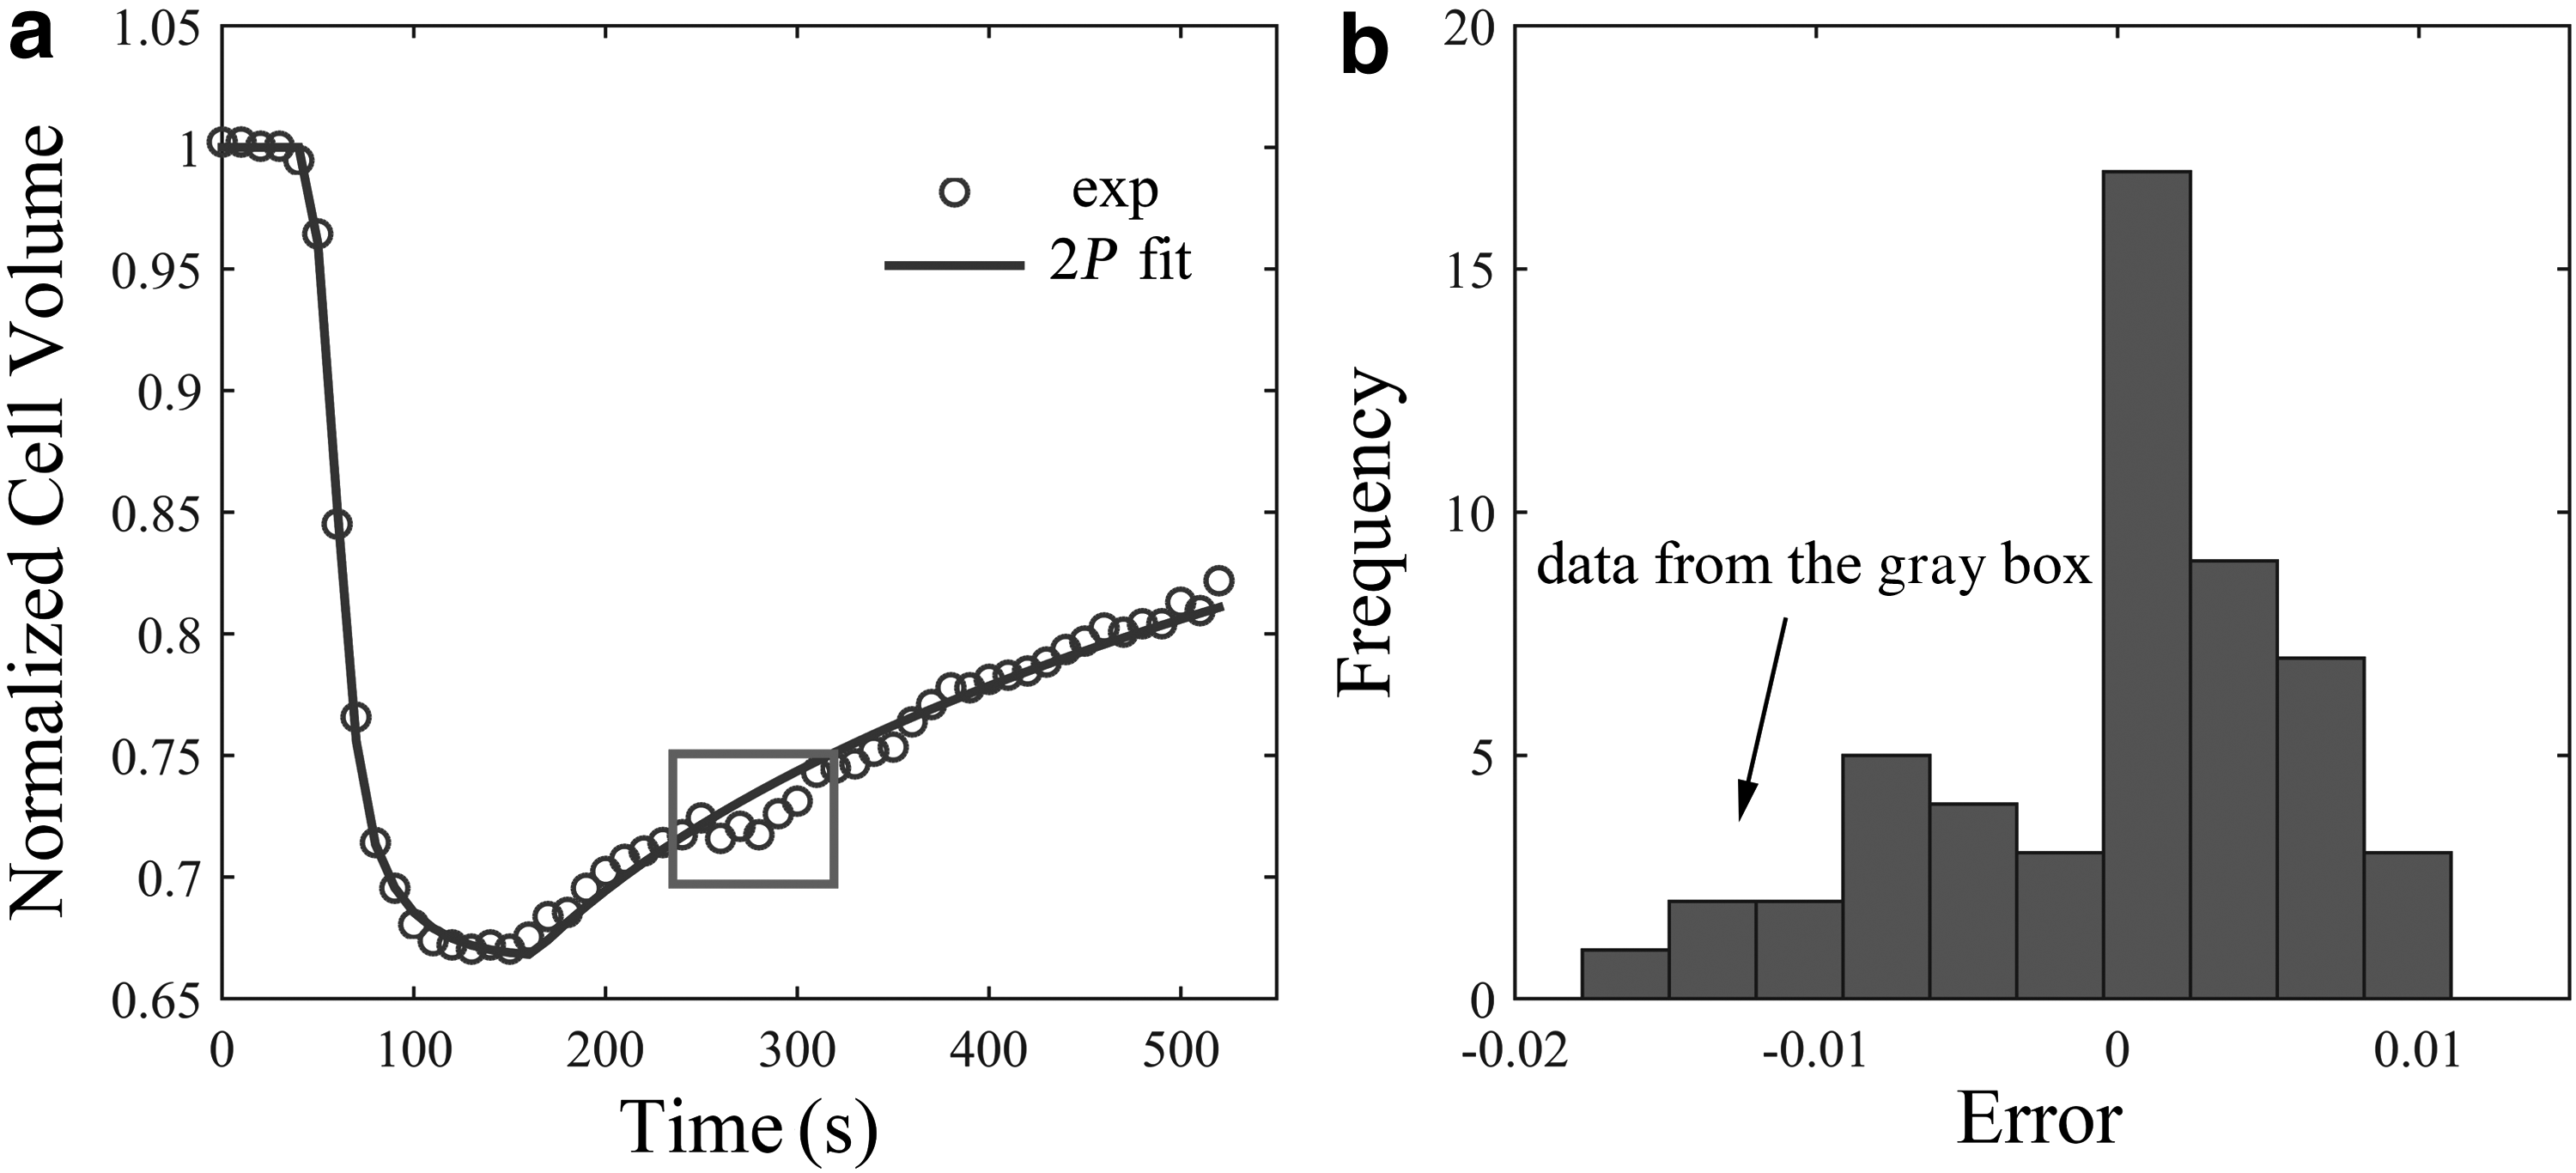
The failure of the Lilliefors test for both the 2P and the nondilute solution model.
The typical case where H = 0 for the 2P model while H = 1 for the nondilute solution model is shown in Figure 3. Note that most of the normplot data for the nondilute solution model displayed linearly except for those data near the time t0 (data in the red box), indicating these data could be the reason the error for the nondilute solution model fails the Lilliefors test.
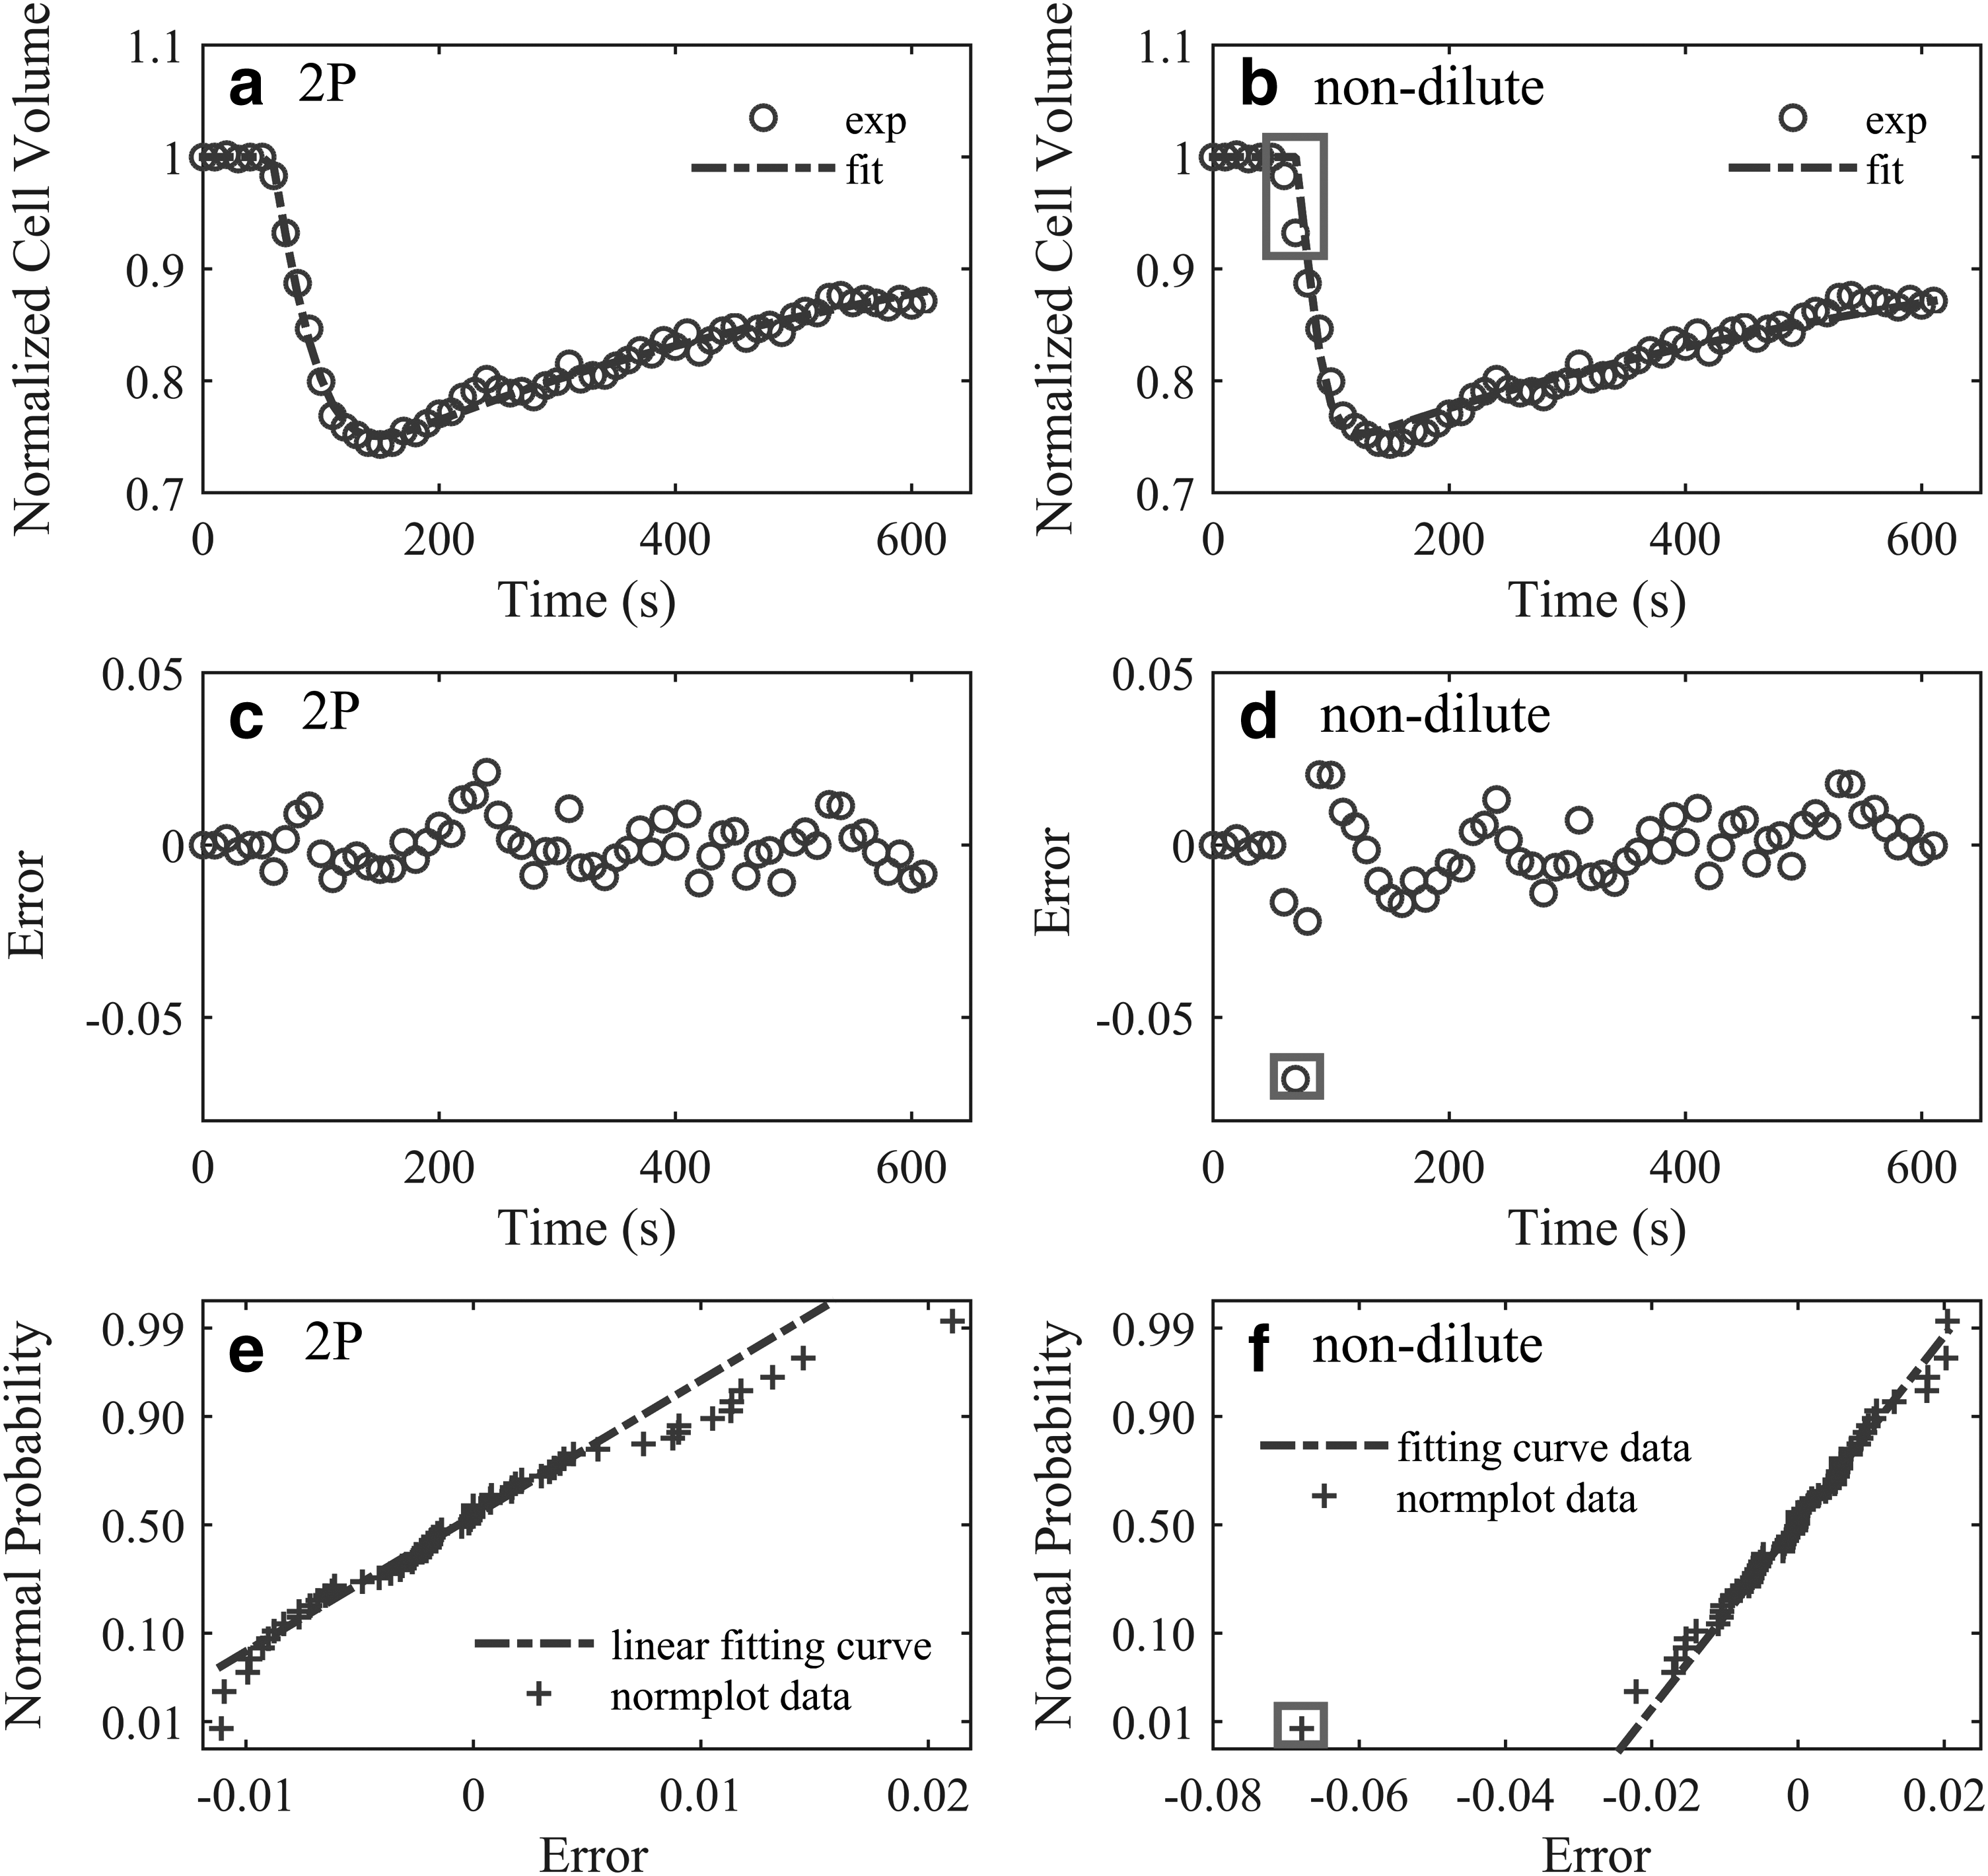
The typical case where H = 0 for the 2P model while H = 1 for the nondilute solution model.
To verify our hypothesis, we re-calculated and tested the error between the experimental and the fitted volumetric data after the volumetric data around t0 was removed (Fig. 4). Note that the fitting validity for both models is improved, especially for the nondilute solution model (Figs. 4c-d). The fitting performance of the nondilute solution model may be better than that of the 2P model in the EG solution at −2°C and 28°C.
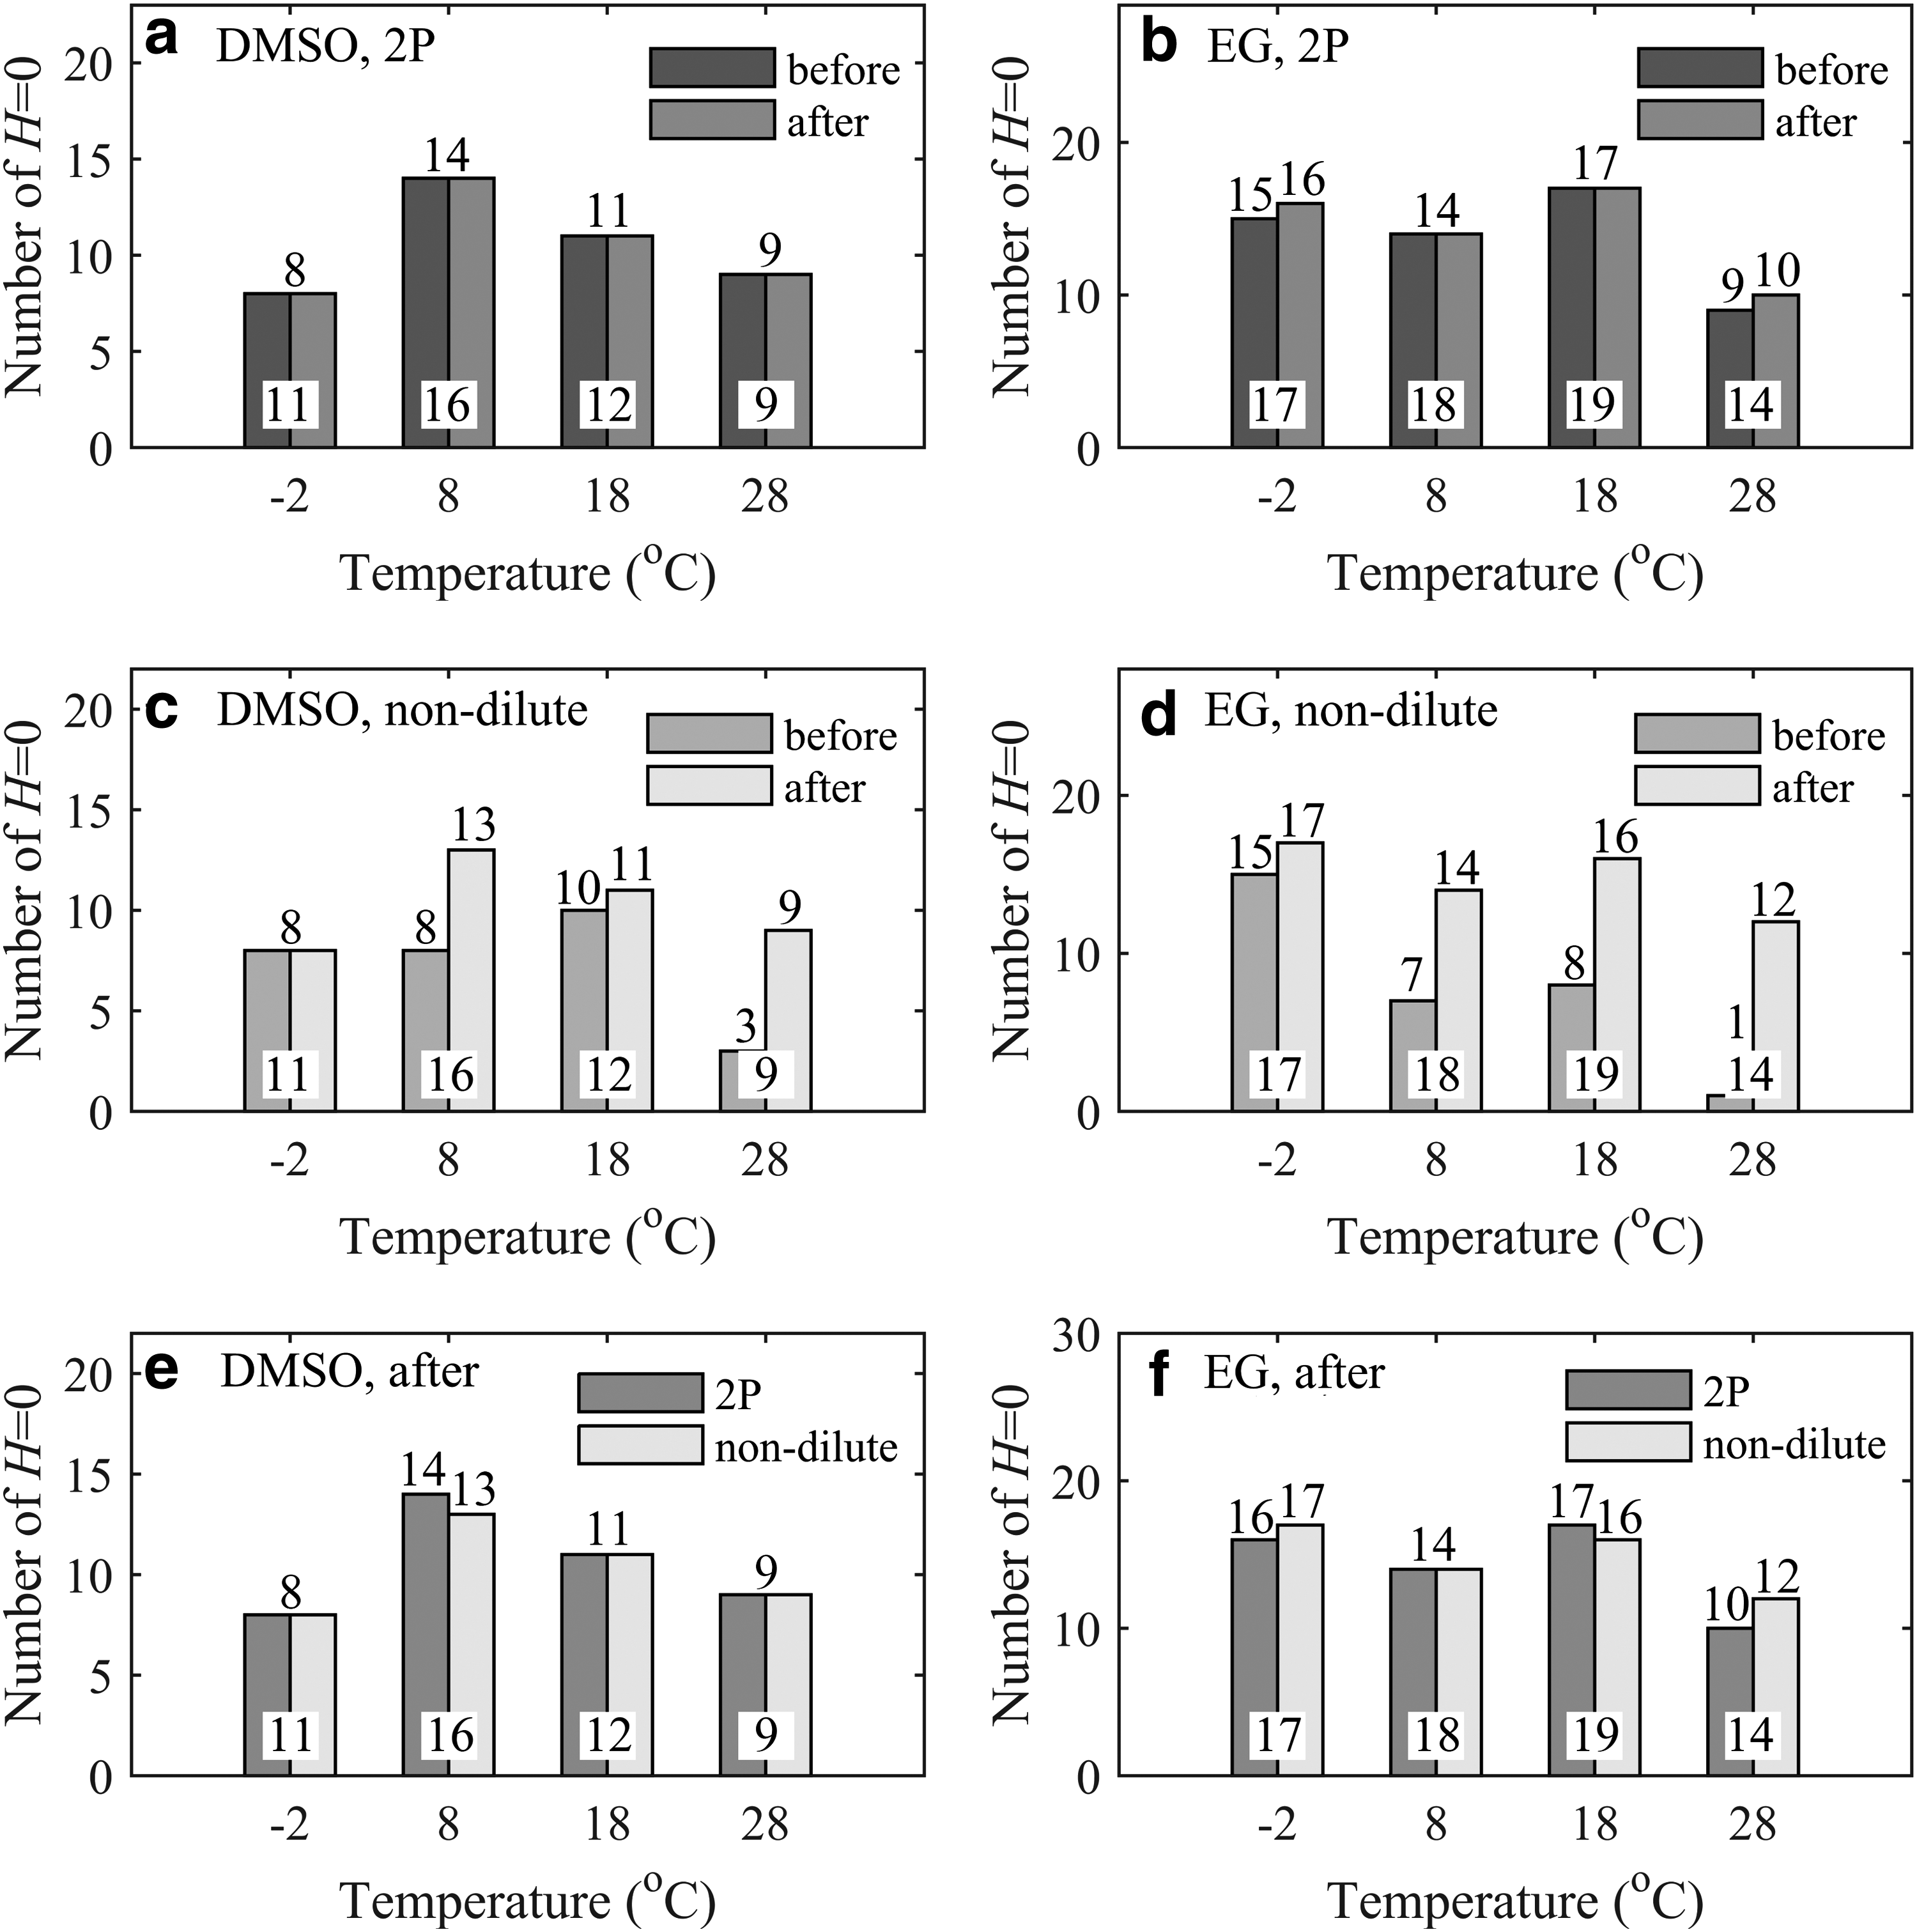
The comparison of the number of H = 0 before and after removing the volumetric data around t0 for the 2P model
Discussion and Conclusions
In this study, the fitting validity of both the 2P and the nondilute solution model were compared using the statistical methods. The Lilliefors test suggested that the 2P model was better than the nondilute solution model, as most of the errors between the experimental and the fitted volumetric data followed the normal distribution.
The reason most of the errors for the nondilute solution model fail the Lilliefors test could be attributed to the poor fitting performance around t0, indicating the nondilute solution model may not be suitable in predicting the severe osmosis change of the cells when CPAs were added. After removing the inappropriate volumetric data around t0, the fitting performance of the nondilute solution model was greatly improved, especially at higher temperatures.
The cause of this phenomenon may be due to the virial coefficients used in the nondilute solution model, which are supposed to be temperature dependent, 20 but are instead regarded as constants in this study. However, specific virial coefficients' variation with temperature has rarely been demonstrated in prior studies. 12 Therefore, the nondilute solution model would be difficult to put into practice if the virial coefficients are essential in predicting the mass transport across cell membrane. However, along with the enrichment of the temperature dependent virial coefficients, the prediction accuracy may be greatly improved.
A second possibility is that the osmotic shift was not instantaneous when cells were exposed to hypertonic solutions. This phenomenon could cause an inaccurate result under our assumption, especially at high temperatures where cell volume changes faster. Thus it is helpful to measure the extracellular osmotic changes instantaneously as a function for fitting. Lastly, the nondilute solution model assumes the rate of water transport to be proportional to the difference of chemical potential between extracellular and intracellular solutions, while the 2P model assumes the rate of transport to be proportional to the concentration difference between extracellular and intracellular solutions. Thus it is possible that the use of a concentration difference as driving force better describes the mechanisms of membrane transport.
Footnotes
Acknowledgment
This study was supported by the National Natural Science Foundation of China (Nos. 51276179, 51476160, and 51528601).
Author Disclosure Statement
No conflicting financial interests exist.