
Abstract
Biobank saliva sample quality depends on specific criteria applied to collection, processing, and storage. In spite of the growing interest in saliva as a diagnostic fluid, few biobanks currently store large collections of such samples. The development of a standard operating procedure (SOP) for saliva collection and quality control is fundamental for the establishment of a new saliva biobank, which stores samples to be made available to the saliva research community. Different collection methods were tested regarding total volume of protein obtained, protein content, and protein profiles, and the results were used to choose the best method for protein studies. Furthermore, the impact of the circadian variability and inter- and intraindividual differences, as well as the saliva sample stability at room temperature, were also evaluated. Considering our results, a sublingual cotton roll method for saliva collection proved to produce saliva with the best characteristics and should be applied in the morning, whenever possible. In addition, there is more variability in salivary proteins between individuals than in the same individual for a 5-month period. According to the electrophoretic protein profile, protein stability is guaranteed for 24 hours at room temperature and the protein degradation profile and protein identification were characterized. All this information was used to establish an SOP for saliva collection, processing, and storage in a biobank. We conclude that it is possible to collect saliva using an easy and inexpensive protocol, resulting in saliva samples for protein analysis with sufficient quality for biobanking purposes.
Introduction
B
In the 2000s, about 43 biobanks were created around the world. 4 In Portugal, the major biobank has been established in the Lisbon Academic Medical Centre (IMM) 5 and has recently started to store saliva samples.
Several–omics studies using saliva samples have led to the production of massive amounts of data collected and annotated in databases identifying and characterizing different salivary components (DNA, RNA, proteins, metabolites, and microorganisms). 6 Saliva's characteristics reflect the health or disease state7–18 of an individual and present many advantages relative to other fluids such as blood, serum, or plasma. The collection of saliva is simple and noninvasive and is a safe sampling method, requiring minimal equipment and inexpensive storage possibilities. Contrary to other sterile fluids, such as cerebrospinal fluid, 4 blood, amniotic, and pleural fluid, saliva is not sterile 19 and therefore subject to microbial contamination, which influences sample quality. 8 Furthermore, effects of some parameters such as circadian cycle and inter- and intraindividual variations on the different components have not been definitely established. For some proteins and steroid hormones,9–11 the total volume9,12 and total protein 18 seem to have diurnal variations, but for other proteins, quantification seems to be independent of the circadian cycle.10,18
The effect of the collection method and site, as well as the time of collection based on the impact of the circadian variability on the volume, protein concentration, and protein profile of the collected saliva, is evaluated in the present study. The evaluation of the inter- and intraindividual variability and the sample stability, at room temperature, complements the evidence necessary to establish a standard operating procedure (SOP) guaranteeing the preliminary characterization of the saliva to be stored.
Materials and Methods
Participants and ethics statements
Saliva samples were collected at Universidade Católica Portuguesa from 22 healthy volunteers (9 males and 13 females) aged 19–27 years (mean=21 years; SD=2.34). This is a convenience sample representative of the university student population. Donors consented to the collection and storage of the samples and associated data by signing an informed consent document approved by the Ethics Commission of the Centro Hospitalar Lisboa Norte—Hospital de Santa Maria. The clinical database is authorized by the National Commission for Data Protection. 5
Saliva sample collection methods
Unstimulated whole saliva (WS) was collected from healthy subjects. Subjects were asked to refrain from eating, drinking, or perform oral hygiene procedures 1 hour before saliva collection. Before collection, subjects were asked to rinse the mouth with clean water for 30 seconds to remove desquamated epithelial cells, microorganisms, and food and drink remnants. After the mouth rinse, subjects were asked to wait for a minute before collection. Three different methods were used: passive drooling, sublingual cotton roll, and vestibular cotton roll.
Passive drooling
A 50-mL sterile tube was used to collect passive drooled saliva for 3 minutes. The tube was maintained on ice during collection to ensure the integrity of the sample.
Cotton roll-based methods
Sublingual or vestibular saliva was collected with two cotton rolls placed under the tongue or the vestibular area, respectively, for 2 minutes. The cotton rolls were placed inside a 15-mL sterile plastic tube with a sterile 100-μL pipette tip in the bottom to facilitate saliva collection by centrifugation at 10,000 g for 10 minutes at 4°C (see Supplementary Data; Supplementary materials are available online at http://www.liebertpub.com/bio). Total volume collected and protein concentration were measured, and after resuspension by vortex, the total volume was aliquoted and stored at −80°C.
Selection of collection method
A total of 36 unstimulated WS samples from nine healthy subjects were characterized for total volume of saliva and protein concentration. Volume was measured using a micropipette, and protein concentration was determined using the protein UV program of a NanoVue Spectrophotometer (Life Science, GE Healthcare).
Statistical analysis for total volume was determined by nonparametric Friedman's test (Dunn's test for multiple comparisons), and statistical analysis for total protein was determined by parametric one-way analysis of variance (ANOVA; Tukey's test for multiple comparisons) after verifying data normality.
After choosing the most suitable collection method, all subsequent procedures were completed with saliva collected by this method.
Circadian variability
Upon the establishment of the collection procedure (sublingual method), the circadian effect on saliva volume and protein concentration was assessed. The number of subjects was increased to 22 (the initial 9 subjects plus 13 other subjects) to gain statistical power. Statistical analysis was performed by paired t-test. Saliva volume and total protein concentration were estimated as described above.
Interindividual versus intraindividual variability
To evaluate whether intraindividual variability undermines the use of saliva as a marker of individual physiological and pathological status, samples from 8 healthy donors were collected at 11 different times for 5 months. Total saliva volume and total protein concentration were compared by a two-way ANOVA considering days of collection as the row factor and different individuals as the column factor.
Statistical analyses
Statistical analysis was performed using GraphPad Prism 6 (GraphPad Software). All statistical tests described in the previous sections were performed considering an alpha of 0.05. The significance levels used were those defined by GraphPad Prism 6 and are as follows: for p<0.0001, the wording used is extremely significant, represented by ****; for p<0.001, the wording used is extremely significant, represented by ***; for p-values between 0.001 and 0.01, the wording used is very significant, represented by **, and for p-values between 0.01 and 0.05, the wording is significant and the representation is *. If the p-values are above 0.05, the comparison is considered nonsignificant.
Protein profile analysis
To determine if there are characteristic variability patterns in the protein profiles obtained from healthy subjects, WS from 22 individuals was analyzed by capillary electrophoresis using an Experion™ Automated Electrophoresis System (Biorad) with standard protein chips (Experion Pro260 Analysis Kit). Samples were analyzed according to Biorad technical specifications. Briefly, for all saliva samples, sample buffer with β-mercaptoethanol was added. The saliva samples and the ladder were subjected to the same denaturing conditions (95°C for 10 min). The migration times and the concentration of each protein in the sample wells were normalized to the ladder using internal markers.
The protein profile and the quantification of the abundant protein bands were determined using the Experion Software, version 3.20.
Variability within each band was calculated by the variation coefficient of the total protein values relative to all the proteins in each group of molecular weights (MWs).
To analyze the protein profiles and the relationship between individuals according to protein concentration by MW, hierarchical clustering analysis (HCA) was computed by using PermutMatrix v1.9.3 (LIRMM; www.lirmm.fr/caraux/PermutMatrix/) 20 using the Euclidean distance and Ward's method.
Saliva protein stability at room temperature
To assess the profile of salivary protein degradation, aliquots of saliva samples from five individuals were maintained for 0, 24, 48, and 72 hours at room temperature and the protein profile was evaluated as described above.
Identification of saliva proteins
For protein processing, samples were denatured using Laemmli buffer containing sodium dodecyl sulfate (SDS) with dithiothreitol (DTT), alkylated with acrylamide, and resolved by SDS-polyacrylamide gel electrophoresis (PAGE) in 4%–15% precast polyacrylamide gels. 14 The entire gel lane was sliced, digested with trypsin, and peptides were extracted. This complex mixture of peptides was then analyzed by LC-MS/MS microreversed phase at low pH coupled to a high-resolution mass spectrometer (Triple TOF™ 5600 ABSciex®). Peptide fragmentation spectra were generated for protein identification using ProteinPilot software (ABSciex) against Uniprot.
Results
Selection of the most advantageous collection method
Comparing the vestibular, sublingual, and drooling saliva collection methods, regarding total volume of saliva collected, there are extremely significant differences between the vestibular method and both sublingual and the drooling methods (p<0.0001). The vestibular method is the one which renders the smallest volume of saliva (593.4 μL [vestibular], 1460 μL [sublingual], and 1288 μL [drooling]) (Fig. 1A). The volume collected by drooling is on average slightly lower than the volume collected by the sublingual method, but the difference is not statistically significant.
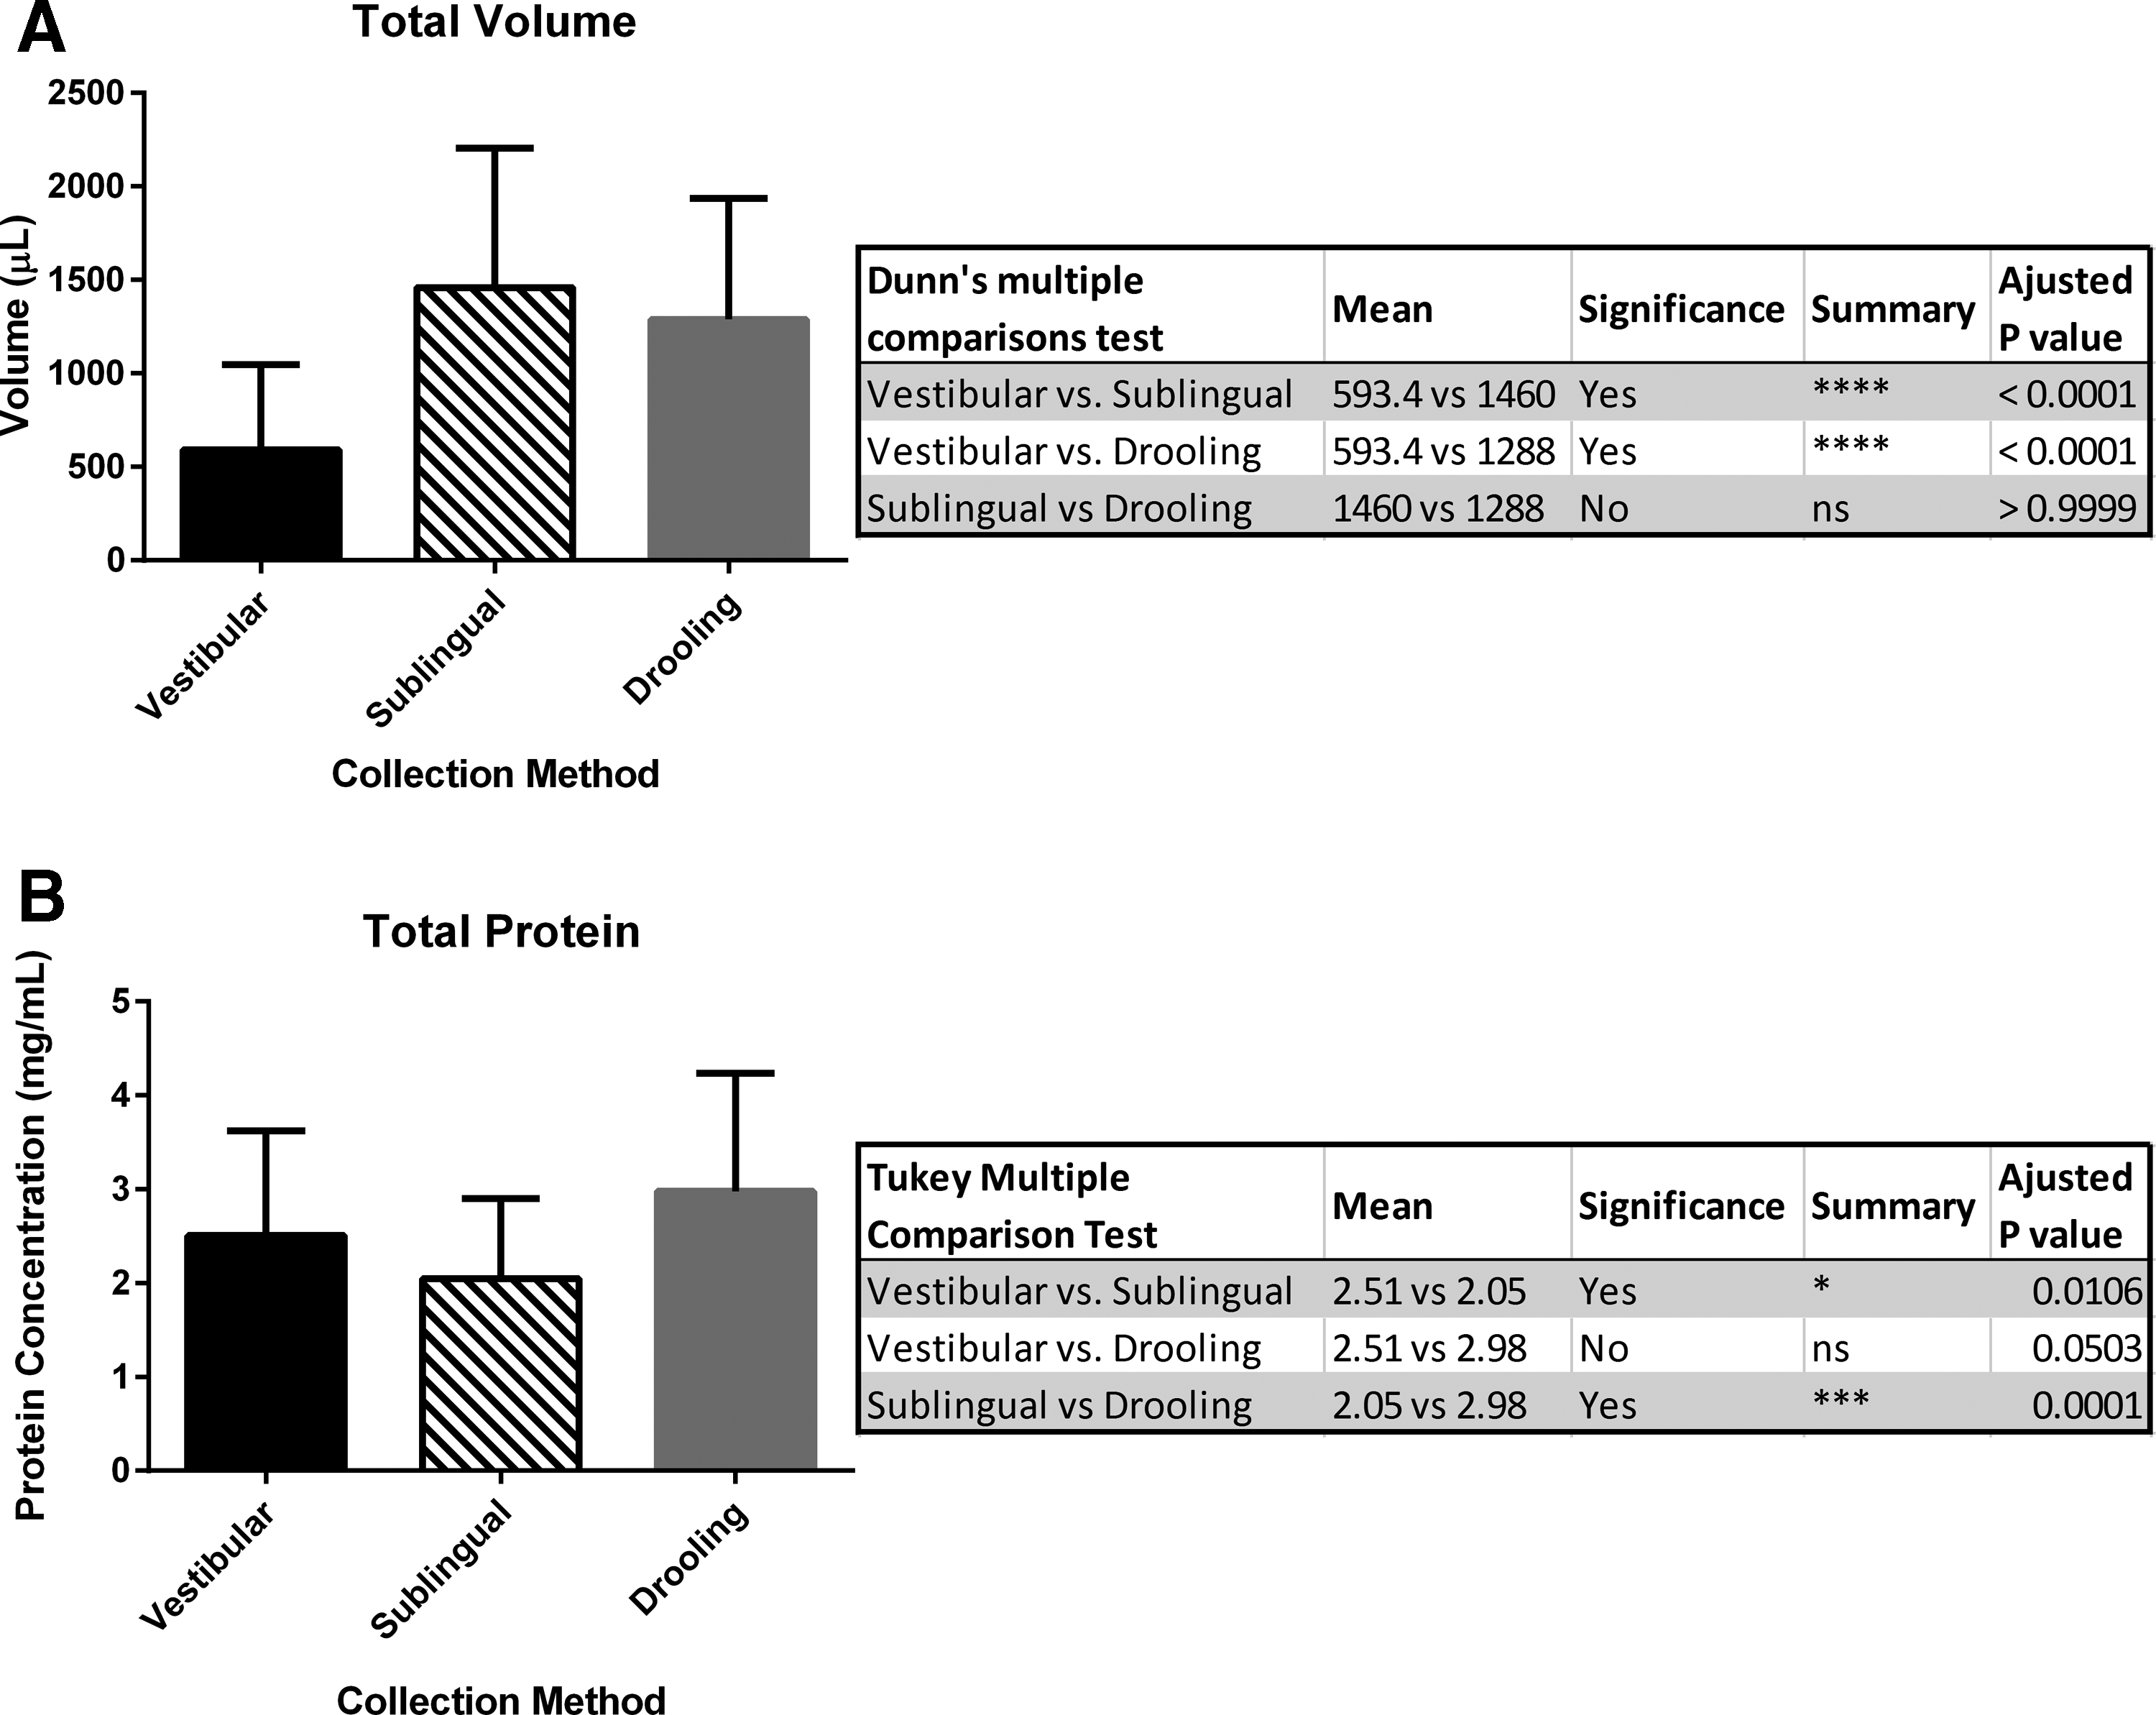
Comparison between the three collection methods considering the total volume of saliva collected
In terms of protein concentration, there is a slight difference between the sublingual (2.05 mg) and vestibular methods (2.51 mg) (p=0.0106) and a larger difference between sublingual (2.05 mg) and drooling methods (2.98 mg) (p=0.0001) (Fig. 1B). The vestibular and drooling methods were not statistically different (p=0.0503).
Based on the data obtained, the sublingual method was selected as the most adequate for the establishment of the SOP, with an average of 1.460±0.522 mL of saliva collected in 2 minutes and 2.051±1.004 mg/mL of total protein obtained.
Circadian variability
To ascertain if samples collected in the afternoon are different from samples from the same individual collected in the morning, the effect of circadian variability was determined regarding total volume of saliva and total protein (Fig. 2). The total volume is different between morning and afternoon (p=0.0119) and although the volume of morning collections is lower, sample variability is smaller (Fig. 2A).

Circadian variability regarding total volume
Regarding total protein, there seems to be no significant circadian effect (Fig. 2B).
Interindividual versus intraindividual variability
The analysis of the variability of total volume of saliva collected and total protein between and within individuals was performed on a total of 88 samples collected from 8 healthy subjects at 11 different time points throughout 5 months (Fig. 3). Statistically significant differences were obtained regarding total volume and total protein both between and within individuals (p<0.0001). However, the two-way ANOVA results show that for both variables, a higher percentage of the variation is attributed to the individual rather than collection time (Fig. 3). This difference is higher if the total protein is considered (% of total variation due to different individuals is 39.43 versus 26.13 when the samples are from the same individual, but collected at different times).

Box plot of interindividual and intraindividual variability on total volume
Protein profile variability
Knowing from the previous results that the protein concentration was variable between individuals (Fig. 3), it was necessary to study the individual protein profiles to understand if differences were due to all or only some of the proteins.
Figure 4 presents an example of the electrophoretic profile of the eight healthy individuals used as saliva donors for Figure 3. It is obvious that in spite of similar protein profiles, there are proteins which are different between individuals even though all the individuals are considered healthy. To identify the different groups of proteins, the respective electropherograms were analyzed. Nineteen protein groups were identified with the following apparent MWs: 9.2, 9.5, 9.9, 11.9, 13.3, 16.1, 22.3, 27.8, 34, 37.5, 46.5, 55.1, 61.7, 67.3, 70.1, 76, 79.1, 92.1, and 157.6 kDa, and a coefficient of variation was determined for each protein group (Fig. 5). From the 19 protein groups, we identified 5 (13.3, 16.1, 27.8, 46.5, and 61.7 kDa), which are present in all individuals studied, and two other groups are present in 85% (9.5, 70.1 kDa). From the proteins that are present in every individual, the ones which show the least variation are with MWs 16.1 and 61.7 kDa. The data from the MS analysis (Table 1) show that the possible proteins found within this range of MWs are calmodulin-like protein 3, prolactin-inducible protein (PIP), salivary acidic proline-rich phosphoprotein 1/2, cystatin D, cystatin-SA (cystatin-2), cystatin-SN (cystatin-SA-I), cystatin-S (cystatin-4), cystatin-C (cystatin-3), profilin-1, fatty acid-binding protein, serum albumin, ezrin (cytovillin), pyruvate kinase PKM, and alpha-amylase 1.

Interindividual variability of protein electrophoretic profile. The protein profile from eight different individuals (the same of Fig. 3) analyzed by capillary electrophoresis using the Experion BioRad System. (L) Ladder with a range from 10 to 150 kDa.
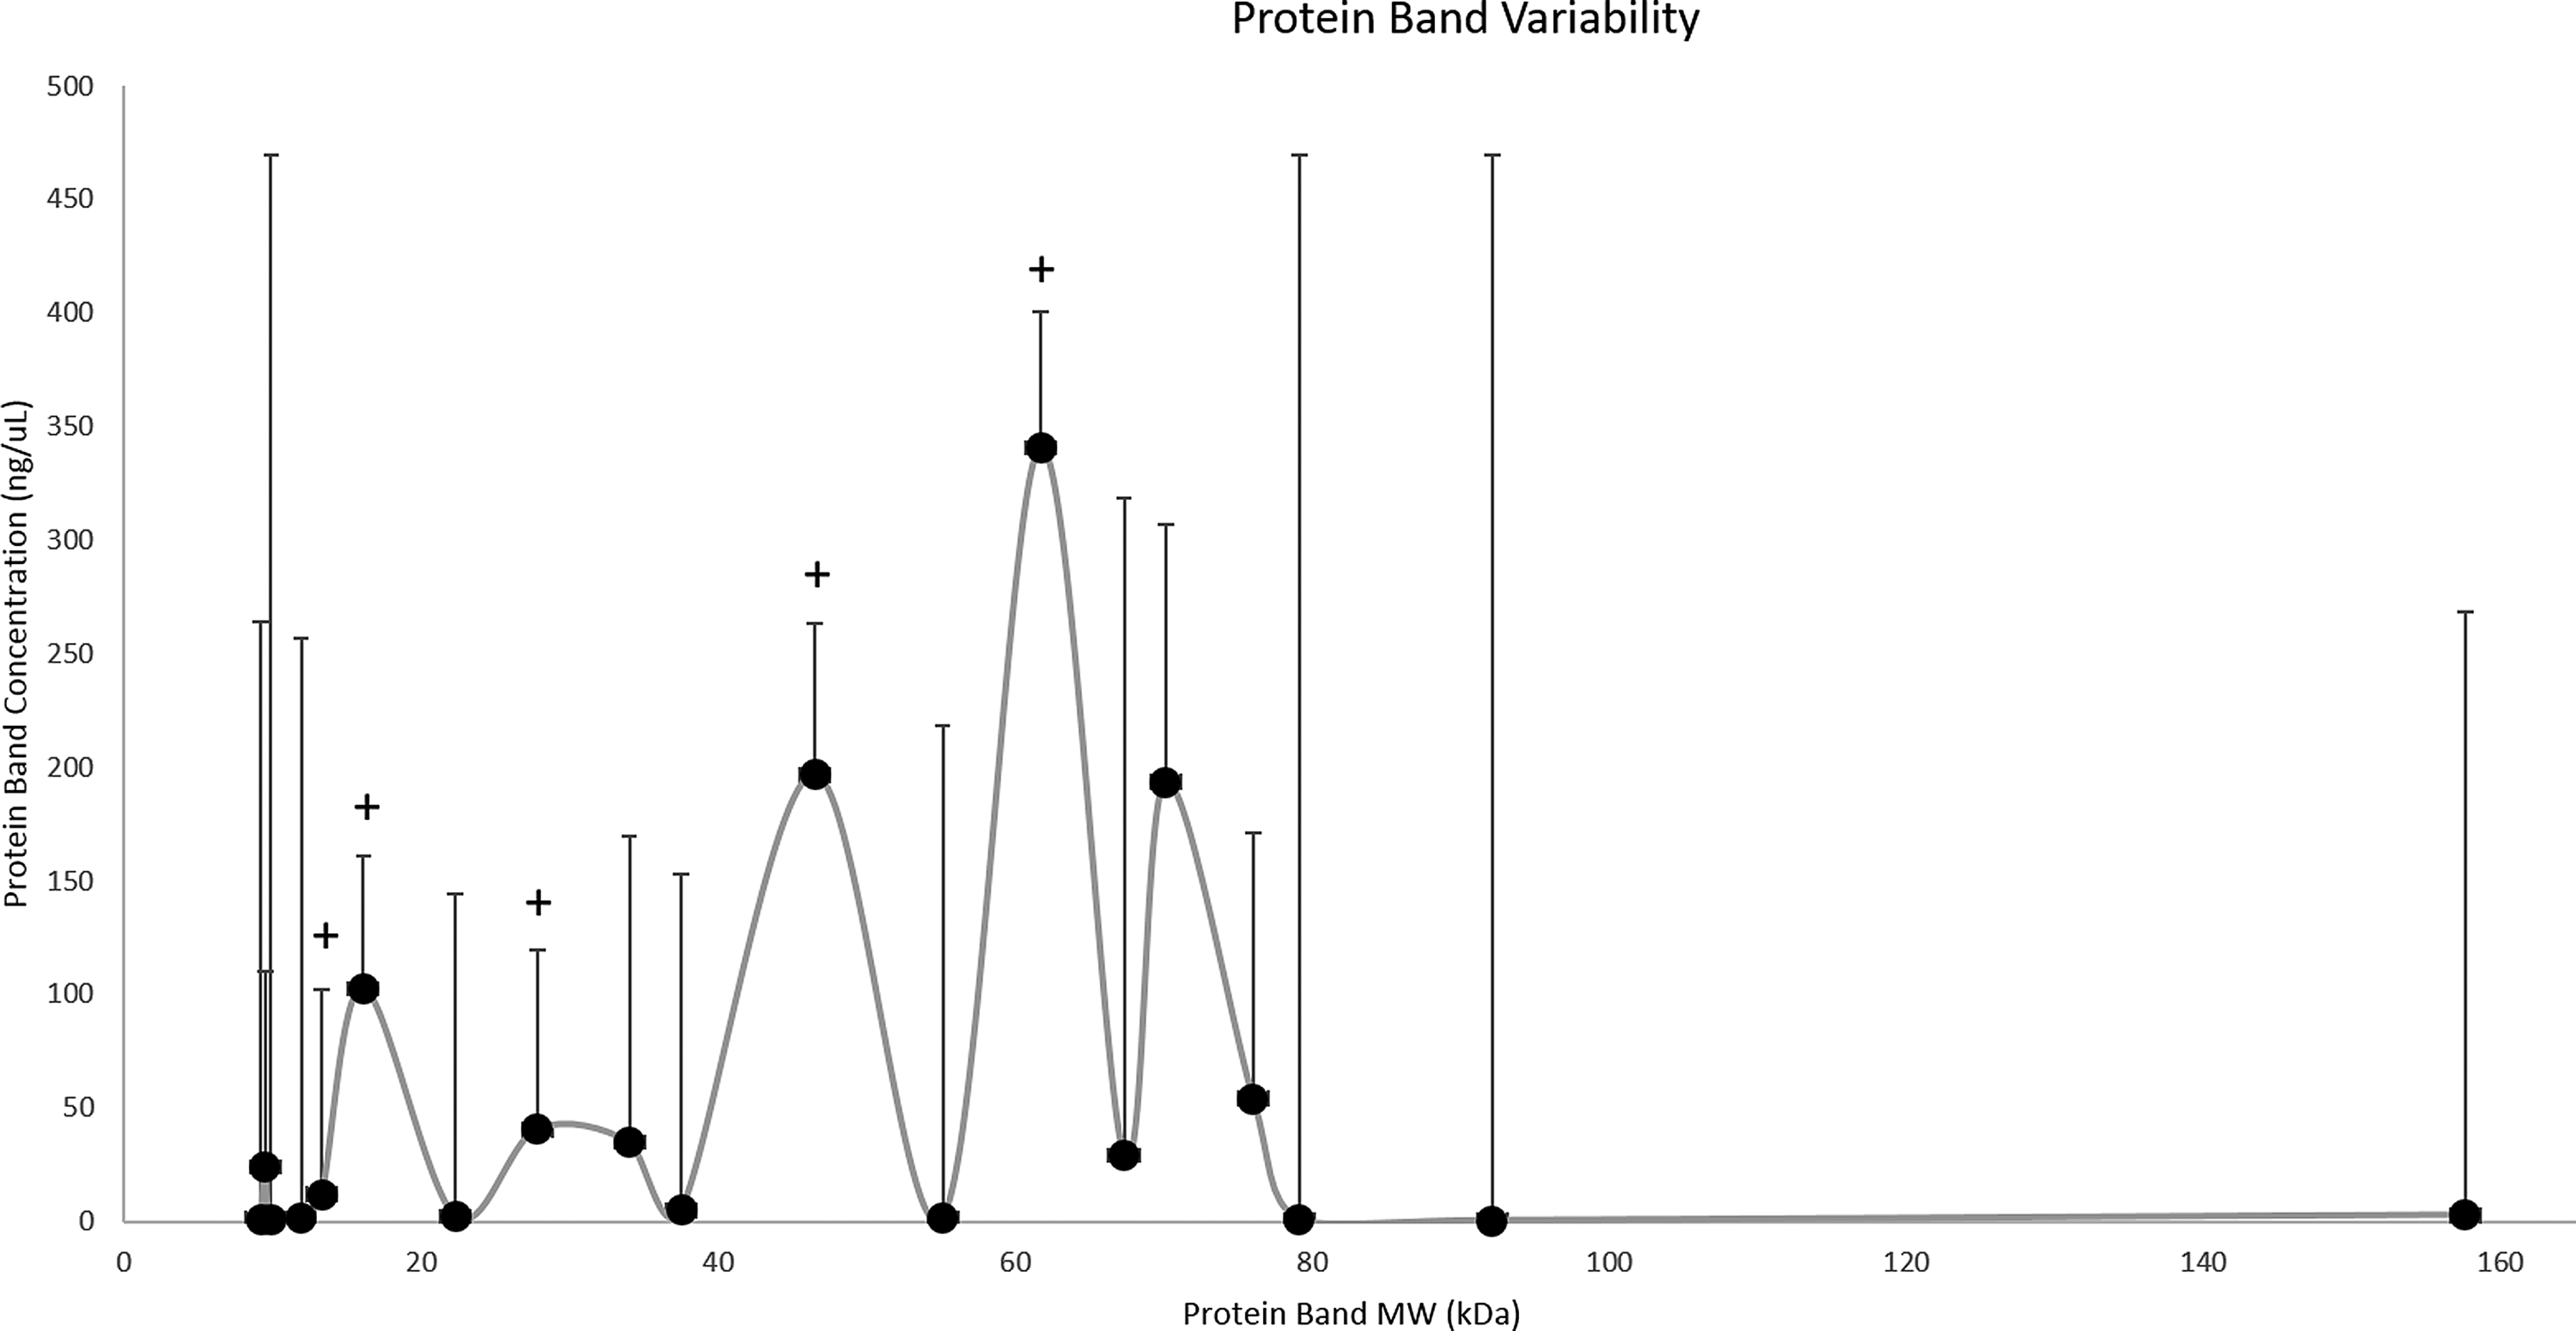
Protein band variability to identify the protein groups that are the most different between individuals (n=22); the bar indicates the %CV for each group of proteins. +Protein bands present in all individuals studied.
Protein identification was performed as previously described 14 using short GeLC-MS/MS and Protein Pilot software (v5, ABSciex) with an independent false discovery rate (FDR) based on a target-decoy approach used to assess the quality of the identifications (see the Materials and Methods section for details).
To verify if the different electrophoretic protein profiles are enough to distinguish individuals, an HCA according to Euclidean distance and Ward's method was performed (Fig. 6). It is obvious that even within healthy individuals, there are different groups in the electrophoretic patterns. The male participants are all grouped within the same cluster (6, 10, 12, 13, 18, 19, 20, 21), while the older individuals formed a different group (11 and 17) with similar protein profiles. There were two individuals taking antidepressant medication, which are also grouped (5 and 7). No relationship between the electrophoretic profile and smoking (3, 4, 5, 8, 10, and 11), alcohol consumption (2, 3, 4, 5, 6, 7, 8, 9, 10, and 11), or contraceptive medication (1, 2, 3, 4, 5, 8, 9, 11, and 17) was found.

Comparison of individual's saliva regarding the electrophoretic profile. Each column represents the data for one subject. Rows represent protein groups by molecular weights. Protein concentration in each protein band from the capillary electrophoresis profile is presented and the color code is graduated from black (minimum concentration) to light gray (maximum concentration). Cluster analysis performed with PermutMatrix using Ward's minimum variance method according to Euclidean distance (n=22).
Saliva protein degradation profile
Since saliva is a nonsterile biofluid, it becomes important to evaluate saliva stability at room temperature to identify how different protein bands are affected by degradation. Figure 7 shows the protein degradation profile of saliva samples from five individuals analyzed by capillary electrophoresis. The protein MW groups defined above were used and the MW groups in which more degradation is apparent are 9.5, 22.3, and 46.5 kDa. According to the MS data (Table 1), the potential proteins in these MW ranges are acyl-CoA-binding protein (ACBP), submaxillary gland androgen-regulated protein 3B (proline-rich peptide P-B), glutathione S-transferase P, heat shock protein beta-1 (HspB1), zymogen granule protein 16 homolog B, interleukin-1 receptor antagonist protein (IL-1RN), and alpha-1-antitrypsin. Additionally, the more conserved protein groups are 16.1 kDa (calmodulin-like protein 3, PIP, salivary acidic proline-rich phosphoprotein 1/2, cystatin D, cystatin-SA, cystatin-SN, cystatin-S, cystatin-C, profilin-1, and fatty acid-binding protein) and 61.7 kDa (serum albumin, ezrin, pyruvate kinase PKM, and alpha-amylase 1) (Fig. 5), which probably means they are less susceptible to degradation.
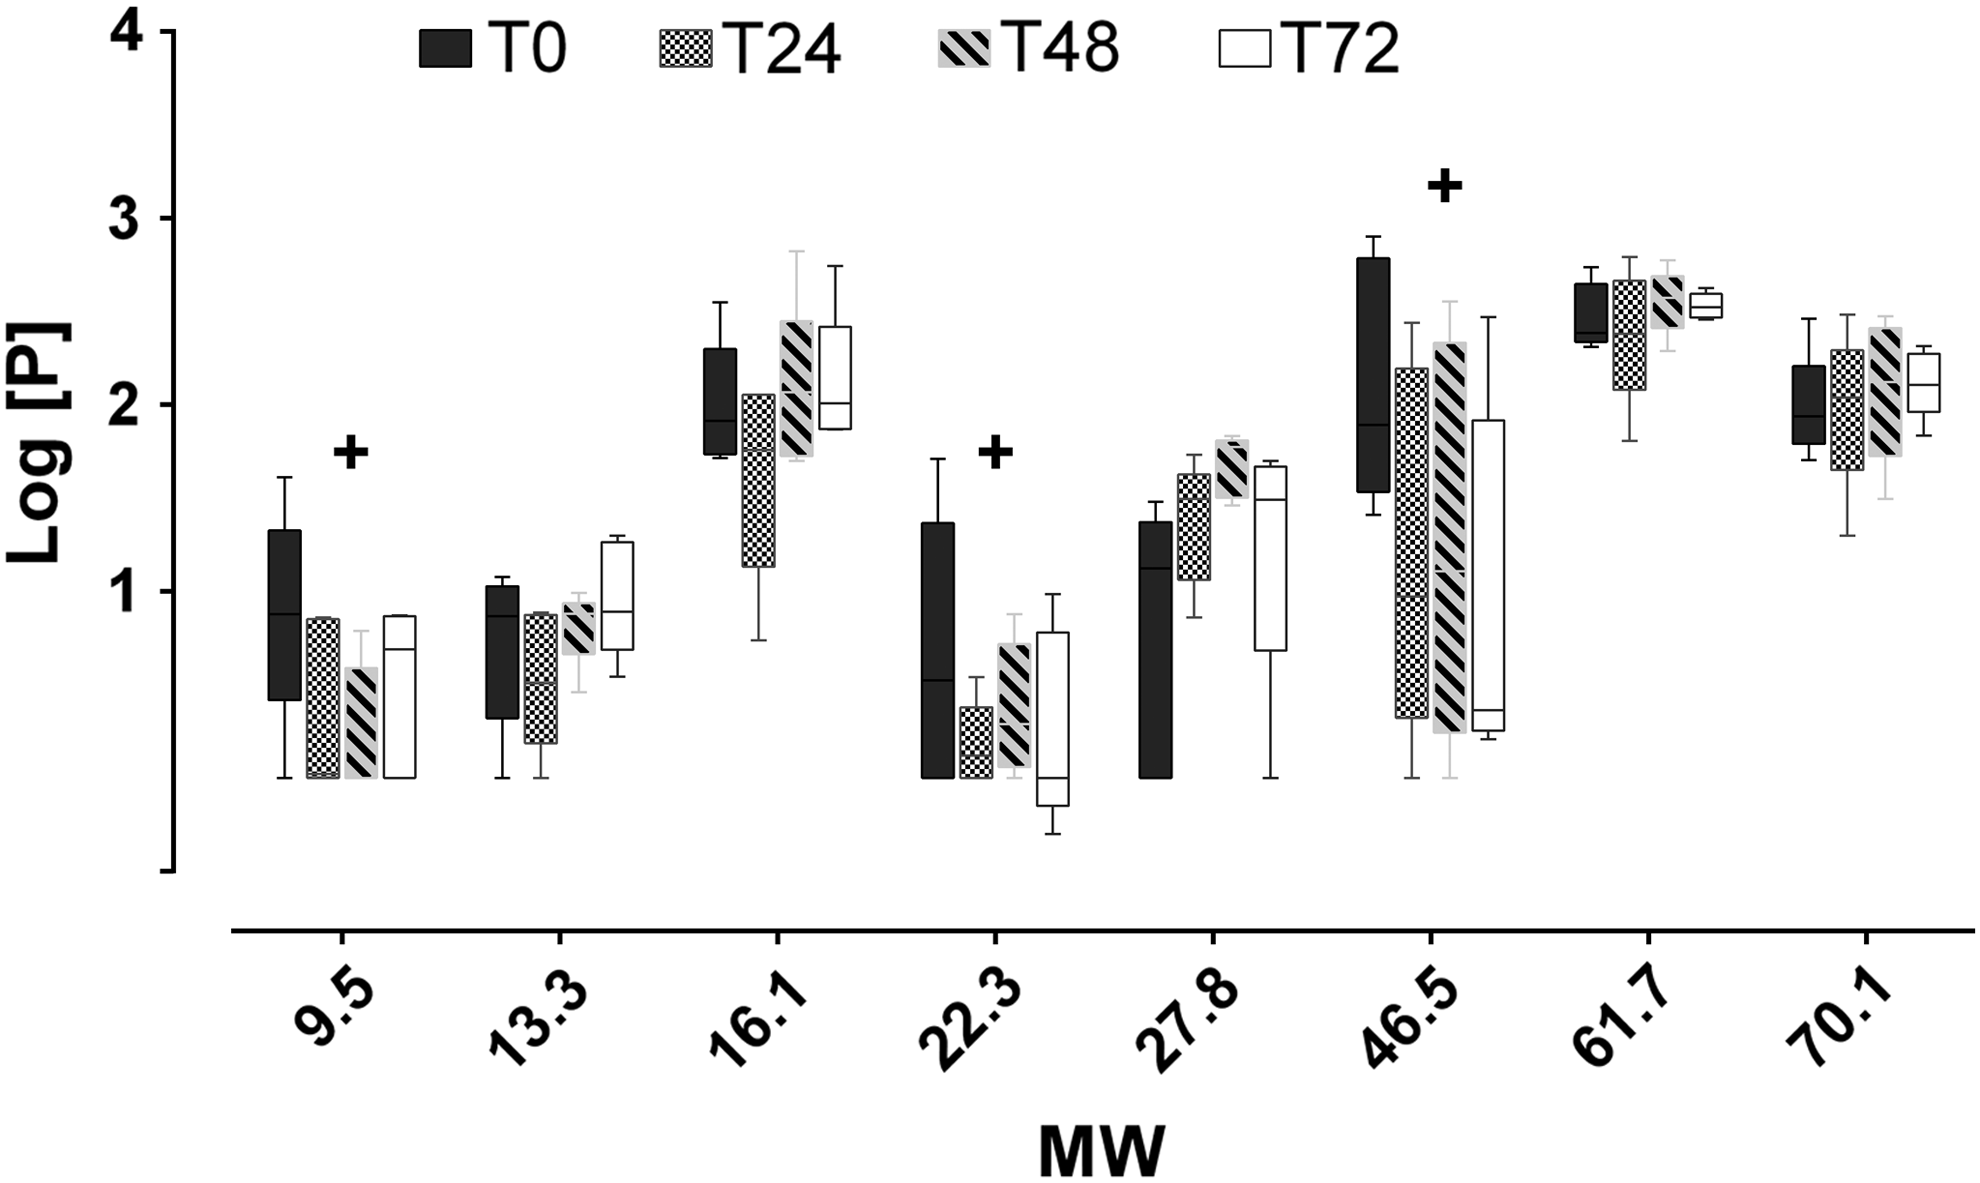
Protein degradation profile of five saliva samples exposed to room temperature during periods of 0, 24, 48, and 72 hours analyzed by capillary electrophoresis using the Experion BioRad System. The values of each box correspond to means of five individuals with minimum and maximum values indicated as error bars. +Protein bands with higher degradation.
Regardless of the degradation profile of some protein MW bands, the degradation at room temperature is only significant (p≤0.05) after 24 hours (in this assay, no enzyme activity inhibitors or antibacterial agents were added).
Identification of saliva proteins
A pool of 1012 peptides corresponding to 55 human proteins was identified (Table 1) and have previously been found in WS and are listed by OralCard. 6
Discussion
Considering our results, the sublingual cotton roll method for saliva collection ensures a suitable sample volume and protein concentration in only 2 minutes (see Supplementary Data).
These are important factors to take into account when saliva samples are collected for biobank storage purposes, and the sublingual method chosen allows for the collection of the greater saliva volume even though the quantity of saliva is slightly lower than drooling. This difference may be due to the fact that the cotton roll acts like a filter and helps to eliminate cell debris, membranes, protein aggregates, and bacterial cells. This filtration is desirable and possibly contributes to a better quality of the sample and longer stability at room temperature. The sublingual collection method is also preferred to the vestibular one because the collection of saliva sublingually allows the collection from all glands and therefore is more representative of WS, whereas the vestibular collection is mainly from the parotid glands (rich in amylase, but poor in other proteins). Amylase has also been shown to be more prone to variations due to stress/anxiety or stimulation. 21
The collection protocol selected is simple, patient-friendly, and an easy method to perform in any laboratory, requiring inexpensive minimal materials/equipment available in most laboratories. These are important considerations for large population studies.
One aspect to consider during collection is the circadian variation in protein concentration and content, and the best time for sample collection should be defined based on these results. There have been many studies evaluating circadian variations in flow rate and saliva composition.18,22–27 Our results showed significant differences between morning and afternoon sampling regarding the volume collected, but not concerning protein concentration, which were also found by others.18,23
In spite of the lack of variation in total protein, there are studies showing circadian variations in several proteins.10,22,28 Therefore, saliva collection should be performed in the morning, whenever possible. However, if a morning collection is not possible, it should still be done and the time of collection noted.
One of the concerns of saliva as a diagnostic fluid is the fact that within the same individual, its composition varies throughout time. Our results demonstrate that the variation between individuals is larger than the variation within the same individual for a period of 5 months (total volume and total protein). Similar results have been obtained by other authors regarding specific salivary components. 29 These results reinforce the potential use of saliva to monitor physiological/pathological status changes in individuals.
Regarding the protein profile, there are proteins that are present in all individuals. The proteins with the least variation in healthy subjects might have an added potential to identify phenotypical variations. Our results show that the proteins that are less variable are involved in maintaining oral health and immune response (cystatins), 30 as well as chronic inflammation and diabetes (profilin-1). 31 Another protein identified as less variable is alpha-amylase 1, which has been studied as a marker for inflammatory status, 32 tumor proliferation, 33 and stress. 34 Our results show the potential use of saliva in these applications.
The clustering analysis of the electrophoretic protein profiles showed that even within healthy individuals, there are different protein profiles. These profiles may be associated with distinct variables such as gender, age, medication (antidepressants), and sample stability that may influence protein composition of saliva. Therefore, electrophoretic protein profiles of human saliva may be used to monitor sample quality and pathological alterations of the normal protein profile as long as certain variability factors are controlled. However, these applications require confirmation with more specific and detailed data.
Sample degradation at room temperature was shown to occur mainly in the first 24 hours and some proteins bands were more susceptible to degradation. If the research is to be directed to proteins within these MW values, sample stability is a major concern and the addition of protease inhibitors is recommended.
Furthermore, the protein bands that are more conserved between individuals seem to be less prone to degradation, which makes them especially suitable for physiological and sample quality markers.
As far as we know, this is the first study where a saliva collection method was tested and evaluated, considering not only the variability in total protein, volume collected, and electrophoretic profile but also relating it to circadian rhythm, sample quality management, and protein degradation.
Our results show that it is possible to obtain saliva samples suitable for biobanking storage by an easy and inexpensive method, as long as the appropriate controls, inclusion, and exclusion criteria are taken into account to diminish the heterogeneity between different studies. Additionally, the association of a protein profile with each sample stored highly increases the amount of information available for future sample selection, incrementing the sample usability.
Footnotes
Acknowledgments
This work was developed in SalivaTec laboratory and financed by Mais Centro—Programa Operacional Regional do Centro under the Quadro de Referência Estratégico Nacional (QREN) and through the Fundo Europeu de Desenvolvimento Regional (FEDER).
This work was supported by Fundação para a Ciência e Tecnologia (FCT) with the projects: PTDC/NEUNMC/0205/2012, UID/NEU/04539/2013; and cofinanced by COMPETE Programa Operacional Factores de Competitividade, QREN; the European Union (FEDER–Fundo Europeu de Desenvolvimen to Regional); and by The National Mass Spectrometry Network (RNEM) (REDE/1506/REM/2005).
Author Disclosure Statement
No conflicting financial interests exist.
References
Supplementary Material
Please find the following supplemental material available below.
For Open Access articles published under a Creative Commons License, all supplemental material carries the same license as the article it is associated with.
For non-Open Access articles published, all supplemental material carries a non-exclusive license, and permission requests for re-use of supplemental material or any part of supplemental material shall be sent directly to the copyright owner as specified in the copyright notice associated with the article.