
Abstract
To study mucosal immunity and conduct HIV vaccine trials, it is important to be able to cryopreserve mucosal specimens and recover them in functional viable form. Obtaining a good recovery depends, in part, on cooling the cells at the appropriate rate, which is determined by the rate of water transport across the cell membrane during the cooling process. In this study, the cell membrane permeabilities to water at subzero temperatures of human vaginal mucosal T cells and macrophages were measured using the differential scanning calorimetry method proposed by Devireddy et al. in 1998. Thermal histograms were measured before and after cell lysis using a Slow-Fast-Fast-Slow cooling program. The difference between the thermal histograms of the live intact cells and the dead lysed cells was used to calculate the temperature-dependent cell membrane permeability at subzero temperatures, which was assumed to follow the Arrhenius relationship,
Introduction
M
The fate of a cell after freezing and thawing is determined by heat and mass transfer and the biophysical response of the cell to environmental changes, which depends on the fundamental cryobiological characteristics of the cell, including the osmotically inactive cell volume (Vb), cell membrane permeability to water (Lp) and to cryoprotective agent (CPA) (Ps), intracellular ice formation temperature (TIIF), osmotic tolerance limit of the cell, cytotoxicity of CPA to the cell, and others.3–7 To develop an optimal procedure, we studied the fundamental cryobiological characteristics of human vaginal T cells and macrophages. In this article, we describe a set of those studies: the measurement of membrane permeabilities to water (Lp) at subzero temperatures. The rate at which water crosses the cell membrane at subzero temperatures determines the rate at which cells can be cooled with the greatest recovery. Based on Mazur's two-factor hypothesis, if cells are cooled too slowly, cellular injury can occur due to severe cell dehydration and the solution effect; by contrast, if they are cooled too quickly, a large amount of water will crystallize inside the cell, which can disrupt the membrane and be lethal to the cell (ice injury)5,7 The optimal cooling rate will fall between those two extremes and depend on the membrane permeability to water.
There have been many methods proposed and applied by researchers to measure the cell membrane permeability to water, primarily at temperatures above the freezing point.8–18 However, the membrane permeability at subzero temperatures, for example, in the range of 0°C to −35°C, plays an important role because cell death by solution injury or ice injury occurs in this range. One method to determine the permeability in this range is to measure the Lp values at a few suprazero temperatures (e.g., 22°C, 10°C, and 4°C), and then predict the Lp at subzero temperatures with the Arrhenius relationship. However, this may lead to inaccuracy in Lp prediction possibly due to the liquid–gel (solid) phase change of lipid and membrane protein conformation.17,19,20 Therefore, direct measurement of the Lp values at subzero temperatures is vital for the optimization of the cooling process.
A method of direct measurement of Lp at subzero temperatures using differential scanning calorimetry (DSC) was proposed by Devireddy et al. 21 Later, this method was applied for the measurements of cryobiological properties of both cells and tissues.22–28 In this study, we used this method to investigate the temperature-dependent cell membrane permeability to water for human vaginal mucosal T cells and macrophages. Based on the results, we predicted the theoretically optimal cooling rates for the immune cells and tested those rates in preliminary cryopreservation experiments.
Materials and Methods
Theory of the DSC measurements
The theory of measuring cell membrane properties at subzero temperatures with DSC was first developed by Devireddy et al.
21
In our study, a similar Slow-Fast-Fast-Slow (SFFS) cooling protocol was applied to cell suspensions of pure, sorted vaginal T cells or macrophages. Details of the method and theory derivation are as presented in Devireddy et al.
21
In brief, heat transfer is measured for a suspension of live cells during the first slow freezing (4°C/min), and then measured again for the same cell suspension during the second slow freezing after lysis by repeated fast freezing (200°C/min). Based on the difference between the two thermograms, the volume response of cells during freezing can be calculated as follows:
where V(T) is the cell volume at temperature T, V0 is the initial volume in isotonic environment, Vb is the osmotically inactive volume, ΔqDSC is the total difference of heat release between the first and the last slow cooling steps, and ΔqDSC(T) is the partial difference of heat release between the two slow cooling steps down to temperature T. The osmotically inactive volume, Vb, of human vaginal T cells and macrophages was determined to be 51.6% V0 and 45.7% V0, respectively, by the Boyle–Van't Hoff relationship (Shu et al., submitted). 29
Water transport across cell membranes during cooling
After V(T) of cells is calculated based on the DSC measurements, the cell membrane permeability to water at any temperature below 0°C, Lp(T), can be simulated according to Mazur and Toner's model of water transport across cell membranes and the following Arrhenius equation6,30,31:
where Ac = 4πr2 is the cell surface area and assumed constant during cooling, R is the universal gas constant, B is the cooling rate, T0 is the initial temperature, Vb is the osmotically inactive cell volume, ns is the number of moles of salts, vw is the specific molar volume of water, ø s is the dissociation constant ( = 2 for NaCl), Lpg is the Lp at the reference temperature Tr (generally 273.15 K), and Ea is the activation energy of the dependence of Lp on temperature.
Equations (2) and (3) are applied to calculate the cell membrane permeability to water at subzero temperatures based on the DSC results. They are also used to predict the optimal cooling rate for a cell type based on the Lp(T) results.
DSC calibration and experiments
Before each set of experiments, the DSC 8500 (PerkinElmer, Waltham, MA) was carefully calibrated following the user manual, including the calibrations of temperature, heat flow, and furnace control. Besides indium as the standard reference material for the calibration, two more reference materials, n-octane and n-dodecane, were also used to calibrate the temperature and heat flow because their subzero freezing/melting temperatures are close to or within the DSC scanning temperature range in the experiment (0°C to −40°C). After calibration, the phase transition temperature error was <0.2°C and latent heat error <1%. The DSC furnace was calibrated in the temperature range of −80°C to 200°C. After calibration, the differences between the real sample temperature and programmed temperature were <0.05°C in the isothermal equilibration step and <0.5°C in the scanning step with cooling rate lower than 10°C/min.
In the DSC experiments, 5–10 μL of each cell suspension (weighed with microbalance) was added to the aluminum pan provided by the PerkinElmer Company; 0.1–0.2 mg freeze-dried Pseudomonas syringae (ATCC, Manassas, VA) was added to each sample as an ice nucleator to reduce supercooling. Then, the pan was sealed with the crimper. The mass of each sample was precisely measured. The Slow-Fast-Fast-Slow DSC scanning protocol in our experiments was very similar to that used in Devireddy et al., 21 except the modification that repeated fast cooling steps were applied to lyse the cells.
Human vaginal mucosal specimens
Human vaginal tissue specimens were obtained from vaginal repair surgeries at the University of Washington Medical Center under a waiver of consent approved by the Institutional Review Board of the University of Washington.
Sorting of vaginal T cells and macrophages
T cells and macrophages were purified from vaginal tissues by dissection, enzymatic digestion, and flow cytometric sorting. The vaginal epithelium was trimmed to small pieces, about 1 × 1 × 2 mm, and rested overnight in cell culture medium at 4°C. Cells were subsequently isolated from the epithelium by digestion with collagenase type II (Sigma-Aldrich, St. Louis, MO), as described previously. 32 The pieces of tissue were digested in a solution of collagenase type II and DNase (both at 700 units/mL) at 37°C with shaking for a maximum of four rounds of 30 minutes each. In between digestions, tissues were passed through a blunt needle and syringe, and the cell suspension separated from the tissues by filtration through a 70-μm strainer. Once the cell suspension was obtained, pure populations of vaginal T cells and macrophages were isolated by flow cytometric sorting on a four-laser BD FACSAria II (408, 488, 535, and 633 nm). Cells were stained with CD45 APC, CD3 FITC, and CD14 PE-Cy7 (all mouse anti-human from BD Biosciences, San Jose, CA) and 0.1 μg/mL 4′,6-diamidino-2-phenylindole (DAPI) for viability. All antibodies were titrated before use and used at the minimum saturating dose. T cells were defined as live CD45+CD3+CD14− and macrophages defined as live CD45+CD3−CD14+ events. The purified cell populations were suspended in 1× phosphate-buffered saline at about 3 × 10⁷ cells/mL and stored on ice before use within 8 hours.
Cryopreservation of the human vaginal immune cells with different cooling rates
Human vaginal mucosal cells were cryopreserved at different cooling rates. After digestion, cells were suspended in RPMI-1640 culture medium at 4°C with 12.5% bovine serum albumin and 200,000 cells aliquoted into each cryovial. A 2× solution of cryopreservation medium was added dropwise for a final volume ratio of 1:1. The final concentration of cryoprotective agents was 6% dimethylsulfoxide, 5% ethylene glycol, and 6% hydroxyethyl starch. The cryovials were then frozen to −80°C at either 1°C/min in a Mr. Frosty or at 2.5°C/min, 3.5°C/min, or 10°C/min in a cooling rate-controlled freezer (CryoMed; Fisher Scientific, Hanover Park, IL). The samples were then transferred to the vapor phase of a liquid nitrogen tank and stored for several days. For thawing, the frozen samples were taken out of liquid nitrogen and thawed quickly in a 37°C water bath with gentle agitation for about 30 seconds until only tiny ice crystals remained in the vial. One milliliter of 37°C cell culture medium was added to each cryovial dropwise over about 30 seconds, the cell suspension was transferred to 15-mL conical tubes containing 10 mL, 37°C, cell culture medium, and the cells were washed by centrifugation at 300 g for 10 minutes.
Cell viability assessment
After thawing, cell number and viability were determined by flow cytometry. Cells were stained with fixable live/dead aqua (Life Technologies, Grand Island, NY) at a dilution of 1:50 for 20 minutes and washed. They were subsequently stained with CD45 APC, CD3 FITC, and CD14 PE-Cy7 at the minimum saturating doses for 20 minutes (all mouse anti-human from BD Biosciences) and washed again. Finally, the samples were transferred to Trucount absolute counting tubes (BD Biosciences) and fixed with 1% paraformaldehyde. Samples were acquired on a five-laser BD LSRII (355, 408, 488, 535, and 633 nm) within 1 week. Events were gated on CD45+, divided into CD14+CD3− and CD14−CD3+, and gated for viability using FlowJo version 9 (FlowJo, LLC, Ashland, OR). The number of cells per sample was determined relative to the number of Trucount beads acquired. Recovery reflects the number of live cells recovered out of the number of live cells in the fresh control sample from the same donor. Data were analyzed in R version 3.2.033,34 using the packages, dplyr 35 and ggplot2. 36
Results
Cell membrane permeability to water (Lp(T))
From the experimental DSC heat flow (mW)–time (minutes) data, the thermogram difference between the live and dead cell suspensions (ΔqDSC) and the partial thermogram difference at temperature T [ΔqDSC(T)] were determined with Pyris software (PerkinElmer). The cell volume change history V(T) was determined as described in Equation (1). 21 The water transport model [Eqs. (2) and (3), cooling rate B = 4°C/min] and MLab software were then used to simulate Lpg (cell membrane permeability to water at the reference temperature Tr, 273.15 K) and Ea (activation energy) by nonlinear regression curve fitting of the experimental V(T) data (MLab for PC; Civilized Software, Inc., Silver Spring, MD). An example of the experimental V(T) curve based on DSC data and the curve-fitting results for the estimation of Lpg and Ea is shown in Figure 1. The estimated Lpg and Ea results for human vaginal mucosal T cells and macrophages are shown in Table 1.

Simulation of Lpg and Ea by nonlinear regression curve fitting of the normalized cell volume fraction changes during cooling [V(T)/V0].
Prediction of optimal cooling rates for human vaginal mucosal T cells and monocytes
After the cell membrane permeabilities to water at subzero temperatures were obtained, the water transport process across cell membranes during cooling was simulated. The numerical simulation results are shown in Figure 2A and B for human vaginal mucosal T cells and macrophages, respectively. It shows that cell dehydration generally stalls at temperatures lower than −20°C because Lp decreases dramatically with lower temperature. For example, Lp of T cells at −20°C decreases to 0.72% of the Lp at the reference temperature (273.15 K). From the results, cells undergo severe dehydration at slow cooling rates (e.g., less than 10% water remaining in the cell at cooling rate 0.5°C/min), which may lead to solute injury to the cells. At high cooling rates, much water remains inside the cell (e.g., ∼80% water remaining in the cell at cooling rate 20°C/min). Assuming that about 10% of cellular water should remain in the cell when ice forms,4,37 the predicted optimal cooling rates for human vaginal mucosal T cells and macrophages are both about 3°C/min.
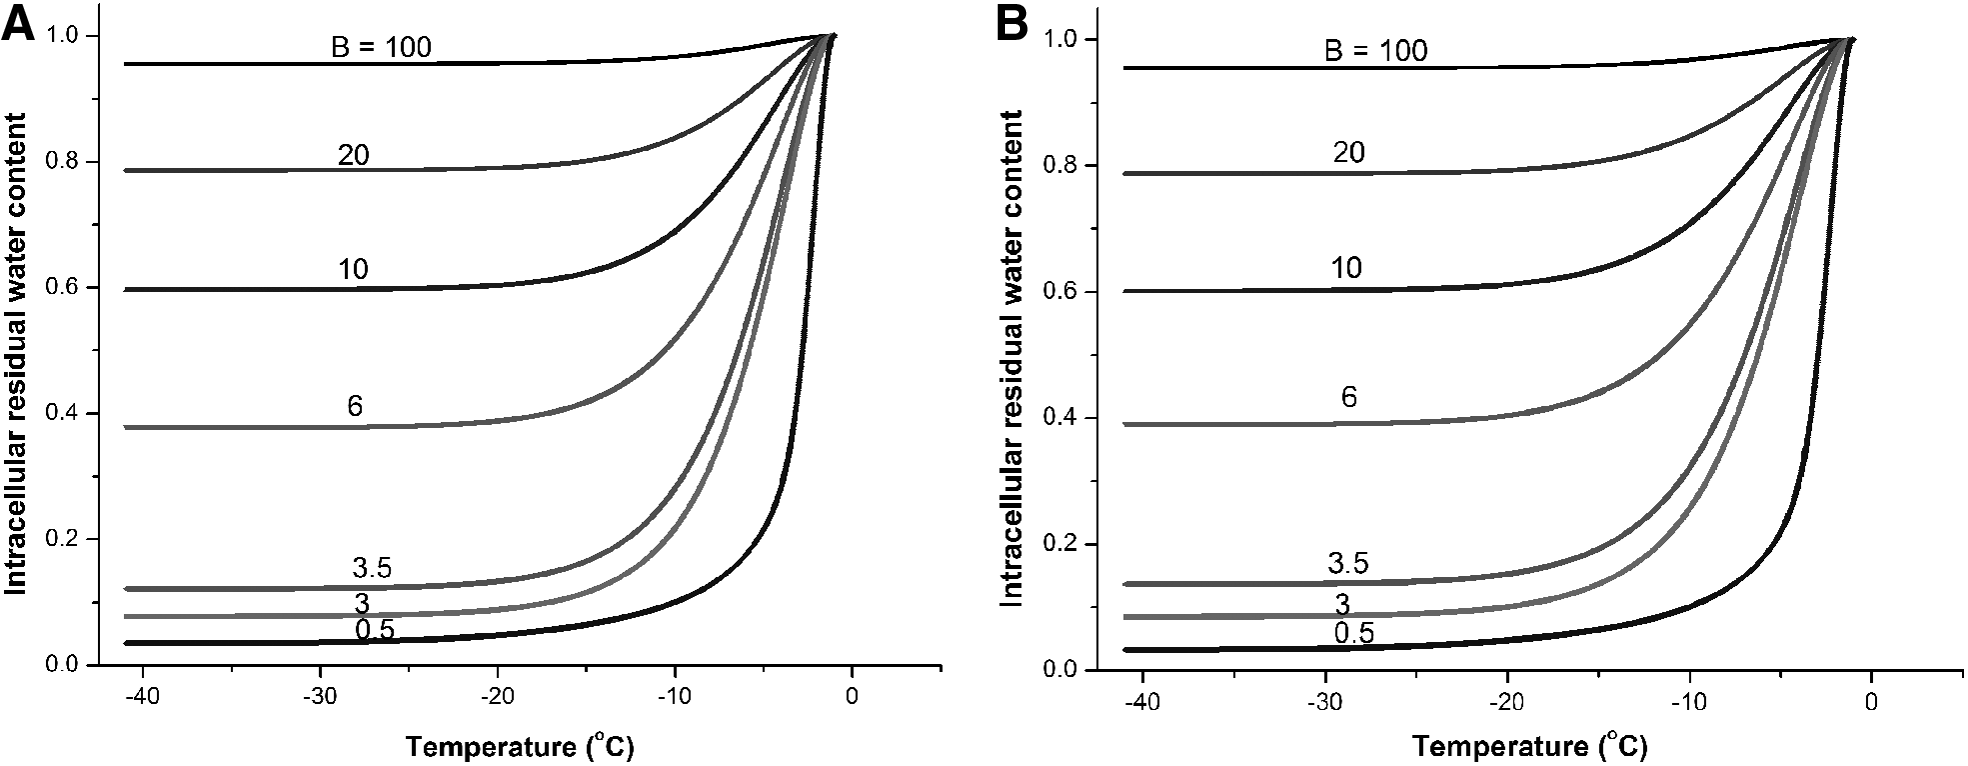
Simulation of intracellular residual water content normalized to initial water content for the prediction of the optimal cooling rates.
Experimental verification of the optimal cooling rate
To test the prediction that ∼3°C/min is optimal for mucosal immune cells, we froze cells at various cooling rates (2.5°C/min, 3.5°C/min, and 10°C/min) and measured viability and recovery after thawing. In each case, we conducted experiments in parallel, freezing two cryovials at 1°C/min and two cryovials at the experimental cooling rate. After storing in liquid nitrogen for a week, we thawed the samples side by side and measured recovery, averaging the replicate cryovials within each experiment. In total, we conducted experiments with 10 samples, using 1°C/min (standard for peripheral blood mononuclear cells, n = 10) and 2.5 (n = 3), 3.5 (n = 5), or 10 (n = 2) °C/min. This gave a common reference point for each comparison.
We found that the predicted cooling rate of about 3°C/min provided good recoveries (Fig. 3A, B). In fact, 1°C/min, 2.5°C/min, and 3.5°C/min yielded similar recoveries for both cell types. At 2.5°C/min, 0.44% (95% confidence interval [CI]: −16.08, 15.2) fewer live T cells and 1.67% (95% CI: −9.88, 13.23) more live macrophages were recovered than at 1°C/min. Statistical testing for a difference in recovery between 1°C/min and 2.5°C/min (by paired t-test, taking a p-value of 0.05 as significant) gave p-values of 0.91 for T cells and 0.60 for macrophages. Similarly, there were no significant differences between 3.5°C/min and 1°C/min: the difference was −0.39% (95% CI: −9.58, 8.81; p = 0.91) for T cells and −4.02% (95% CI: −17.94, 9.89; p = 0.47) for macrophages.
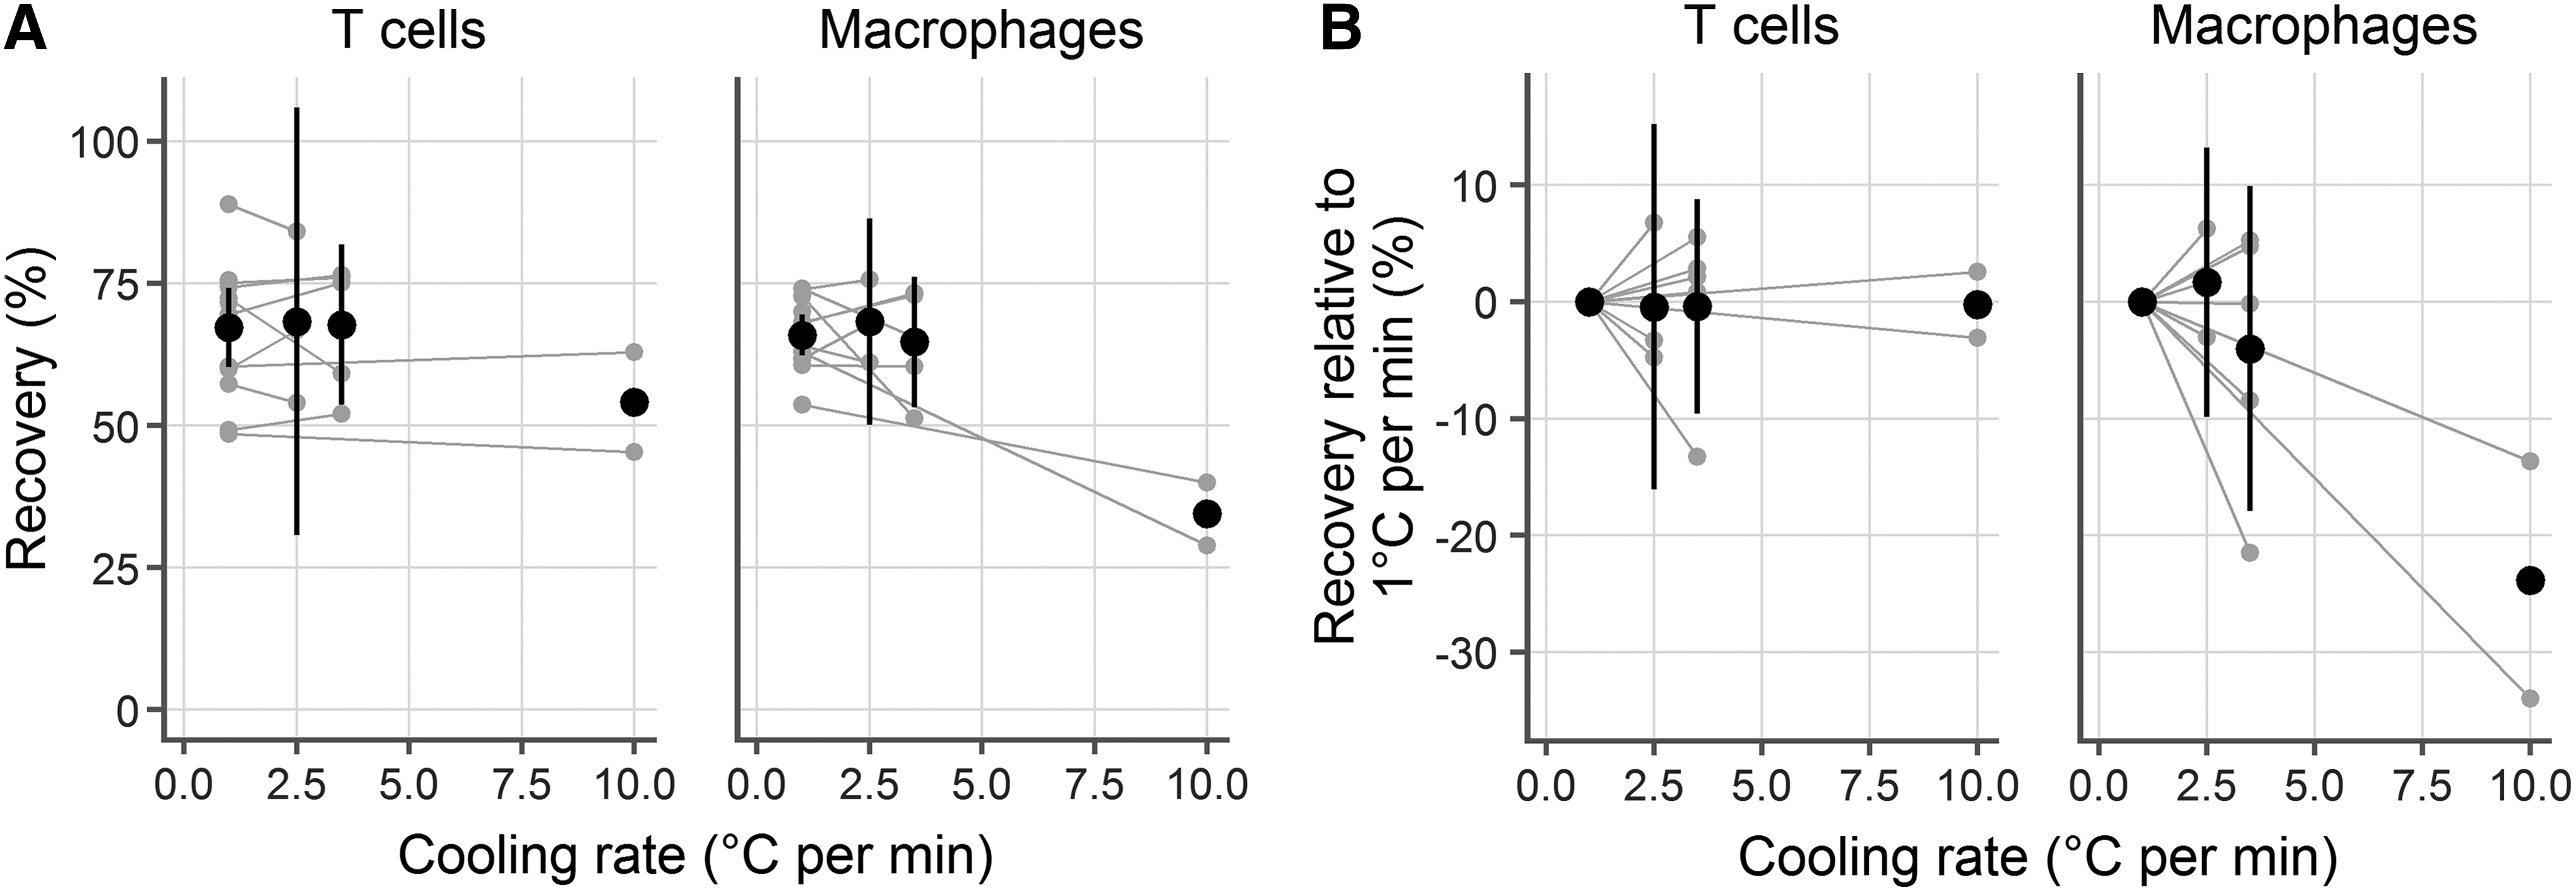
Experimental confirmation of the predicted optimal cooling rate. Human vaginal CD3+ T cells (left) and CD14+ macrophages (right) were cryopreserved at 1°C/min and 2.5°C/min, 3.5°C/min, or 10°C/min. Each gray dot represents the average of duplicate cryovials frozen from a single donor and gray lines indicate pairing. Black symbols indicate the mean of the experiments at that temperature and the black lines represent the 95% confidence interval (omitted for the 10°C/min case where n = 2).
However, a cooling rate of 10°C/min was notably worse than 1°C/min for CD14 macrophages, with a mean difference of −23.83% (95% CI: −152.7, 105.04; p = 0.26). Surprisingly, it did not make a difference for T cells, where the difference was only −0.25% (95% CI: −36.39, 35.89; p = 0.94).
Discussion
DSC was used to measure the cell membrane permeabilities of human vaginal macrophages and T cells to water at subzero temperatures, using the approach proposed by Devireddy et al.
21
The results showed that in the temperature-dependent relationship of cell membrane permeability
The error in the estimates of Lpg and Ea may be caused by many factors, such as the validity of the assumptions (equilibrium cooling for the slow cooling steps, all cells lysed in the fast cooling steps, and others) and the accuracy of the DSC measurements. Another possible factor is the accuracy of the osmotically inactive cell volume (Vb). The dependence of the cell membrane permeability on Vb was investigated. Our results showed that if Vb changed by ±10%, Lpg values for T cells and macrophages changed by ±8%–11%, while the change in Ea for both cell types was within ±2%.
Some other cell types have been tested by different methods (DSC, photomicrography, or Coulter counter) in different temperature ranges, as shown in Table 2. We can see that many factors may influence the values of Lpg and Ea, including the cell type, cell origin, temperature range, presence of CPA, osmotic environment, cooling rate, and others. For example, sperm from different species have dramatically different cell membrane characteristics, where Lpg may vary from 0.0017 to 0.02 μm/min/atm and Ea may vary from 9.8 to 85.5 kcal/mol. The most similar experiments to ours in the subzero temperature range (0 to −50°C) were conducted on Epstein-Barr virus transformed (EBVT) lymphocytes. Our Ea value is about three times higher than that for EBVT and our Lpg is about five times lower. Human lymphocytes from blood have also been studied at suprazero temperatures (10°C–37°C) by two different methods (photomicrography or Coulter counter). The activation energies differed by about fivefold in those two studies. Our activation energy in the subzero temperature range was 3–12 times higher. Human monocytes, a precursor of macrophages, have also been studied at temperatures around zero. In this case, the activation energy we measured is about three times higher than what was reported in the article. Of course, mucosal T cells and macrophages are not the same as T cells and monocytes from the blood, so it is reasonable to expect that they have unique properties.
EBVT, Epstein-Barr virus transformed; DMSO, dimethylsulfoxide; DSC, differential scanning calorimetry.
While the DSC method is useful because it allows measurement of the average membrane permeabilities of many cells with spherical or nonspherical shape at low temperatures, it also has some limitations. First, it is assumed that all cells are killed by the fast cooling step, which was performed twice to increase reliability in this work, but it is possible that some cells may remain intact. Additionally, the compromised membranes of some cell types (ghosts), such as red blood cells, can self-reseal during the thawing step before the last slow cooling step. 38 To test the sufficiency of the fast cooling steps, suspensions of mucosal immune cells were immersed in liquid nitrogen (for cooling at 100–300°C/min) and stained with trypan blue after thawing. Less than 4% of total cells remained viable, suggesting that the fast cooling steps used here were adequate.
Second, it is assumed that in the slow cooling steps, equilibration cooling happens without sufficient supercooling or ice crystallization inside the cells. Theoretical simulation of cooling at −4°C/min (the slow cooling rate used in the DSC experiments; Fig. 2A, B) indicates that the residual water content remaining inside the cells during cooling was small (17.2% for T cells and 18.9% for macrophages at −40°C). At such a low cooling rate, the effects of intracellular supercooling or ice formation can be ignored. A lower cooling rate (e.g., −1°C/min) could be better because it achieves even more cell dehydration. However, the DSC scanning program would take much longer and solute injury may also be potentially induced in slower cooling.
Additionally, it is worth noting that no measurements were done in the presence of cryoprotective agents, so the predicted optimal cooling rates do not take the effect of CPAs into account. The effects of CPA may influence many properties of the cell and the solution, such as cell membrane permeability to water, IIF temperature and probability, solution viscosity, and phase transition properties. The effect of CPAs on the cell membrane properties and IIF kinetics of mucosal immune cells at subzero temperatures will be studied in future work.
Footnotes
Acknowledgments
This study was supported by funds received through the Mucosal Immunology Group (![]() ), a group funded by a supplement to the HIV Vaccine Trials Network (HVTN) grant, an HIV/AIDS clinical trials network funded by the National Institute of Allergy and Infectious Diseases (NIAID), U.S. National Institutes of Health (UM1AI068618); by a supplement to R33AI094412 funded by NIAID; and by the Bill and Melinda Gates Foundation (OPP1032522). The funders had no role in study design, data collection and analysis, decision to publish, or preparation of the manuscript.
), a group funded by a supplement to the HIV Vaccine Trials Network (HVTN) grant, an HIV/AIDS clinical trials network funded by the National Institute of Allergy and Infectious Diseases (NIAID), U.S. National Institutes of Health (UM1AI068618); by a supplement to R33AI094412 funded by NIAID; and by the Bill and Melinda Gates Foundation (OPP1032522). The funders had no role in study design, data collection and analysis, decision to publish, or preparation of the manuscript.
Author Disclosure Statement
No conflicting financial interests exist.