
Abstract
Background:
Biobanks are useful platforms to build bridges between basic, translational, and clinical research and clinical care. They are repositories of high-quality human biological samples ideal for evaluating their histological characteristics and also their genome, transcriptome, and proteome. The Spanish Renal Research Network Biobank contains more than 76,500 well-preserved frozen samples of a wide variety of kidney diseases, collected from 5450 patients seen by over 70 nephrology services throughout the Spanish territory.
Objective:
To determine and to report the results of the quality control of samples and processes conducted in our biobank, implemented in accordance with the requirements of the ISO 9001:2008 international standard.
Study Design:
Two types of quality controls were performed: (1) systematic, that is, measurement of viable peripheral blood mononuclear cells (PBMCs) obtained and purity of nucleic acids and (2) ad-hoc, that is, viability of thawed PBMC, DNA extraction process reproducibility, and the integrity and functionality of nucleic acids, implemented on a routine basis.
Methods and Results:
PBMC isolation by Ficoll yielded reproducible results and its cryopreserved viability was >90%. Acceptable A260/A280 ratios were obtained for the vast majority of the DNA (n = 2328) and RNA (n = 78) samples analyzed. DNA integrity was demonstrated by agarose gels and by β-globulin gene polymerase chain reaction (PCR) amplification of 1327 and 989 bp fragments. DNA of acceptable quality had at least three bands of β-globulin amplified obtained (n = 26/30). RNA integrity number (RIN) determinations obtained RIN numbers ≥7 (n = 87/96). The amplifiability of nucleic acids was confirmed by qPCR and RT-qPCR of β-actin and GAPDH genes. Long storage or delayed processing time did not affect the quality of the samples analyzed. The processes of DNA extraction also yielded reproducible results.
Conclusions:
These results clearly indicate that our PBMC, DNA, and RNA stored samples meet the required quality standards to be used for biomedical research, ensuring their long-term preservation.
Introduction
C
A biobank is a facility that processes, stores, archives, and distributes human samples and their associated clinical data, which are used to promote advances in biomedical research. Well-preserved frozen samples are ideal for evaluating the genome, the transcriptome, the proteome, and the metabolome.1–3 When the molecular analysis of nucleic acids, proteins, and metabolites is being conducted, the quality of the starting samples obtained from these repositories has to be taken into consideration, since factors such as degradation, the presence of impurities, and enzyme inhibitors may have a significant impact on the results obtained.4–9 Hence, it is necessary to ensure the adequacy of samples available for mass screening analysis used for current translational research. These rigorous demands, as well as the long-term storage of samples stored in biobanks, require the implementation of quality controls. These controls will depend on the type of sample stored.5–14
At present, there are many biobanks that conduct quality control processes, and there is some consensus on the specific type of quality control to be performed on each different sample. In this regard, for RNA and DNA samples, it is important to check their integrity and purity.1–4,6–12 For RNA samples, the ratio of absorbance at 260 nm and 280 nm is used to assess their purity. 15 To determine RNA sample integrity, two major ribosomal bands, 28s and 18s, should be observed in agarose gel or microchip electrophoresis. 16 In addition, the RNA integrity number (RIN) can be calculated, 1 and genes can be amplified by reverse transcriptase-quantitative polymerase chain reaction (RT-qPCR). 2 The purity of DNA samples is assessed in the same way as the RNA samples, 15 whereas its integrity can be obtained by observing the presence of a band of high molecular weight in agarose gels without degradation and verified by polymerase chain reaction (PCR) gene amplification. 1
For serum samples, specific biomarkers (i.e., transferrin receptor, ascorbic acid, K+, soluble CD40L, adrenocorticotrophic hormone, vascular endothelial growth factor, and the matrix metalloproteinase-7) 17 are particularly unstable and sensitive to preanalytical variations. The International Society for Biological and Environmental Repositories (ISBER) Biospecimen Science Working Group has recently published the panel of assays that can be used to assess such variation, for which there is a consensus. 18
Finally, to control human peripheral blood mononuclear cells (PBMCs) cryopreserved in dimethylsulfoxide (DMSO), cell viability is assessed after thawing,2,13 with viability values >80%.19,20 In addition, the HIV/AIDS Network Coordination (HANC) proposes the assessment of PBMC performance for quality control, that is, the number of PBMCs obtained per milliliter of collected blood. 21 In addition, granulocytes (CD15+), which contaminate PBMC isolates after prolonged blood storage, should not be present in the PBMC interphase. 22
The REDinREN (Spanish Renal Research Network) Biobank, founded in 2007, hosts a collection of samples designed for biomedical research of kidney disease, and it is organized as a technical unit with quality, order, and purpose criteria. Its mission is to contribute to the advancement of scientific knowledge of kidney failure and is affiliated with the Instituto de Salud Carlos III (RD6/0016/0002). Their activities are conducted in accordance with 14/2007 Law on Spanish Biomedical Research 23 and 1716/2011 Royal Decree, 24 as well as ISBER's Best Practice Guidelines. 4 Since its inception, this biobank has complied with other national laws, such as the Personal Data Protection Act 25 and the regulations for the transport of biological substances. 26
The achievements of REDinREN Biobank include its significant ongoing growth in the number and type of samples 27 received from all over Spain, the implementation of ISO 9001:2008 international standard, and the accreditation of its registration in the National Spanish Registry of Biobanks. The implementation of the ISO 9001:2008 standard has improved the efficiency of our biobank, by saving process execution time (by 70%), increasing the number of samples processed (by 200%), and implementing quality controls on the sample itself and of the processes carried out. 28 Specifically, we confirmed the improvement (by 25%) in the effective management of samples transferred to research centers, one of the main processes of our biobank, resulting in higher customer satisfaction. The large increase in the number of samples processed was directly related to the improvement of the process. 28
In this work, we present the result of quality control processes performed in accordance with the requirements of the above-mentioned standard, reporting the data resulting from the quality control of samples and processes. For the former, the samples analyses performed were as follows: DNA and RNA purity and the viability of PBMC cryopreserved in DMSO. For the latter, the process analyzed was the DNA isolation. The quality control results presented here permit us to assure that PBMC, DNA, and RNA samples stored and processed at our biobank can serve as suitable sources of material for biomedical research on kidney disease.
Materials and Methods
Ethical approval
The Biobank Project was approved by the Ethics Committee of Spanish Renal Research Network's Biobank (National Register Number 0000931). Informed consent was obtained in writing from all patients after institutional approval. The studies conformed to the standards set by the latest revision of The Code of Ethics of the World Medical Association (Declaration of Helsinki) for experiments involving humans.
Sample type and collection
The samples chosen for this work were selected from more than 76,500 stored in the REDinREN Biobank, obtained from 5450 patients with chronic kidney disease obtained from more than 70 services of Nephrology and dialysis centers from all over the Spanish territory. At present, the biobank holds samples of different types: serum, plasma, protein, urine, blood, DNA, RNA (preserved at −80°C), and viable PBMCs (cryopreserved at −190°C). Blood specimens were collected from renal patients into five different tubes (8 mL each), one EDTA tube for plasma, two EDTA tubes for PBMC isolation (for DNA and protein extraction and viable cryopreserved cells), one tube for serum, and one PAXgene tube (PAXgene Blood RNA Tubes; Qiagen, New Jersey) for total RNA extraction. 21
The specimens were collected by personnel trained at each participating center from the antecubital area of the arm by drawing venous blood using the sterile technique, transported in appropriate temperature conditions, at 4°C, in accordance with the present law, and delivered to the biobank in <24 hours, according to a programmed schedule with the participating center (maximum 10 patients at day). Once the samples arrive, the biobank staff starts to process them without delay. The range of delay between the sample extraction and their processing by the biobank was 2 to 24 hours.
Implementation of quality controls
The quality controls currently performed in the biobank are of two types.
Systematic
That is, measurement of number of viable PBMCs that were isolated from peripheral blood using Ficoll (n = 2724), and purity of nucleic acids (DNA n = 2328, RNA n = 78).
Ad-hoc
That is, viability of thawed PBMC (n = 10), extraction of DNA from three pools of PBMC to test the DNA extraction process reproducibility (n = 15), and the integrity and functionality of nucleic acids (DNA and RNA agarose gel n = 48, DNA β-globulin amplification n = 30, RNA RIN n = 96, DNA and RNA functionality n = 30).
These quality controls have been implemented on a routine basis (with established frequency) (Table 1).
PBMC, peripheral blood mononuclear cell; qPCR, quantitative polymerase chain reaction; QC, quality control; RIN, RNA integrity number; RT-qPCR, reverse transcriptase-qPCR.
Sample selection criteria
The sample selection criteria for ad-hoc quality controls were the following: (1) To analyze PBMC post-thawed viability, two selection criteria were used: samples must have been stored for at least 3 years and must have at least five cryovials stored from the same specimen. Two samples, each from a different year, were randomly selected for each analysis. This control has been performed semiannually, starting in 2013. (2) To prepare the three pools of PBMC, each one was made on a different day with cells from 12 patients with a surplus (once all relevant samples were stored, including five PBMC samples cryopreserved at −190°C) of at least 8 × 10⁶ cells to pool. (3) To analyze DNA integrity and functionality, the sample selection criterion used was a previous DNA extraction, with an A260/A280 ratio of 1.8–2.1. Six stored samples from different years, covering the 8-year collection period, were randomly selected for each analysis. (4) To analyze RNA integrity and functionality, the selection criterion used was a previous RNA extraction. Six samples for agarose gel and functionality and 12 samples for RIN were randomly selected for their respective analyses. Samples stored in different years, covering the 8-year collection period, were used for each test. For (1) to (4) the controls were performed every 4 months, starting in 2013 or 2014 (Table 1).
Table 1 summarizes, for each type of sample being tested, its implementation year, frequency, number of samples analyzed at each time, number of tests performed, and total number of samples tested so far in the Biobank of REDinREN.
The number of samples of each type was approved by AENOR (Spanish Association for Standardization and Certification: “Asociación Española de Normalización y Certificación”) in 2013, when the ISO 9001:2008 norm was certified, and in the first and second audit carried out in 2014 and 2015.
Evaluation of PBMC isolation and storage quality
PBMCs isolation and number of viable cells obtained
Whole blood (from the two tubes anticoagulated with EDTA) was diluted to 50% with sterile saline solution (phosphate buffered saline solution [PBS]' Thermo Fisher Scientific, Inc., Waltham, MA). Ten milliliters of diluted blood was layered over 20 mL of the Ficoll gradient (Lymphocyte Isolation Solution; Commercial Rafer, Zaragoza, Spain). Gradients were centrifuged at 400 g for 30 minutes at room temperature in a swinging-bucket rotor without the brake applied. The PBMC interface was carefully removed by pipetting. The isolated lymphocytes were washed in PBS by centrifugation at 200 g for 10 minutes, and the number of viable PBMCs obtained was evaluated in a systematic way. For this purpose, isolated lymphocytes were counted and their viability determined by Trypan Blue exclusion, using a Countess® Automated Cell Counter (Life Technologies Ltd., Paisley, United Kingdom), as previously described. 29 Cell pellet samples were aliquoted into six cryovials, each containing 4 × 10⁶ cells and stored at −80°C. Three samples were kept for automated DNA extraction and the other three were kept for protein extraction. Extractions are performed only when requested by a researcher.
When PBMCs viability exceeded 80%, all the remaining cells were cryopreserved in liquid nitrogen at −190°C (8 × 10⁶ cells per sample placed into a cryovial), in 20% fetal bovine serum (FBS) supplemented medium with 10% DMSO (Sigma Aldrich, St. Louis, MO). To freeze the samples, cryovials containing PBMCs were placed in a Mr. Frosty Freezing Container (Nalgene; Thermo Fisher Scientific, Inc.) filled with isopropanol precooled at 4°C, cooled slowly overnight to −80°C, and then transferred to liquid nitrogen.
Analysis of thawed PBMC viability
The PBMC samples stored at −190°C were thawed and cultured in 1640 RPMI medium (LONZA, Basel, Switzerland) supplemented with 10% FBS, L-glutamine (1 mM), penicillin (0.66 μg/mL), and streptomycin sulfate (60 μg/mL), at 37°C in 5% CO2 atmosphere. No proliferative stimulus was added to the medium. Cell viability was measured by Trypan Blue exclusion at the time of thawing (time 0) and every 24 hours during the following 14 days. Each measurement for each day was performed in triplicate.
Analysis of total DNA extraction and DNA purity, integrity, and functionality
DNA extraction, concentration, and purity
The total DNA of the samples requested by researchers was extracted from PBMC pellets stored at −80°C. Automated extraction was performed using the QIAamp DNA Mini kit (Qiagen) according to the manufacturer's standard protocol. DNA extraction was performed using a robotic workstation for automated purification of nucleic acid: QIAcube (Qiagen). DNA was quantified using a spectrophotometer (NanoPHotometer; Implen, Munich, Germany). DNA concentration was determined by measuring the absorbance at 260 nm. DNA purity was determined by the A260/A280 ratio, the A260/A280 ratio between 1.8 and 2.1 being considered acceptable. 3
DNA integrity
DNA integrity analysis by denaturing agarose gel electrophoresis on 1% was performed using the intact DNA untreated or treated with DNAse (27 Kunitz units, 15 minutes, 20–30°C) or denatured by heating (100°C, 15 minutes), as specific DNA degradation negative integrity controls. The integrity of DNA retrieved was also assessed by PCR amplification of four different amplicons of the housekeeping β-globulin gene (268, 536, 989, and 1327 base pair [bp]). The PCR amplification was performed using the DNA polymerase enzyme (Biotools, Madrid, Spain), with the primers shown in Table 2. The PCR conditions were initial denaturalization at 95°C for 3 minutes, followed by 40 denaturation cycles at 95°C for 1 minute, annealing at 55°C for 1 minute, 72°C extension for 1.5 minutes, and a final extension at 72°C for 5 minutes. The PCR products obtained were analyzed by gel electrophoresis on a 1% agarose gel. Gels were stained with RedSafe™, Nucleic Acid Staining Solution (20,000 × ; Promega, Madison, WI). DNA of acceptable quality had at least three bands of β-globulin amplified from DNA. 1
bp, base pair.
DNA functionality by qPCR
Endogenous β-actin and GAPDH genes were amplified by qPCR with LC FastStart DNA Master SYBR Green I Kit (Roche, Mannhein, Germany), in direct DNA (250 ng in each reaction, carried out in triplicate) samples. The pairs of primers used were human GAPDH: 5′-TCC ACT GGC GTC TTC ACC-3′ (forward) and human GAPDH: 5′-GGC AGA GAT GAC CCT TTT-3′ (reverse); human β-actin: 5′-TCA CCC ACA CTG TGC CCA TCT ACG A-3′ (forward) and human β-actin: 5′-CAG CGG AAC CGC TCA TTG CCA ATG G-3′ (reverse). qPCR was performed using the 7500 Fast real-time PCR System and 7500 Fast sequence detection software v1.3.1 (Applied Biosystems, CA) with the following cycling conditions: 50°C for 2 minutes and 95°C for 10 minutes, followed by 45 cycles of 95°C for 15 seconds, and 60°C for 1 minutes.
Analysis of total RNA extraction and RNA purity, integrity, and functionality
RNA extraction, concentration, and purity
Total RNA extraction was conducted using peripheral blood samples stored in PAXgene tubes (PAXgene Blood RNA Tubes; Qiagen), collected from each participating center. At the biobank, automated extraction was performed using the PAXgene® Blood RNA Kit (Qiagen), according to the manufacturer's instructions. RNA extraction was performed using a robotic workstation for automated purification of nucleic acid, QIAcube. RNA samples were preserved at −80°C. When samples were requested, RNA concentrations were systematically measured with a spectrophotometer (NanoPHotometer; Implen). RNA purity was also systematically determined by measuring the A260/A280 ratio.
RNA integrity
The RNA integrity was analyzed by determining the RIN, using the Agilent 2100 Bioanalyzer (Agilent Technologies, Santa Clara, CA), in the Department of Genomics of the PCM Foundation, Universidad Autonoma de Madrid, Spain. The RIN is an algorithm based on a selection of features resulting from data obtained from an electropherogram of a given sample. 30 RIN values are indicative of RNA quality, with RIN 1 denoting completely degraded RNA, and a RIN of 10 denoting completely intact RNA. A RIN 7 value is regarded as a threshold above which samples are suitable for most applications.1,30,31
RNA functionality by reverse transcriptase-quantitative polymerase chain reaction (RT-qPCR)
cDNA was obtained from RNA (2 μg) by using the High Capacity cDNA Reverse Transcription Kit. Then, endogenous β-actin and GAPDH genes were amplified by qPCR in cDNA (250 ng in each reaction, carried out in triplicate), as described for DNA, using the same probes. As a sample selection criterion, RNA had been previously extracted and the sample number and collection period were the same as for DNA.
Quality control of the DNA extraction process
After isolation, the selected PBMC samples were pooled, stored in cryovials (4 × 10⁶ cells), and frozen at −80°C until their use. DNA concentration and purity analysis on the three different PBMC pools was conducted each 4 months as described and the coefficients of variation (CV), calculated as CV = (standard deviation [SD]/mean) × 100, obtained from the different measures performed on the same pool.
Statistical methods
Descriptive statistics were used to show the data concerning the different distribution values. The normality of the distributions was tested by the Kolmogorov–Smirnov test. For normal distributions, to compare the delay in processing time values for the PBMC yields and the DNA ratios, the Student's paired t-test was performed. For normal distributions, to compare the differences among the time of storage of the samples, ANOVA was used with no additional tests. The normal distributions are represented as mean ± SD. For non-normal distributions, assigning statistical significance to the differences between the storage times and the delay to processing times, the Kruskal–Wallis test or Mann–Whitney U test was used. The non-normal distributions were represented as median plus an interquartile range (IQR). Statistical significance was set at p < 0.05.
Results
Quality control of viable PBMC isolation
PBMC isolation was evaluated by examining the number of viable cells obtained per milliliter of whole blood. The mean of viable PBMC obtained remained stable without significant differences from year 2010 to 2015 (p = 0.3637) (Fig. 1). The mean total number of viable cells isolated was 3.17 ± 1.12 × 10⁶ PBMC/mL of blood from 2724 specimens analyzed, which were the ones admitted to the biobank in those years (year 2010 [n = 181], 2011 [n = 868], 2012 [n = 902], 2013 [n = 359], 2014 [n = 255], and 2015 [n = 159]). Moreover, although the viable PBMC mean number obtained in samples with <4 hours precentrifugation delay was higher when compared to the 24 hours delay group, the difference was not statistically significant (mean 4 hours: 3.36 ± 1.12, n = 523; mean 24 hours: 3.01 ± 1.18, n = 2201. p = 0.469, t-test).

Quality of peripheral blood mononuclear cells (PBMCs) isolation from peripheral blood. Analysis of the performance of the PBMC isolation technique expressed as the number of viable cells obtained per milliliter of whole blood, associated with their year of isolation. Total number of specimens processed: 2724. Plots represent the mean ± standard deviation (SD) values for each year.
Quality control of recovery and viability of PBMCs stored at −190°C
Figure 2 represents the viability of the 10 thawed samples. As shown on day 0, the viability was 96.5% (IQR 94.75–97.25), which indicates that the freezing process did not affect cell viability. Values above the horizontal line, which indicate a cell viability of 80%, minimum acceptable viability threshold, were recorded from days 1 to 14. At the 14th day, viability was observed to decline to 80%. The median percentage of postcryopreservation viable cells recovered from these 10 samples of PBMC was 84.5% (IQR 78.4–100.0). When we evaluated the percentage of PBMCs that were still viable after 14 days in culture and compared it between aliquots of PBMCs that had been in storage for the longest period of time (years 2007–2009; 85%, IQR 83–87.5) and the shortest period of time (years 2010–2012; 83%, IQR 80.5–83), the difference fell just short of being statistically significant (p = 0.056, Mann–Whitney U test). This analysis indicates that long-term storage time may not affect the cryopreserved PBMC viability. In addition, the percentage of live cells after 14 days post-thawing was not significantly different between the samples that were collected and processed with a delay of <4 hours and those of <24 hours (p = 0.383, Mann–Whitney U test).

Viability of PBMCs cryopreserved in 10% dimethylsulfoxide (DMSO). Viability of cells thawed and cultured for 14 days, measured by Trypan Blue exclusion test from day 0 (thawing day) to day 14. The % of live cells from 10 independently thawed samples was achieved. Dots represent individual values from all the samples studied. Bars represent the median and interquartile range (IQR) values for each day. The horizontal line represents 80% of cell viability.
Quality control of DNA samples stored at −80°C
To evaluate the quality of DNA samples, we analyzed three parameters: purity, integrity, and functionality, measured as gene amplification ability. Figure 3A shows the purity of the DNA isolated from 2328 samples analyzed, which are the total number extracted to date, grouped by year of storage. The mean A260/A280 ratio value was 2.05 ± 0.14, and the storage time is not affecting the DNA purity (p = 0.063). In addition, the mean DNA ratio was not significantly different between the samples, which were collected and processed with a delay of <4 hours and those of <24 hours (mean 4 hours: 2.025 ± 0.21, n = 498; mean 24 hours: 2.059 ± 0.18, n = 1830. p = 0.338, t-test). Figure 3B shows the DNA integrity in two representative samples of the 48 analyzed to date, indicated by the presence of a single high molecular weight band in the intact DNA (untreated), in comparison with negative controls after DNAse treatment and after being heated, with no band or a very diffuse band being observed in either of the latter two cases, as expected. We have found some partial degradation in the 4.2% of extracted DNA samples (2 of 48 samples), following electrophoresis (Fig. 3B, Sample 2). These data were completed with the PCR amplification of four β-globulin gene fragments. Figure 3C shows four amplified fragments of a representative sample of the 30 analyzed to date, with sizes ranging from 268 to 1327 bp, which correspond to high-quality DNA (without being fragmented). DNA of acceptable quality with at least three bands of β-globulin amplified was obtained in 26 of the 30 samples analyzed to date: (76.7% [n = 23] four bands; 10% [n = 3] three bands; 13.3% [n = 4], two bands). Finally, DNA-retrieved functionality was assessed by β-actin and GAPDH constitutive genes amplification by qPCR (Fig. 3D, E). The median Ct values (number of cycles required to reach the detection threshold) of the 30 samples studied to date were 19.75 (IQR 19.25–21.32) for β-actin and 22.37 (IQR 21.91–23.18) for GAPDH, which demonstrate that it can be used for genome analysis. As observed, storage time is not affecting DNA functionality (p = 0.239 for β-actin and p = 0.969 for GAPDH, Kruskal–Wallis test). In addition, the median Ct value was not significantly different between the samples that were collected and processed with a delay of <4 hours, and those of <24 hours (p = 0.440 for β-actin and p = 0.134 for GAPDH, Mann–Whitney U test).
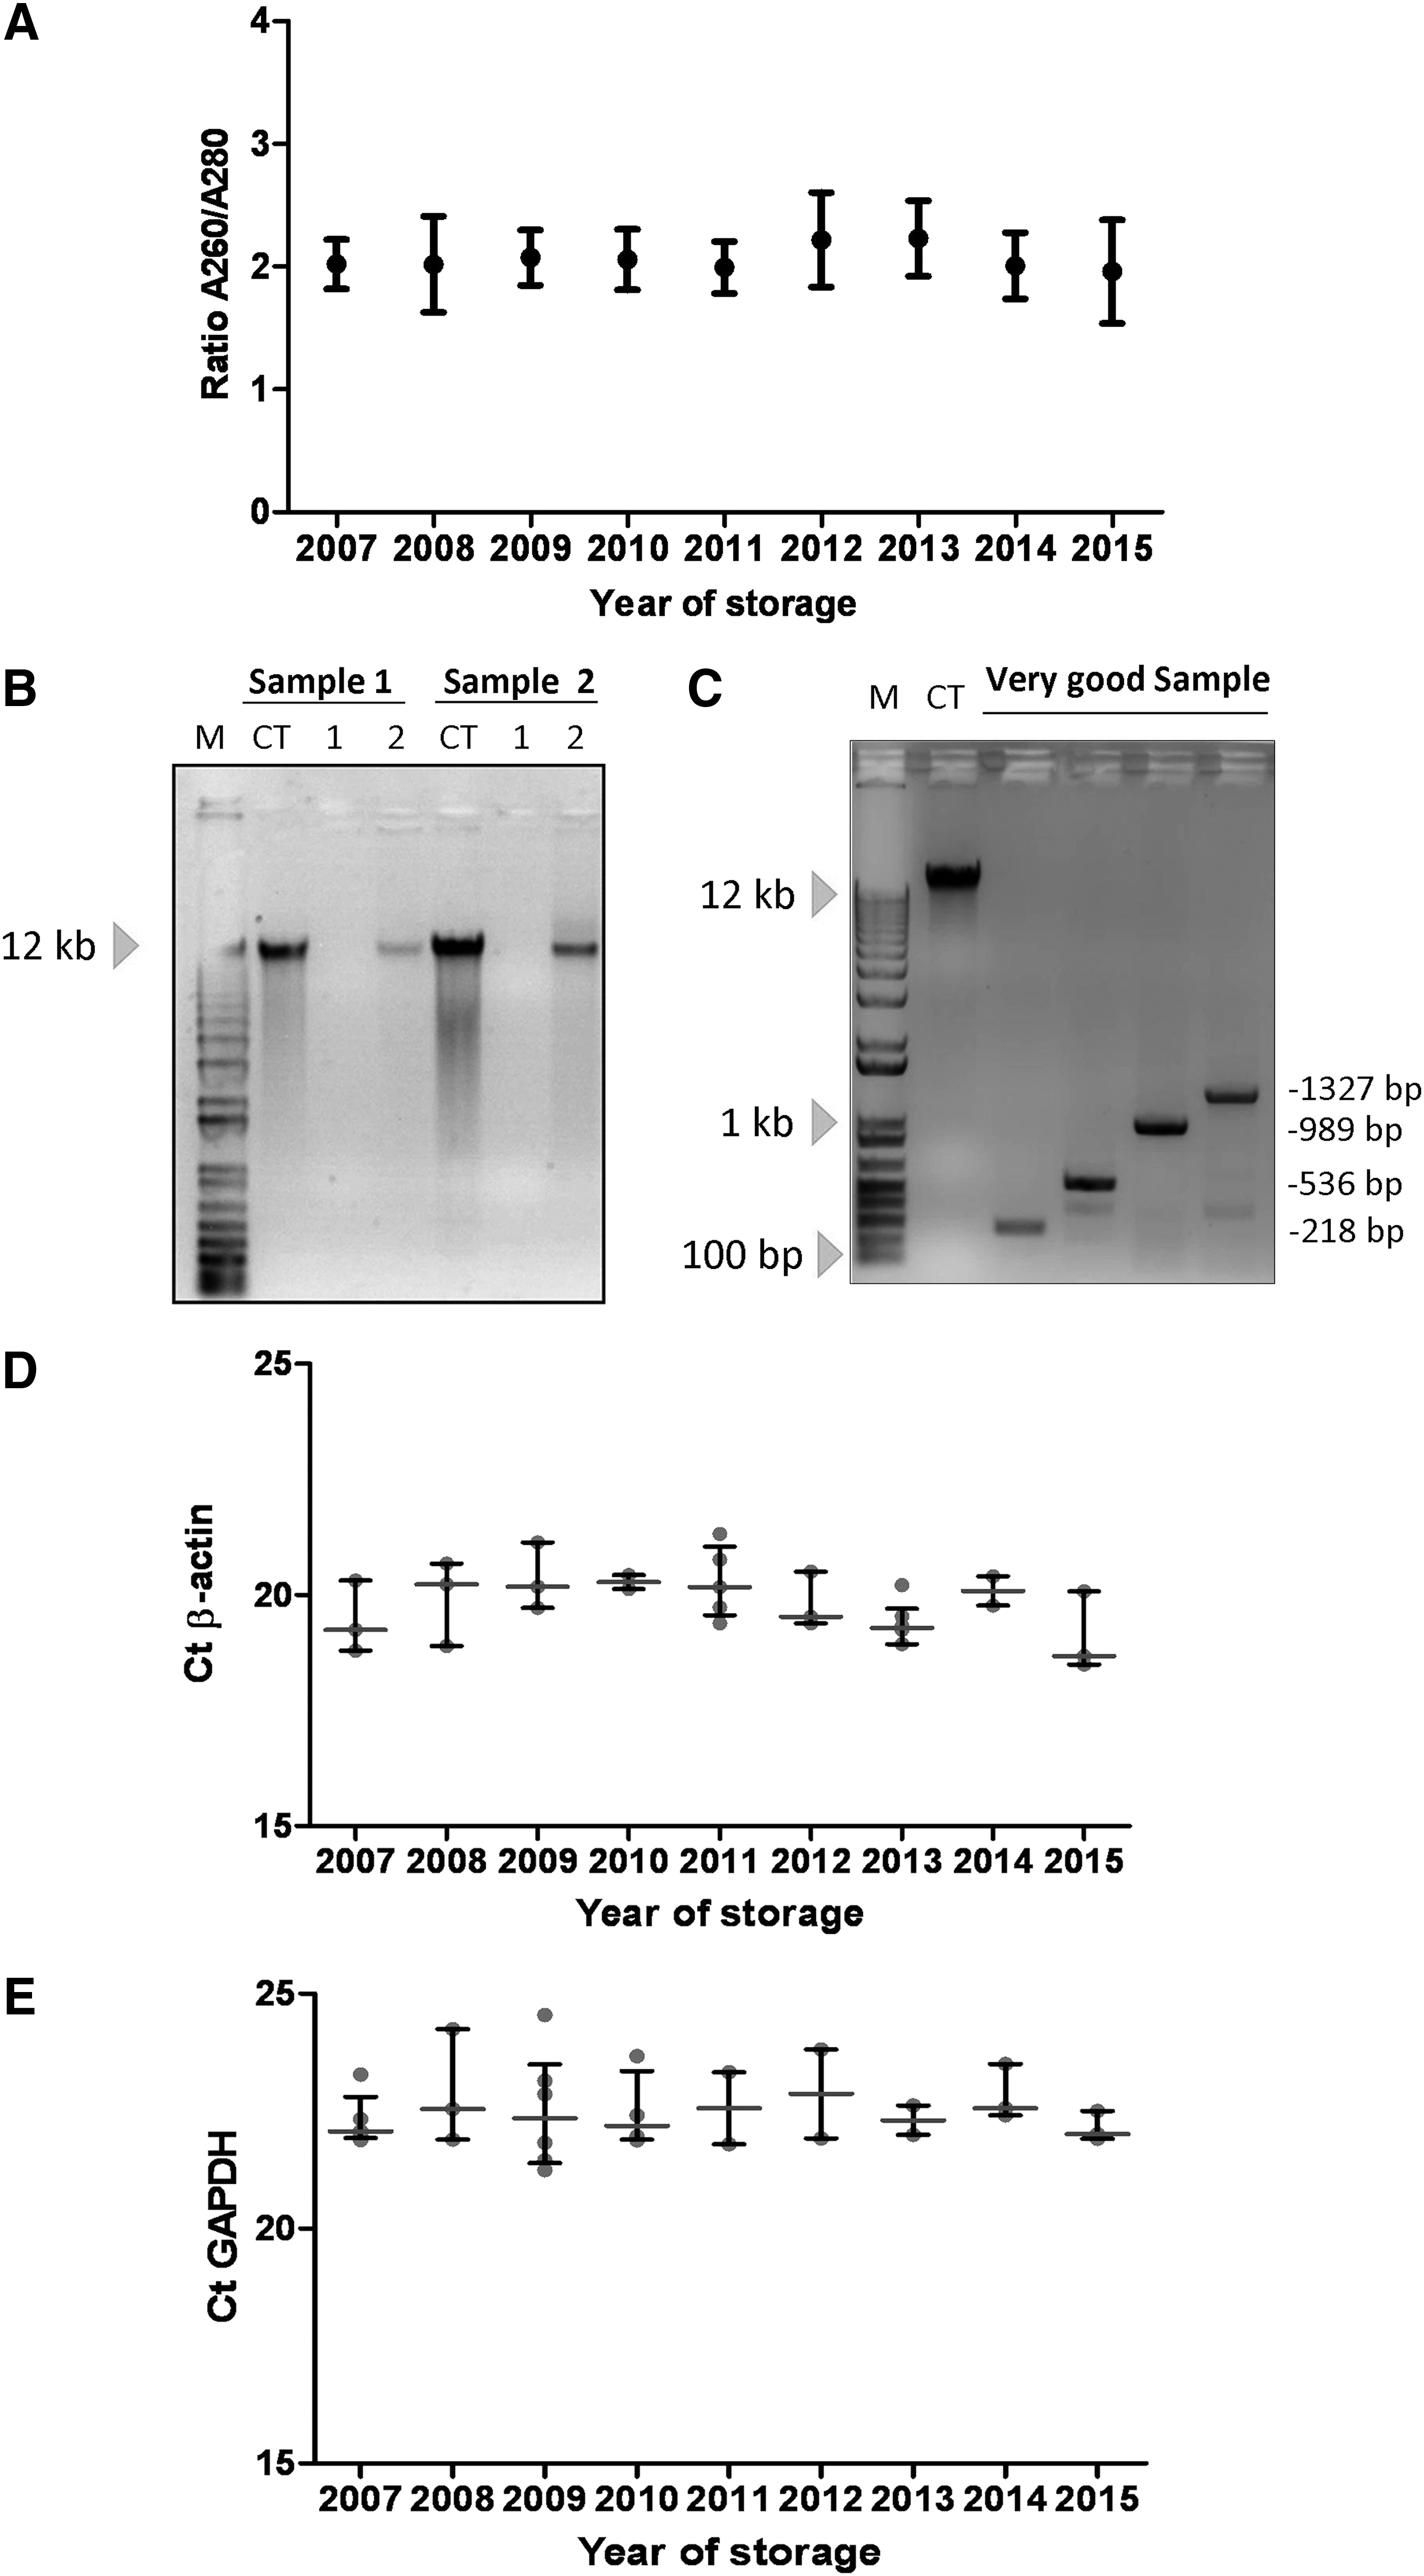
Quality of DNA isolated from PBMC by automated QIAcube (Qiagen) system.
Quality control of RNA samples stored at −80°C
The quality control of stored RNA samples was likewise performed by assessing the following parameters: purity, integrity, and amplification ability. Figure 4A shows the RNA purity of the 78 samples extracted to date, grouped by year of storage. The median A260/A280 ratio value was 2.04 (IQR 1.96–2.07) and, as observed, storage time did not affect RNA purity (p = 0.089, Kruskal–Wallis test). Moreover, the median RNA ratio was not significantly different between the samples, which were collected and processed with a delay of <4 hours and those of <24 hours (p = 0.374, Mann–Whitney U test). The RNA integrity was determined by the assessment of RIN.
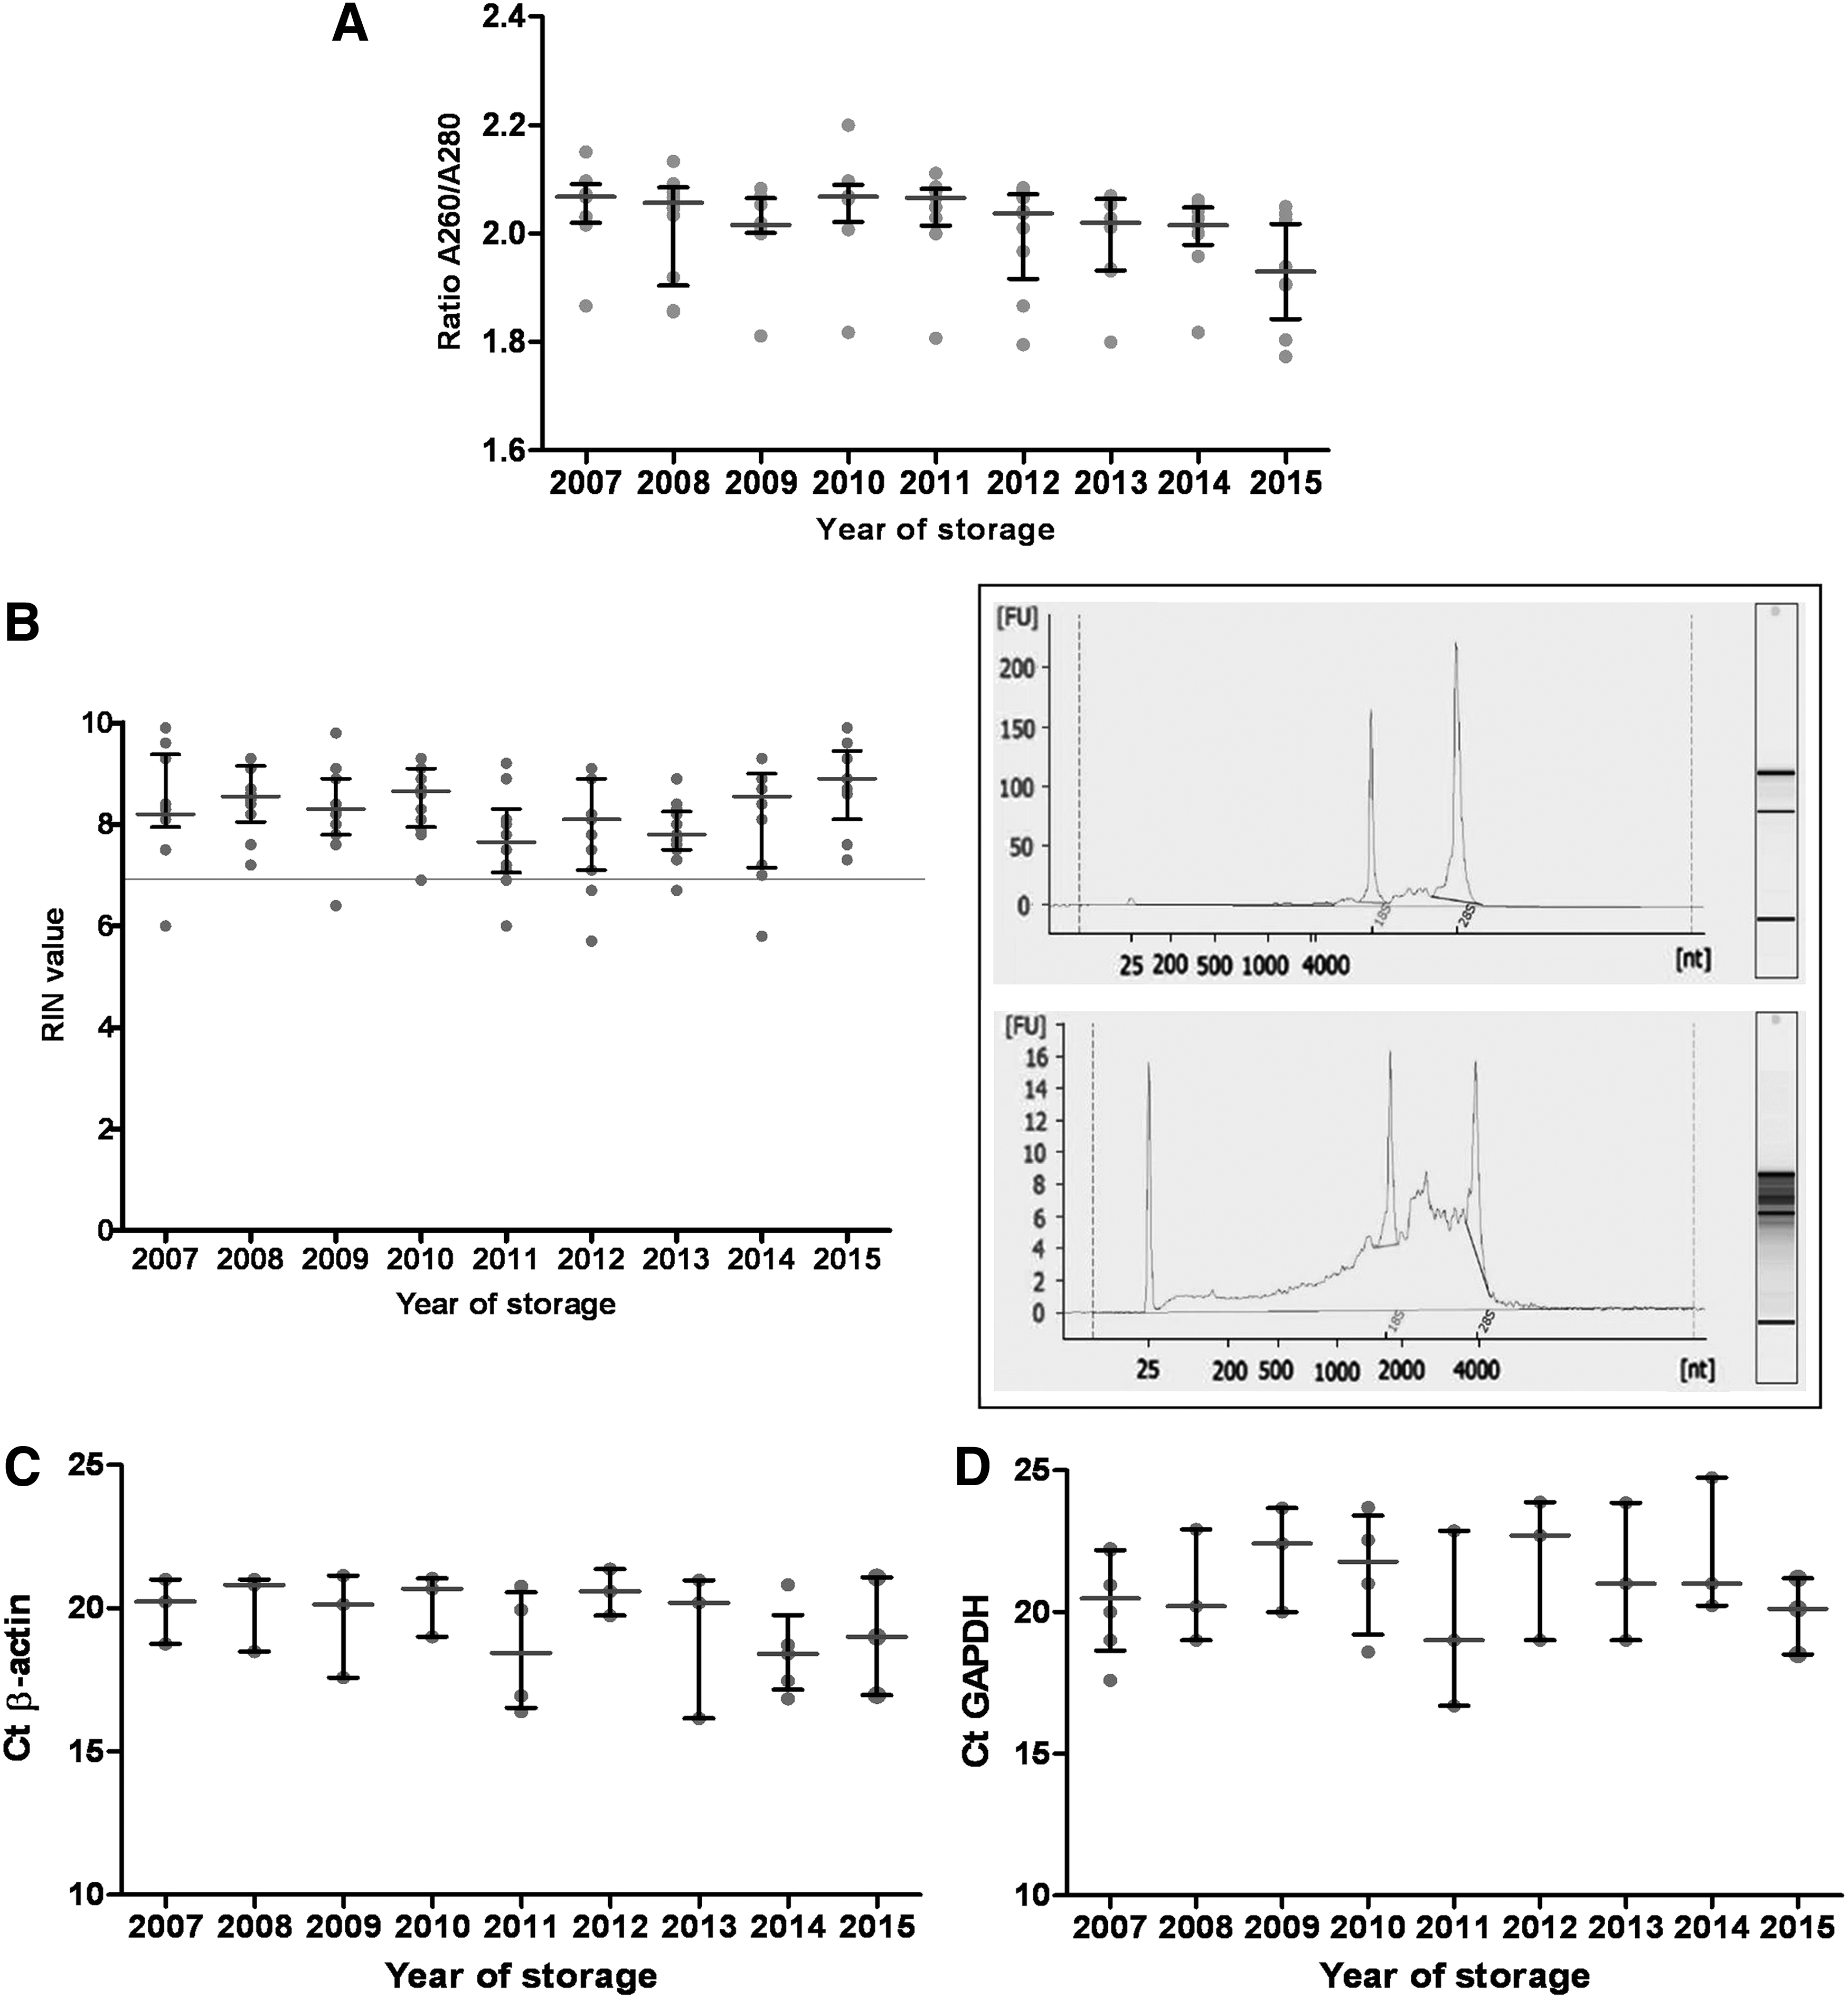
Quality of RNA isolated from peripheral blood by PAXgene system.
As shown in Figure 4B (left panel), the mean RIN value for 2007–2015 period was between 7.3 and 9.1 (8.19 ± 0.92), which demonstrates that long-term storage time is not affecting the integrity of stored RNA in the 96 samples analyzed to date (p = 0.092). Very good RIN numbers of ≥7 were obtained in 87 of 96 samples.
Finally, Figure 4C and D show β-actin and GAPDH constitutive genes amplified by RT-qPCR. The median RIN value was not significantly different between the samples processed with a delay of <4 hours and those of <24 hours (p = 0.079, Mann–Whitney U test). The median Ct values of the 30 samples studied to date were 20.04 (IQR 18.2–20.86) for β-actin and 21.0 (IQR 19.0–22.71) for GAPDH. These results confirm that these samples can be used for gene expression analysis. Moreover, it can be observed that storage time does affect RNA functionality (p = 0.639 for β-actin and p = 0.773 for GAPDH, Kruskal–Wallis test). Finally, the median Ct value was not significantly different between the samples, which were collected and processed with a delay of <4 hours and those of <24 hours (p = 0.477 for β-actin and P = 0.373 for GAPDH, Mann–Whitney U test).
Quality control of DNA isolation processes
Finally, we performed the quality control of one of the most widely used processes, which is routinely carried out in the biobank. We assessed DNA isolation process by using three PBMC pools. Table 3 shows the mean concentration and purity values of the different measures performed to the same pool, and the CV of the measurements obtained, which demonstrate the reproducibility of the process. The low CV for the ratio, especially as an indicator of the purity of DNA retrieved, are particularly notable.
The table shows the mean ± SD values and coefficients of variation (CV) = (SD/mean) × 100 of DNA concentration and the A260/A280 ratios, which were measured five times to date, from three different pools of PBMC, in accordance with our usual Protocol.
SD, standard deviation.
Discussion
The aim of the present study was to determine and to present the results of the quality control processes performed on the PBMC, DNA, and RNA samples stored in the REDinREN Biobank, implemented according to ISO 9001:2008 standard, including quality controls of samples and processes. The results indicate that samples obtained and preserved in this biobank have the suitable quality and reproducibility to be used in biomedical research, using both classic analytic methodology and new high-performance technology.
First, the high number of viable PBMC obtained largely depends on the effective isolation from whole blood samples using the Ficoll method. 29 The results of PBMC isolation carried out at this biobank indicate an excellent quality, unaffected by the year when the process was performed or the number of samples processed.
Moreover, the quality control of cryopreserved cells yields good levels of PBMC post-thaw viability, which guarantees that the freezing, cryopreservation, and thawing process is being developed in a correct way. Efficient cryopreservation of cells offers many advantages to the research community. 32 This technique makes it possible that samples from the same donor banked over time can be processed simultaneously, allowing greater inter- and intralaboratory control and reducing costs. It was previously shown that the viability of cryopreserved PBMCs has tremendous effects on the results of functional assays, 32 so that at least 80% viability is necessary to generate conclusive responses to antigens and mitogens. These PBMC can also be efficiently used for immunomagnetic separation of cells, cytokine production, and flow cytometer analysis.33,34
The limit of the length of time a PBMC sample can be stored in a biobank has not yet been determined, although numerous quality control studies have approached this analysis using different types of samples.13,19 In this study, samples are chosen at random from different years of storage. When we compared the percentage of PBMCs that were still viable after 14 days in culture, the analysis indicates that long-term storage may not affect the PBMC viability. We observed slightly higher viability values of the PBMCs that had been stored for a longer period of time. The almost statistically significant difference may be caused by the increased number of samples processed (deposited or transferred) during the more recent years studied. Due to the low number of samples analyzed, this result could be confirmed with a larger set of samples. We have now improved the process, protocols, and staff training, with the changes that we implemented during achievement of the ISO 9001:2008 standard. These observations are of special importance for the long-term future of the REDinREN Biobank since one of its objectives is to utilize biospecimens associated with clinical data to design and perform prospective studies.
Moreover, it has been shown that time from venipuncture to PBMC isolation and cryopreservation may affect the cell quantity, recovery, viability, white blood cells subpopulation distribution, gene expression, and lymphoblastoid cell lines transformation 35 and also have impact on the viability and performance of T cells in downstream immunological assays36,37 and in the cytotoxic activity of natural killer cells. 38 In addition, it has also been shown that a 24-h delay between blood collection and processing, especially at 4°C, significantly increases granulocyte contamination, which may inhibit T-cell function. 22 Due to these findings, some authors recommend the processing of blood samples for PBMC isolation within shorter time periods (e.g., 8 hours).22,35–40 At that time, our biobank was not able to assess potential granulocyte contamination of the PBMC isolates. However, in the present study, we analyzed samples from a wide range of processing delay (i.e., 2–24 hours) and we statistically compared the results between samples processed within <4 or <24 hours of collection. Although the number of viable PBMC obtained in samples with <4 hours precentrifugation delay was higher when compared to the 24 hours delay group, the difference was not statistically significant. Likewise, statistical significance could not be assigned to any other comparisons we made between the two delay to processing cohorts. Due to the relatively low number of samples analyzed, this result may be confirmed on a future larger set of samples and further studies may address the optimization of biospecimen processing methods to obtain high cell yields, the adequate subpopulation composition, and improved cell viability for downstream applications in our stored samples.
With regard to the analysis of samples of nucleic acids (DNA and RNA), the values obtained for the A260/A280 ratios indicate that both materials have an acceptable degree of purity, suitable for most applications.8,9,41 The absorbance A260/A280 ratios of most samples ranged between 1.8 and 2.1, which indicate that both nucleic acids obtained reached high purity levels. In addition, DNA and RNA A260/A280 ratio values did not show a significant difference related to stored year, which confirms that long storage time does not affect their quality.
Indeed, the vast majority of the samples analyzed presented good ratios, within normal values,42,43 with a small percentage of samples (9.4% for DNA and 6.1% for RNA) deviating from the acceptable range. In the case of DNA analysis, the normal range of the A260/A280 ratio is between 1.8 and 2.1. A ratio higher than 1.8 is generally accepted as an indicator of pure nucleic acids, whereas ratios lower than 1.8 may indicate contamination by proteins or other contaminants that absorb at or near 280 nm, or may also be due to the effect of several solvents used during the extraction of nucleic acids.3,42 In contrast, coeluting RNA can become a “contaminant” of unknown magnitude in a DNA extraction, leading to an overestimation of DNA yield. 44 An alternative solution could be to use spectrofluorometry (in addition to spectrophotometry) to quantify the nucleotides routinely. In our protocol, we decided to not include RNase digestion, because we did not want to contaminate either our laboratory or the QIAcube. For this reason, the data presented here are estimates of the DNA concentration. In addition, contamination of DNA samples with RNA does not impair subsequent use in the majority of downstream applications. However, the use of DNase digestion is mandatory in the case of RNA extraction to prevent erroneous amplifications. In RNA analysis, an A260/A280 ratio higher than 1.8 is usually accepted as an indicator of a pure RNA, relatively free of proteins. 43 We have not been able to identify the cause of the unacceptable purity values observed in the samples mentioned above; however, they are within the expectable margin of error when handling or transporting samples. In addition, we have implemented corrective actions for these nonconforming results (Table 4), which allowed a 10% reduction in the DNA or RNA samples deviated from the acceptable range.
The absorbance readings give no indication related to the physical integrity (lack of fragmentation) of the sample. A traditional method that can be used to assess nucleic acids integrity is agarose gel electrophoresis.42,45 In our results, the intact genomic DNA appears as a compact high molecular weight band with no or little low molecular weight material.
In addition, taking into account that the RNA is the most easily degradable component among biological samples, among other reasons, due to endogenous ribonucleases, 46 we assessed its integrity by calculating the RIN. 31 In our study, only 9 of the 96 samples analyzed presented RIN values of <7, for which we have implemented corrective actions (Table 4).
Our results do not show a decrease in RIN values with increasing storage time of the specimens in the biobank. Several studies have examined the RIN variation associated with storage time. In 2012, Bao et al. studied RNA from tissues collected over a 40-month period and obtained RIN values higher than seven for all the sample analyses. 47 Recently, Hebels et al. assessed RIN values in blood samples stored during a 4–19-year period at −80°C in Sweden, and during an 11–19-year period in liquid nitrogen in Italy, and found no observable systematic adverse effects of storage time. 48 In 2013, Andreasson et al. analyzed RNA from 153 endocrine tissue samples stored for over almost three decades; the results suggest that RNA quality from tissues is not adversely affected by storage in well-monitored and maintained −80°C freezers, which are capable of excellent preservation of high-quality RNA for decades. These findings challenge the arguments that claim that using liquid nitrogen for storage is always better and support the idea that −80°C freezers are equally suitable for long-term preservation of tissue samples, with additional benefits resulting from avoidance of environmental hazards. 11 In the REDinREN Biobank, where RNA is preserved in freezers at −80°C, the RIN number of samples stored is routinely assessed to ensure that the standards of quality required for stored material are uniform throughout the time.
The utility of DNA or RNA retrieved from tissues for subsequent molecular applications can also be assessed by PCR amplification of a specific sequence. Nucleic acids with little or no PCR or RT-qPCR product indicate tissue degradation and poor quality. 6 Our results showed acceptable Ct values, which are a good indicator of the suitability of the material for subsequent use in biomedical research. 35
The quality control of the processes was also studied. The automated DNA extraction demonstrated the reproducibility and reliability of the standardized protocols and manipulations performed. The coefficient of variation obtained for A260/A280 ratio was very low, which is significant as this is indicative of the consistent purity of the DNA retrieved. Low CV of DNA concentration also ensure intra-assay reproducibility of this method.
Up to the present, we have not performed either systematic or routine quality controls of plasma and serum samples stored in our biobank. So far, the scientific community has not reached a consensus on how to identify the best biomarkers to determine plasma and serum quality. The main problem is that it has not been possible to perform a specific test in a prospective way because the quality of plasma and serum is strongly linked to the research program. In this sense, biobanks, including our REDinREN Biobank, are a valuable tool, because they have competence to develop their own research, which enables them to optimize processes and identify detection biomarkers to ensure the quality of all sample types. In addition, nine peer-reviewed publications have resulted from samples in our biobank, which demonstrate that the samples are of quality that is amenable to downstream research.49–57
Finally, it should be noted that, taking into account the special features of the REDinREN Biobank, which contains samples from throughout Spain that must be transported to our center before being processed, our results support the idea that the construction of large sample cohorts from multiple centers can be carried out as long as strict controls are implemented for sample collection, transportation, reception, and processing. Table 5 summarizes the difficulties related to multisite sample collection and the solutions implemented in REDinREN so as to better coordinate the process and the training of health technical personnel and to closely supervise all the partners involved in sample collection and delivery, including the establishment and implementation of common technical instructions. These results have a special relevance, taking into account that there are currently very few studies reporting on quality controls on specimens coming from different centers.
All samples were shipped to a central site using common technical instructions.
Supplementary Figure S1 (Supplementary Data are available online at www.liebertpub.com/bio) summarizes the role of the REDinREN Biobank Quality Management System to monitor, assess, and identify the customer's requirements, to analyze conforming or nonconforming results, and to implement corrective or improvement actions.
Conclusion
Typically, the collection of significant numbers of human biological samples and associated quality information involves a major effort in planning, construction, and finally operation, which consumes a significant amount of time and slows down the development of experimental research. Hence, the promotion and implementation of biobanks, which facilitate the researcher's access to quality samples (and associated data) with the proper ethical and legal safeguards for the donor, represent a major advance in shortening the time that normally elapses between research and the application of its results and in improving the effectiveness of research. The appropriate controls that ensure the quality of the samples offered and their adequate long-term preservation in repositories are crucial. Maintenance and improvement of quality control are part of the REDinREN Biobank's policy of ongoing improvement.
The results presented in this study show that PBMC, DNA, and RNA samples stored at the REDinREN Biobank meet the necessary quality standards to be used in current biomedical research and that the methodology used complies with the requirements to ensure the long-term preservation of the specimens.
Footnotes
Acknowledgments
This study was supported by grant Renal Research Network: FEDER funds ISCIII RETIC REDINREN RD12/0021/0006, by a grant from Fondo de Investigaciones Sanitarias (FIS/ISCIII PI11/01630 and PI14/02075) to DRP and (FIS/ISCIII PI14/01939) to M.R.-P., by a grant from Universidad de Alcalá (CCG2015/BIO-034) to L.C.-B. and by Instituto de Investigaciones Sanitarias Reina Sofía (IRSIN) and Fundación Renal Iñigo Álvarez de Toledo (FRIAT).
We thank the Vice-Dean of Research at Alcala University, Dr. María Luisa Marina Alegre, for facilitating the administrative work of the BioBank.
Author Disclosure Statement
No conflicting financial interests exist.
References
Supplementary Material
Please find the following supplemental material available below.
For Open Access articles published under a Creative Commons License, all supplemental material carries the same license as the article it is associated with.
For non-Open Access articles published, all supplemental material carries a non-exclusive license, and permission requests for re-use of supplemental material or any part of supplemental material shall be sent directly to the copyright owner as specified in the copyright notice associated with the article.