
Abstract
Methodology:
We determined the content of amide I, amide III, PO4, CO3, and CH2 in samples of fresh bone, bone frozen at −80°C thawed once, bone after two freeze–thaw cycles, and chemically cleaned bone chips. A total of 750 Raman spectra were collected per sample group and the derived quantitative values compared statistically by one-way ANOVA.
Results:
We found statistically significant differences between the investigated sample groups differing in their treatment already after one freeze–thaw cycle and as well after multiple freeze–thaw cycles, and/or chemical cleaning. Chemical cleaning decreased the content of all measured components compared to the fresh sample as detected by Raman spectroscopy. We further used the derived data to calculate the mineral to matrix ratios for each sample group.
Discussion:
Our data indicate that significant changes of the chemical quality and mineral to matrix ratio occur during freeze–thawing and chemical cleaning. At the same time, this study highlights the importance of sampling and testing at multiple locations for reliable predictions of the chemical composition. We think that it is very desirable to test the quality of bone graft material before transfer to a recipient; this might ultimately help define parameters to choose the best graft for the patient. It is also important to highlight that this is a preliminary study, which shows the importance of detecting changes in the chemical quality of bone grafts before transfer to the patient.
Introduction
H
Usually, bone grafts are obtained during surgery and the material is subsequently sterilized6–8 and stored at −80°C for up to 5 years. Bone banks routinely test graft material for the presence of infectious agents, limiting the risk of infection for the recipient. Governmental guidelines have been established and are strictly followed for quality controls regarding contamination and the presence of transmittable diseases. We believe it is also important to conduct a quality test to measure the content of typical bone compounds (amide I, amide III, PO4, CO3, and CH2) in the bone graft material. This will provide significant information regarding the potential biological activity of the bone graft samples. We think that performing this chemical–structural test of the graft material could help to classify and select high-quality bone grafts and thereby accelerate the healing process for the patient.
Raman spectroscopy is a nondestructive, label-free, and rapid technique to provide information on the composition of an unknown sample. 9 It relies on inelastic scattering of monochromatic laser light interacting with molecular vibrations or other excitations in the system, which results in an energy shift of the laser photons. This shift in energy gives information about the vibrational modes of the substances and consequently the components in the system. By that means it can, for example, provide insight into the mineralization of the investigated material. Raman spectroscopy requires only a small sample volume with minimal sample preparation. It is therefore a valuable tool to investigate sensitive specimens of low quantity where rapid generation of results is mandatory.
In this study, we compared the amount of matrix and mineral composition of human bone graft material in fresh, frozen, twice frozen, and chemically cleaned samples using Raman spectroscopy. These steps follow a graft material starting from the donor and controlling all necessary steps, including accidental thawing (e.g., caused by failure of the storage freezer unit) until the final step to the recipient. We thereby evaluate the use of Raman spectroscopy to be used as a new test for biochemical characterization of bone grafts, which could be routinely used by bone banks. Ultimately, performing such a test could help quantify quality parameters for bone graft material used in the clinical setting. Determining those factors in each graft could help to choose a perfect graft material for the patient and improve the healing process and thus the overall quality of the surgery experience.
Materials and Methods
Preparation of bone chips
A femoral head was obtained from a female patient who had undergone total hip replacement surgery at the Department of Orthopedics at the Innsbruck Medical University. The patient had approved the use of the samples for research purposes.
To prevent damage, the bone was flushed and cooled with 0.9% saline during osteotomy. Cartilage and cortical tissues were removed from the femoral heads with a bone saw. Bone chips (BCh; 3–5 mm diameter) were generated from the remaining spongious tissue using a bone mill (Noviumagus Bone Mill; Spierings Meische Techniek BV, Nijmegen, The Netherlands).
Sample generation
BCh were divided into four groups containing 1 g each as follows: fresh bones (F); fresh bones frozen at −80°C for 4 weeks and thawed under the microscope (FC1); fresh bones frozen at −80°C for 2 weeks, thawed at room temperature for 24 hours, and then again frozen for 2 weeks (FC2); and fresh bones frozen at −80°C and then chemically cleaned (FC1-C) as described by Coraca-Huber et al. 10 Briefly, samples were sonicated in an ultrasound water bath (40 kHz, Bandelin BactoSonic; Bandelin Electronics, Berlin, Germany) in Triton X-100 for 30 minutes at 45°C. Subsequently, samples were washed twice by sonication in distilled water and then bleached in 3% hydrogen peroxide for 1 hour. After consecutive washing steps using distilled water, samples were incubated with 70% ethanol and again sonicated for 1 hour. Finally, bone chips were washed with distilled water and stored at 4°C until use.
Raman measurements
Confocal scanning Raman spectroscopy was used to investigate the composition of bone graft samples by measuring and comparing the relative peak intensities of the Raman spectra, which provide information about the mineral-to-matrix-ratio of the bone sample. Small pieces of bone grafts were placed on a glass object slide and fixed on a motorized microscope stage. Due to the irregular topography of the specimen, and to obtain the highest possible collection efficiency, a 10× microscope objective (air, Zeiss) with low NA (0.2) was used. The imaging system used was a commercial confocal Raman microscope (alpha 300; WITec, Ulm, Germany) and the associated software was used for background subtraction and for statistical processing of the measured spectra.
Three distinct bone chips were scanned from each of the differently treated bone grafts using a laser operating at a wavelength of 785 nm and a power of 80 mW. Five series of 20-μm-long line scans within an area of 3 mm2 were performed to investigate each bone graft; 50 measured spectra (each point accumulated over 10 iterations) along one line scan led to a total of 750 single spectra, over which averaging was carried out for each bone graft material. The peaks and their corresponding regions for the chemical constituents of interest lie in regions with the following Raman shift wavenumbers:
amide I: 1541.2–1716.3 cm−1
amide III: 1214.4–1298.1 cm−1
PO4: 925.7–981.9 cm−1
CO3: 1052.1–1087.9 cm−1
CH2: 1446–1455 cm−1
Statistical analysis
All derived data were compared using a one-way ANOVA followed by a Bonferroni correction to calculate significant differences between each column of values. Differences between the three distinct bone chip samples of each group were compared using one-way ANOVA followed by a Bonferroni correction. Data were prepared in GraphPad Prism 5 software.
Results
For each sample group, a total of 750 Raman spectra were collected and the content of amide I, amide III, PO4, CO3, and CH2 was determined. All values are reported in arbitrary units (a.u.) in Table 1 and are presented in Figure 1.

Chemical composition of bone chips as determined by Raman spectroscopy.
F, fresh bones; FC1, fresh bones frozen; FC2, twice thawed bones; FC1-C, frozen bones cleaned chemically; SD, standard deviation.
Values are given as au, mean values of 750 calculations ± standard deviation are depicted.
Statistically significant differences (p < 0.0001) were calculated between the groups by ANOVA for each component.
Mineral to matrix ratios for PO4 and CO3 against amides I and III from all four groups were compared by calculation from each Raman spectrum. Mean values are shown in Table 2 below and are presented in Figure 2.
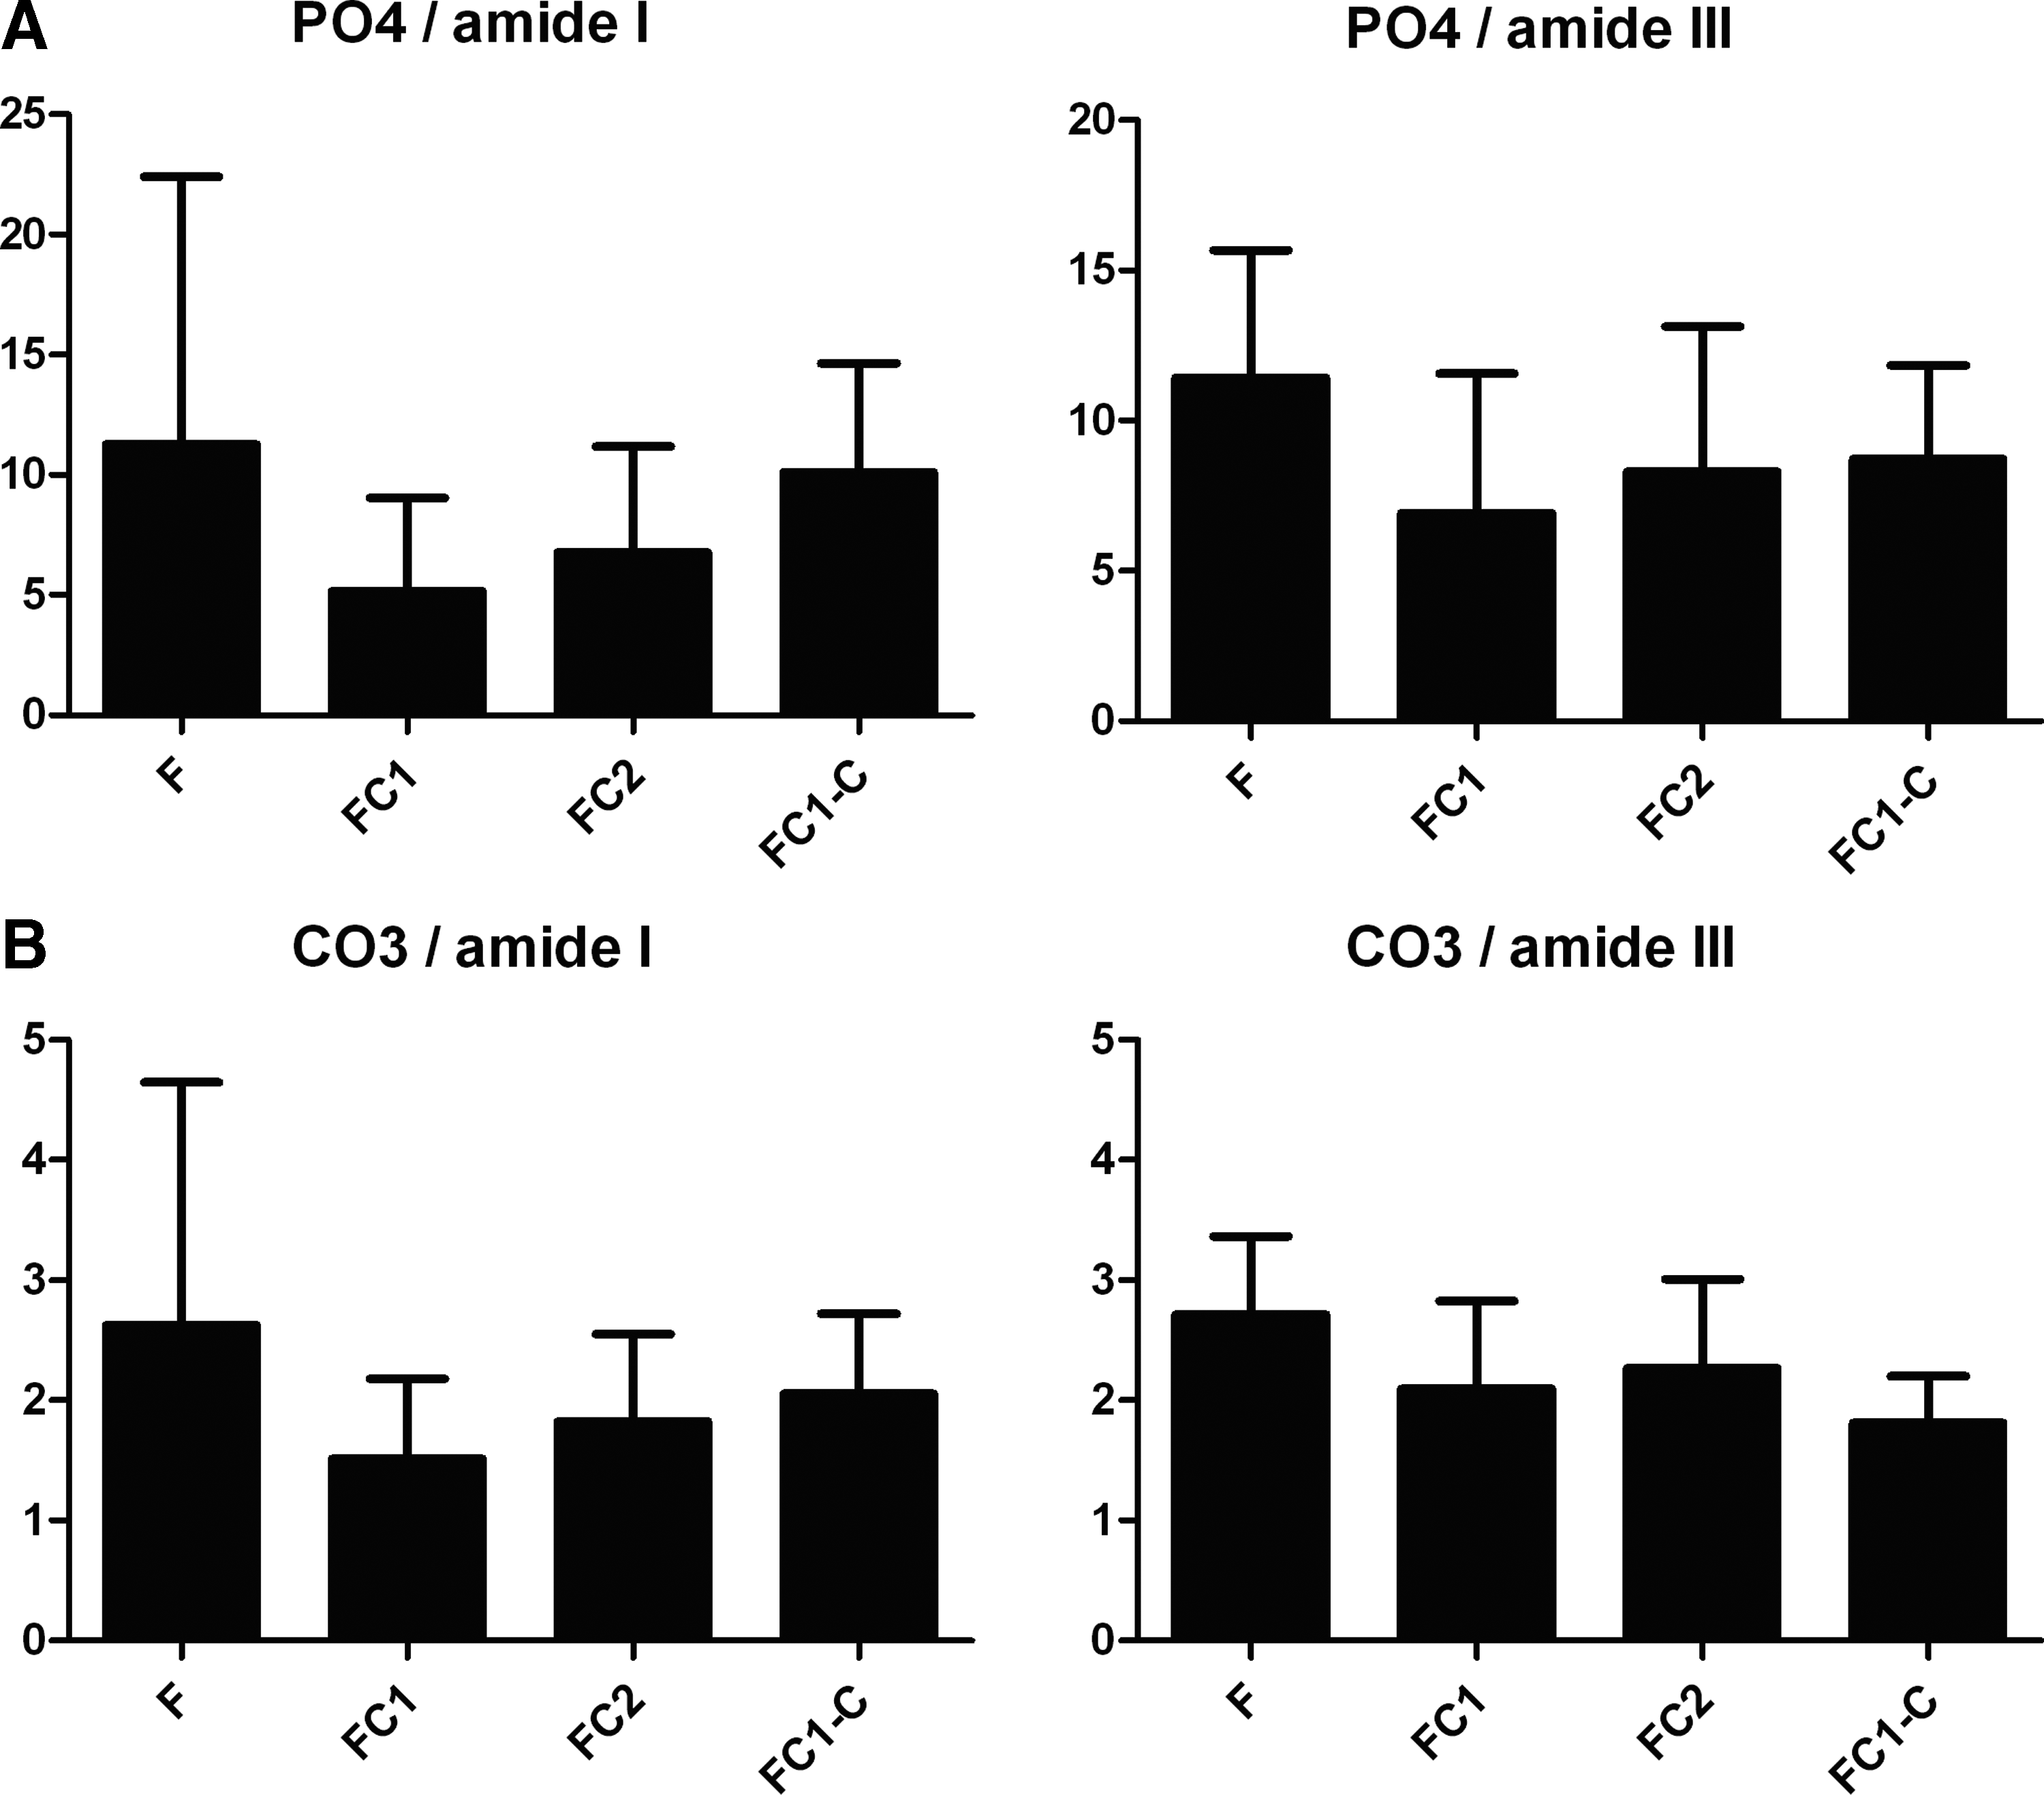
Mineral to matrix ratios as calculated from the values derived from Raman spectroscopy for PO4
Statistically significant differences (p < 0.0001) were calculated between the groups by ANOVA for each component.
Discussion
We have determined the content of several components generally considered of importance for bone quality by Raman spectroscopy. We followed a typical collection of graft material from the donor, through freezing and thawing cycles and ultimately chemical cleaning before transplanting, to the recipient and evaluated changes in bone content that potentially arise during the process. It has recently been shown that differences in mouse bone components were detected by Raman after two to three repeated freeze–thaw cycles. 11 In contrast, Yamamoto et al. showed that freeze–thawing up to three cycles did not affect the Raman spectrum of bone components detected in rat femora. 9 In our system investigating the chemical composition of human bone chips, Raman spectroscopy detected significant differences immediately after the first freeze–thaw cycle. The relative amounts inferred from the Raman spectrum peaks for each of the components of interest were significantly different in the bone content of amides, typical components of bone matrix. Both amide I and amide III showed increased values after freezing as did CH2. The values for CO3, however, were unaffected by freeze–thawing. The values quantitated by Raman spectroscopy in the sample after the second complete freeze–thaw cycle showed decreased values, ultimately residing between the values detected for the fresh and FC1 material, except for amide III, which increased further. The Raman spectra for the PO4 level followed a different pattern. Thus, the derived spectral patterns are not just an unspecific effect of different sample handling, but Raman could detect specific changes occurring in the specimen. The PO4 content decreased with one cycle of freeze–thawing and increased to a median level with the second cycle, but overall showed a larger variance. Note that since there is a two- to threefold weight difference in elements when comparing CO3 to PO4 (typically 6%–7% CO3, 18% PO4) 12 in human bone, changes in PO4 content are numerically larger and also potentially more biologically relevant. Interpreting the Raman spectra, chemical cleaning ultimately reduced the amount of all substances of interest. Comparing the spectra resulting from the group of cleaned bone chips to the spectra from fresh bone material, the bone values in au of amide I, amide III, PO4, CO3, and CH2 were reduced to about half of the initially detected by the procedure. It was not surprising to see significant changes made due to the cleaning process. In the end, chemical cleaning, including treatment with hydrogen peroxide, reduced organic materials, fats, and potentially proteins. It has recently been shown that by this loss of organic material, the chemical cleaning process further increased the mechanical stiffness of the graft material after it was compacted into a cylindrical shape. 13 To directly link these results, we will perform experiments that use Raman spectroscopy on samples derived from our mechanical test laboratory in the near future.
Of note for the biological changes in the graft, the mineral to matrix ratio did not vastly change during the described processes. Interestingly, the slight but statistically significant drop in the calculated ratios after freeze–thawing (FC1 and FC2) was restored after chemical cleaning, meaning that the chemically cleaned sample possessed relatively high amounts of minerals. A higher mineralization might be favorable for the patient since mineral uptake into the bone is a very slow process after the initial phase (which is months long) 14 and the graft should optimally substitute with high mineral content and improved mechanical strength. 15 The use of Raman spectrometry to determine the mineral to matrix ratio could provide significant data to discriminate a good graft from a bad graft for the patient.
We were further interested in the variability Raman measurements have regarding intersample detection precision. Data in Figure 1 are depicted as a scatter plot of all 750 derived values to highlight that data are not evenly distributed, but clusters exist within the core group as high as some of the determined values stray from the major core group. These could resemble an assembly of outliers from different measurements. Since we performed five line scans on three distinct bone chips, it is also feasible that values simply differ from bone chip to bone chip. Although numerically small, the differences in values derived from 250 spectra each determined from three distinct bone chips were significantly different (data not shown). These differences reflect variances in the composition of randomly chosen bone chips that derive from various parts of the femoral head. We see it as a major limitation to determine the measure of bone quality if only a single piece of bone is used for detection. The small amount of sample needed is a major advantage of the Raman technique; it, however, comes with the drawback of a very narrow signal detection area. To be able to make qualitative predictions about the bone components in a larger volume, it is necessary to test and collect data from several locations. For our procedure, we collected spectra derived from 50 distinct points within five line scans, each on three different bone chips totaling 750 spectra. We cannot make predictions on the differences that would be detected between patients since all our samples come from one femoral head. However, this closely resembles the condition that is found in the clinical situation when small defects are repaired; bone chips for grafting come from single donors. Our future studies will also include samples of a mixed pool of donor bone chips. In the clinical situation, we suggest testing each donor material, and in case larger quantities are needed for surgery to mix donor material of equal quality, or even choose donor materials that can substitute for each other.
The results acquired here clearly show that the storage and cleaning processes influence the chemical quality of bone chips prepared for transplantation. Raman spectroscopy has the potential for an alternative complementary method to assess these changes quickly and reliably. Our further studies, where bone composition is directly linked to biological activity and also mechanical stability, will deepen our knowledge about the importance and possible applications of Raman spectroscopy in bone banking and grafting.
Footnotes
Acknowledgments
We thank Mag. Clemens Roider and Prof. Dr. Monika Ritsch-Marte of the Division for Biomedical Physics, Innsbruck Medical University, for the Raman expertise and lively discussion, and Birgit Ladner and Marion Kos of the Central Institute for Blood transfusion and Immunology, Innsbruck Medical Hospital, for making available the material. This study was carried out with internal funds. Handling of human tissue was carried out according to legal provisions and rules of the medical faculty of the Innsbruck Medical University.
Author Disclosure Statement
No conflicting financial interests exist.