
Abstract
Quality assurance and quality control (QA/QC) procedures are vital to good biorepository management. The National Eye Institute (NEI) core CLIA-certified laboratory of the eyeGENE® Network receives blood from individuals with inherited eye conditions and isolates DNA for clinical genetic diagnostic testing and research. Clinical genetic test results are returned to the affected individuals, making it imperative that sample integrity is preserved throughout laboratory processing. A clinically validated, short tandem repeat (STR)-based approach, termed Sample Confirmation Testing (SCT), was developed to ensure that no significant laboratory errors occurred during processing. SCT uses modified protocols from commercial kits to create and compare STR profiles for each participant's original blood and derived DNA. This QA/QC procedure has been performed on 47% of the more than 6000 participants in the eyeGENE Biorepository and has identified significant laboratory errors in 0.4% of samples tested. SCT improves the quality of the data returned to affected individuals and the data distributed to researchers using eyeGENE samples by ensuring the integrity of the samples and aiding in curation of the biorepository. This approach serves as a model for other repositories to improve sample quality and management procedures.
Introduction
T
The National Eye Institute (NEI), also part of the NIH, is standardizing biorepository practices and methodologies to evaluate sample integrity through its National Ophthalmic Disease Genotyping and Phenotyping Network (eyeGENE®, ClinicalTrials.gov Identifier NCT00378742), a genomic medicine initiative. The primary goal of eyeGENE is to foster research into the causes and mechanisms of inherited eye diseases and translate these discoveries into potential treatments and cures. At the core of this program is a controlled access database and biorepository that link genotype and phenotype information to corresponding DNA samples for enrolled participants. The eyeGENE Biorepository contains more than 30,000 aliquots of blood and DNA from over 6000 participants with certain rare inherited eye diseases (https://nei.nih.gov/eyegene/genes_eyegene).
As part of biorepository operations, the CLIA-certified eyeGENE Laboratory receives whole blood, isolates DNA, banks blood and DNA, and ships aliquots of DNA to contracted CLIA-certified molecular diagnostic testing and approved research laboratories. Clinical genetic test results are stored in the centralized database and returned to the participant through the referring eye healthcare provider.
Participants may use the results to make important life decisions regarding family planning and participation in gene-based research and treatment trials. In addition, approved researchers can use the participant-specific genotype and phenotype information stored in the eyeGENE Database to request DNA samples from the eyeGENE Biorepository. Laboratory errors that result in misattributed clinical or genetic data, if unidentified, could have adverse effects on participants and their families as well as skew research outcomes.4,5 Thus, it is imperative that sample integrity is preserved throughout laboratory processing. To address this need, the eyeGENE Laboratory developed a QA/QC procedure that compares DNA directly to the blood from which it was extracted and can be performed retrospectively.
Many DNA-based authentication methods exist and their use as quality management tools has been described.6–9 Ultimately, a short tandem repeat (STR)-based approach, using commercially available kits with modified methodologies, was determined to be the best fit for the eyeGENE Biorepository. STR markers are used extensively in forensics, have been very well characterized, and when multiplexed, are polymorphic enough to reliably discriminate between individuals.6,10 STR loci have also proven useful in cell line and tissue authentication8,11 and have been used to analyze blood and DNA in biorepositories.
Typically, when blood was used as the starting material, the STR alleles were amplified from DNA that was purified from blood12,13 or from blood samples that had been preserved on Whatman FTA® Paper before amplification. 14 For the eyeGENE Biorepository, direct blood amplification was desired over an intermediate blood preservation or purification step because an intermediate step could potentially introduce additional laboratory error(s) and much of the analysis needed to be done retrospectively on blood samples that had only been preserved in their original receptacle at 4°C.
The use of commercial kits was optimal because they have the advantages of standardized methodology, technical support, and ready-to-use multiplexed reactions, all of which reduce time, cost, and energy spent developing and optimizing in-house assays. 15 Due to the size of the eyeGENE Biorepository and the known allele frequencies of commonly used STR loci, using a commercially available panel of over 10 loci was not necessary or cost effective. Because no single kit could amplify the desired STR loci directly from both blood and DNA, multiple commercially available kits were modified, combined, and clinically validated to produce the QA/QC procedure, termed Sample Confirmation Testing (SCT), which the eyeGENE Laboratory uses to identify processing errors and ensure sample integrity.
Materials and Methods
A network of registered eye healthcare professionals across the United States and Canada enroll participants with certain rare inherited eye diseases in the eyeGENE Network (NIH IRB-approved protocol 06-EI-0236) and submit a sample of peripheral blood collected in 10.8-mg K2 EDTA tubes along with the participant's clinical eye examination information to the eyeGENE Coordinating Center. The procedures followed were in accordance with the ethical standards of the responsible committee on human experimentation (institutional and national) and with the Helsinki Declaration of 1975, as revised in 2008. The eyeGENE Laboratory receives the participant's whole blood, isolates DNA, and banks blood and DNA (Fig. 1). Aliquots of the banked DNA may be shipped to a clinical molecular diagnostic laboratory and/or to an approved researcher. Before being shipped, the participant's blood and DNA must go through the SCT process (Fig. 2).

K2 EDTA tubes (10.8 mg) containing a total of 24–30 mL of blood are received within 72 hours of the draw

Flowchart of Sample Confirmation Testing process.
Amplification of four STR loci and amelogenin from DNA and liquid whole blood
The PowerPlex® S5 System (Promega Corporation, Madison, WI) coamplifies four STR loci (D8S1179, D18S51, FGA, and TH01) and amelogenin (commonly used for gender identification). The manufacturer's protocol was altered to amplify higher amounts of template DNA, and the polymerase chain reaction (PCR) amplification mix was scaled down to a total reaction volume of 15 μL. Each reaction contained 9.5 μL of molecular grade water, 3 μL of PowerPlex S5 5× Master Mix, 1.5 μL of PowerPlex S5 10× Primer Pair Mix, and 1 μL of diluted DNA (∼8 ng/μL).
The manufacturer's specifications for the Phusion Blood Direct PCR Kit (Thermo Scientific, Waltham, MA) were modified to amplify STR loci directly from liquid whole blood using the primers from the PowerPlex S5 System. Each 20 μL PCR contained 10 μL of 2× Phusion Blood PCR Buffer, 6.1 μL of molecular grade water, 2 μL of PowerPlex 10× Primer Pair Mix, 1 μL of whole blood preserved with 10.8 mg K2 EDTA, 0.5 μL of 50 mM EDTA, and 0.4 μL of Phusion Blood II DNA Polymerase.
PCR amplification through thermal cycling was performed using an Applied Biosystems® GeneAmp® PCR System 9700 (Life Technologies, Carlsbad, CA). The thermal cycling protocol was as follows: 96°C for 2 minutes, 25 cycles of 94°C for 30 seconds, 60°C for 2 minutes, 72°C for 90 seconds, and a final extension at 60°C for 45 minutes. Reactions were held at 4°C. The Phusion PCR was centrifuged at 1000 g for 3 minutes post-PCR, and the supernatant was used for fragment analysis.
DNA purification from whole blood
An alternative purification step was necessary for completely dried or clotted blood samples as well as any liquid blood samples that were amplified directly using the Phusion Kit and did not yield results that met the minimum quality requirements for data analysis. For this step, modifications were made to the QIAamp DNA Blood Mini Kit (Qiagen Corp., Hilden, Germany) protocol with respect to the starting material and the elution volume. For liquid samples, 50 μL of blood was brought up to 200 μL with 1× PBS. For dried samples, 5–7 blood flakes of at least 1 mm diameter were rehydrated in 200 μL of 1× PBS. For clotted samples, a “smear” of clotted blood equivalent to ∼20 μL was rehydrated in 200 μL of 1× PBS. The QIAamp Mini spin column was incubated with 50 μL of elution buffer at room temperature for 5 minutes before centrifugation. The purified DNA was measured using a NanoDrop 1000 (Thermo Scientific), and the average concentration was 15 ng/μL.
Each 25 μL PCR contained 16.5 μL of molecular grade water, 5 μL of the PowerPlex S5 5× Master Mix, 2.5 μL of the PowerPlex S5 10× Primer Pair Mix, and 1 μL of DNA purified from the original blood tube.
Detection of amplified fragments and data analysis
PCR products were analyzed using a 3130xL Applied Biosystems Genetic Analyzer (Life Technologies). For capillary electrophoresis, 1 μL of PCR product was added to a mixture of 9.5 μL Hi-Di Formamide (Life Technologies) and 0.5 μL Internal Lane Standard 600 (Promega Corporation). PCR products were run alongside an allelic ladder (Promega Corporation).
Data analysis was performed using PowerPlex panels and bins text files with GeneMapper (version 4.1) software (Life Technologies). Fragments amplified directly from blood were compared to those amplified from diluted DNA. Since the PowerPlex kit adds a nucleotide to the 3′ ends of amplified DNA fragments and the Phusion kit produces blunt-ended fragments, the blood fragment sizes must be 1 base less than its corresponding diluted DNA fragment, ±1 base, to be considered a match. Peak heights must be ≥100 relative fluorescence units to be considered in the analysis.
Corrective action
In instances where the STR profiles of an individual participant's blood and DNA did not match or indicated contamination with another participant's sample, investigations were launched to determine the cause of the aberrant results and identify any other participants involved in the incidents. SCT was performed on the blood and DNA of samples that were processed on the same days as the individual with unexpected results. While the investigations were active, these samples were quarantined, and any planned shipment of these samples was halted.
Aliquots that were involved in the incident were identified by comparing STR profiles to the first identified aberrant participant results. All aliquots that were found to not be involved in the incident were released from quarantine and reentered normal laboratory workflow. All aliquots that were directly involved in the incident were destroyed. If genetic test results had already been returned to participants whose samples were directly involved in the incident, the referring clinicians were alerted of the laboratory error and participants were contacted to inform them of the incident and to request an additional blood sample, as required by the eyeGENE Clinical Protocol.
Results
SCT methodologies have proven to be effective for identifying significant errors that may occur during sample processing as well as those originating before the sample entered the custody of the eyeGENE Program, such as mislabeling of the participant's blood tubes by the referring clinic (data not shown). SCT has been performed on more than 2800 of the ∼6000 (47%) participant samples in the eyeGENE Biorepository. Of the samples tested, 99.6% match. For the remaining 0.4%, eyeGENE and outside laboratory errors were identified and addressed through corrective action. Figures 3–5 illustrate SCT QA/QC results, including those indicating errors and contamination.

Electropherogram of fragments from the blood of Participant A, as amplified by the Phusion Kit. Electropherogram of fragments from the DNA of Participant A as amplified by the PowerPlex® S5 System. *An artifact produced by the Phusion polymerase chain reaction (PCR) that is not considered during interpretation.
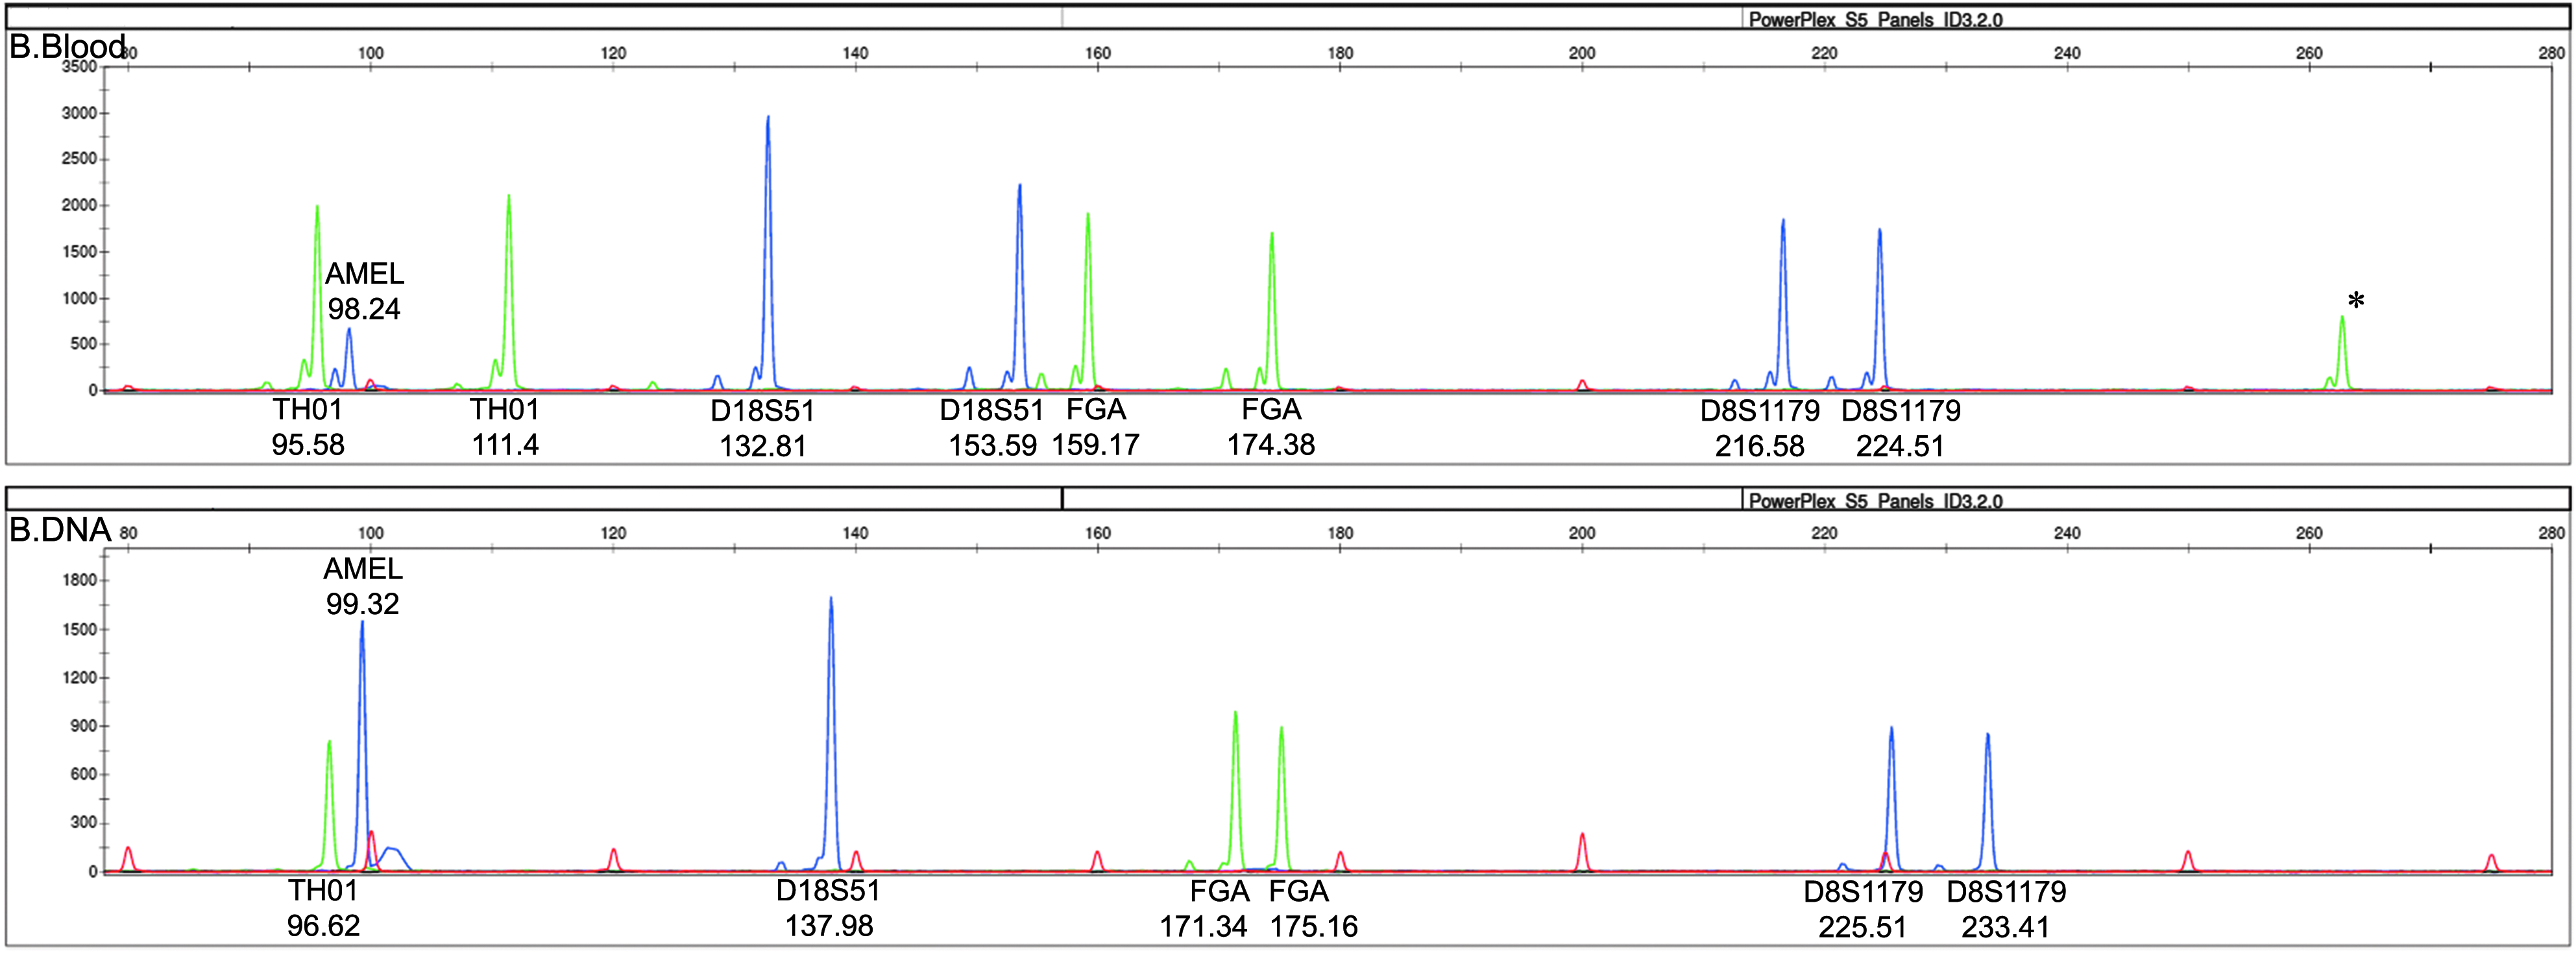
Electropherogram of fragments from the blood of Participant B, as amplified by the Phusion Kit. Electropherogram of fragments from the DNA labeled as Participant B as amplified by the PowerPlex S5 System. *An artifact produced by the Phusion PCR that is not considered during interpretation.
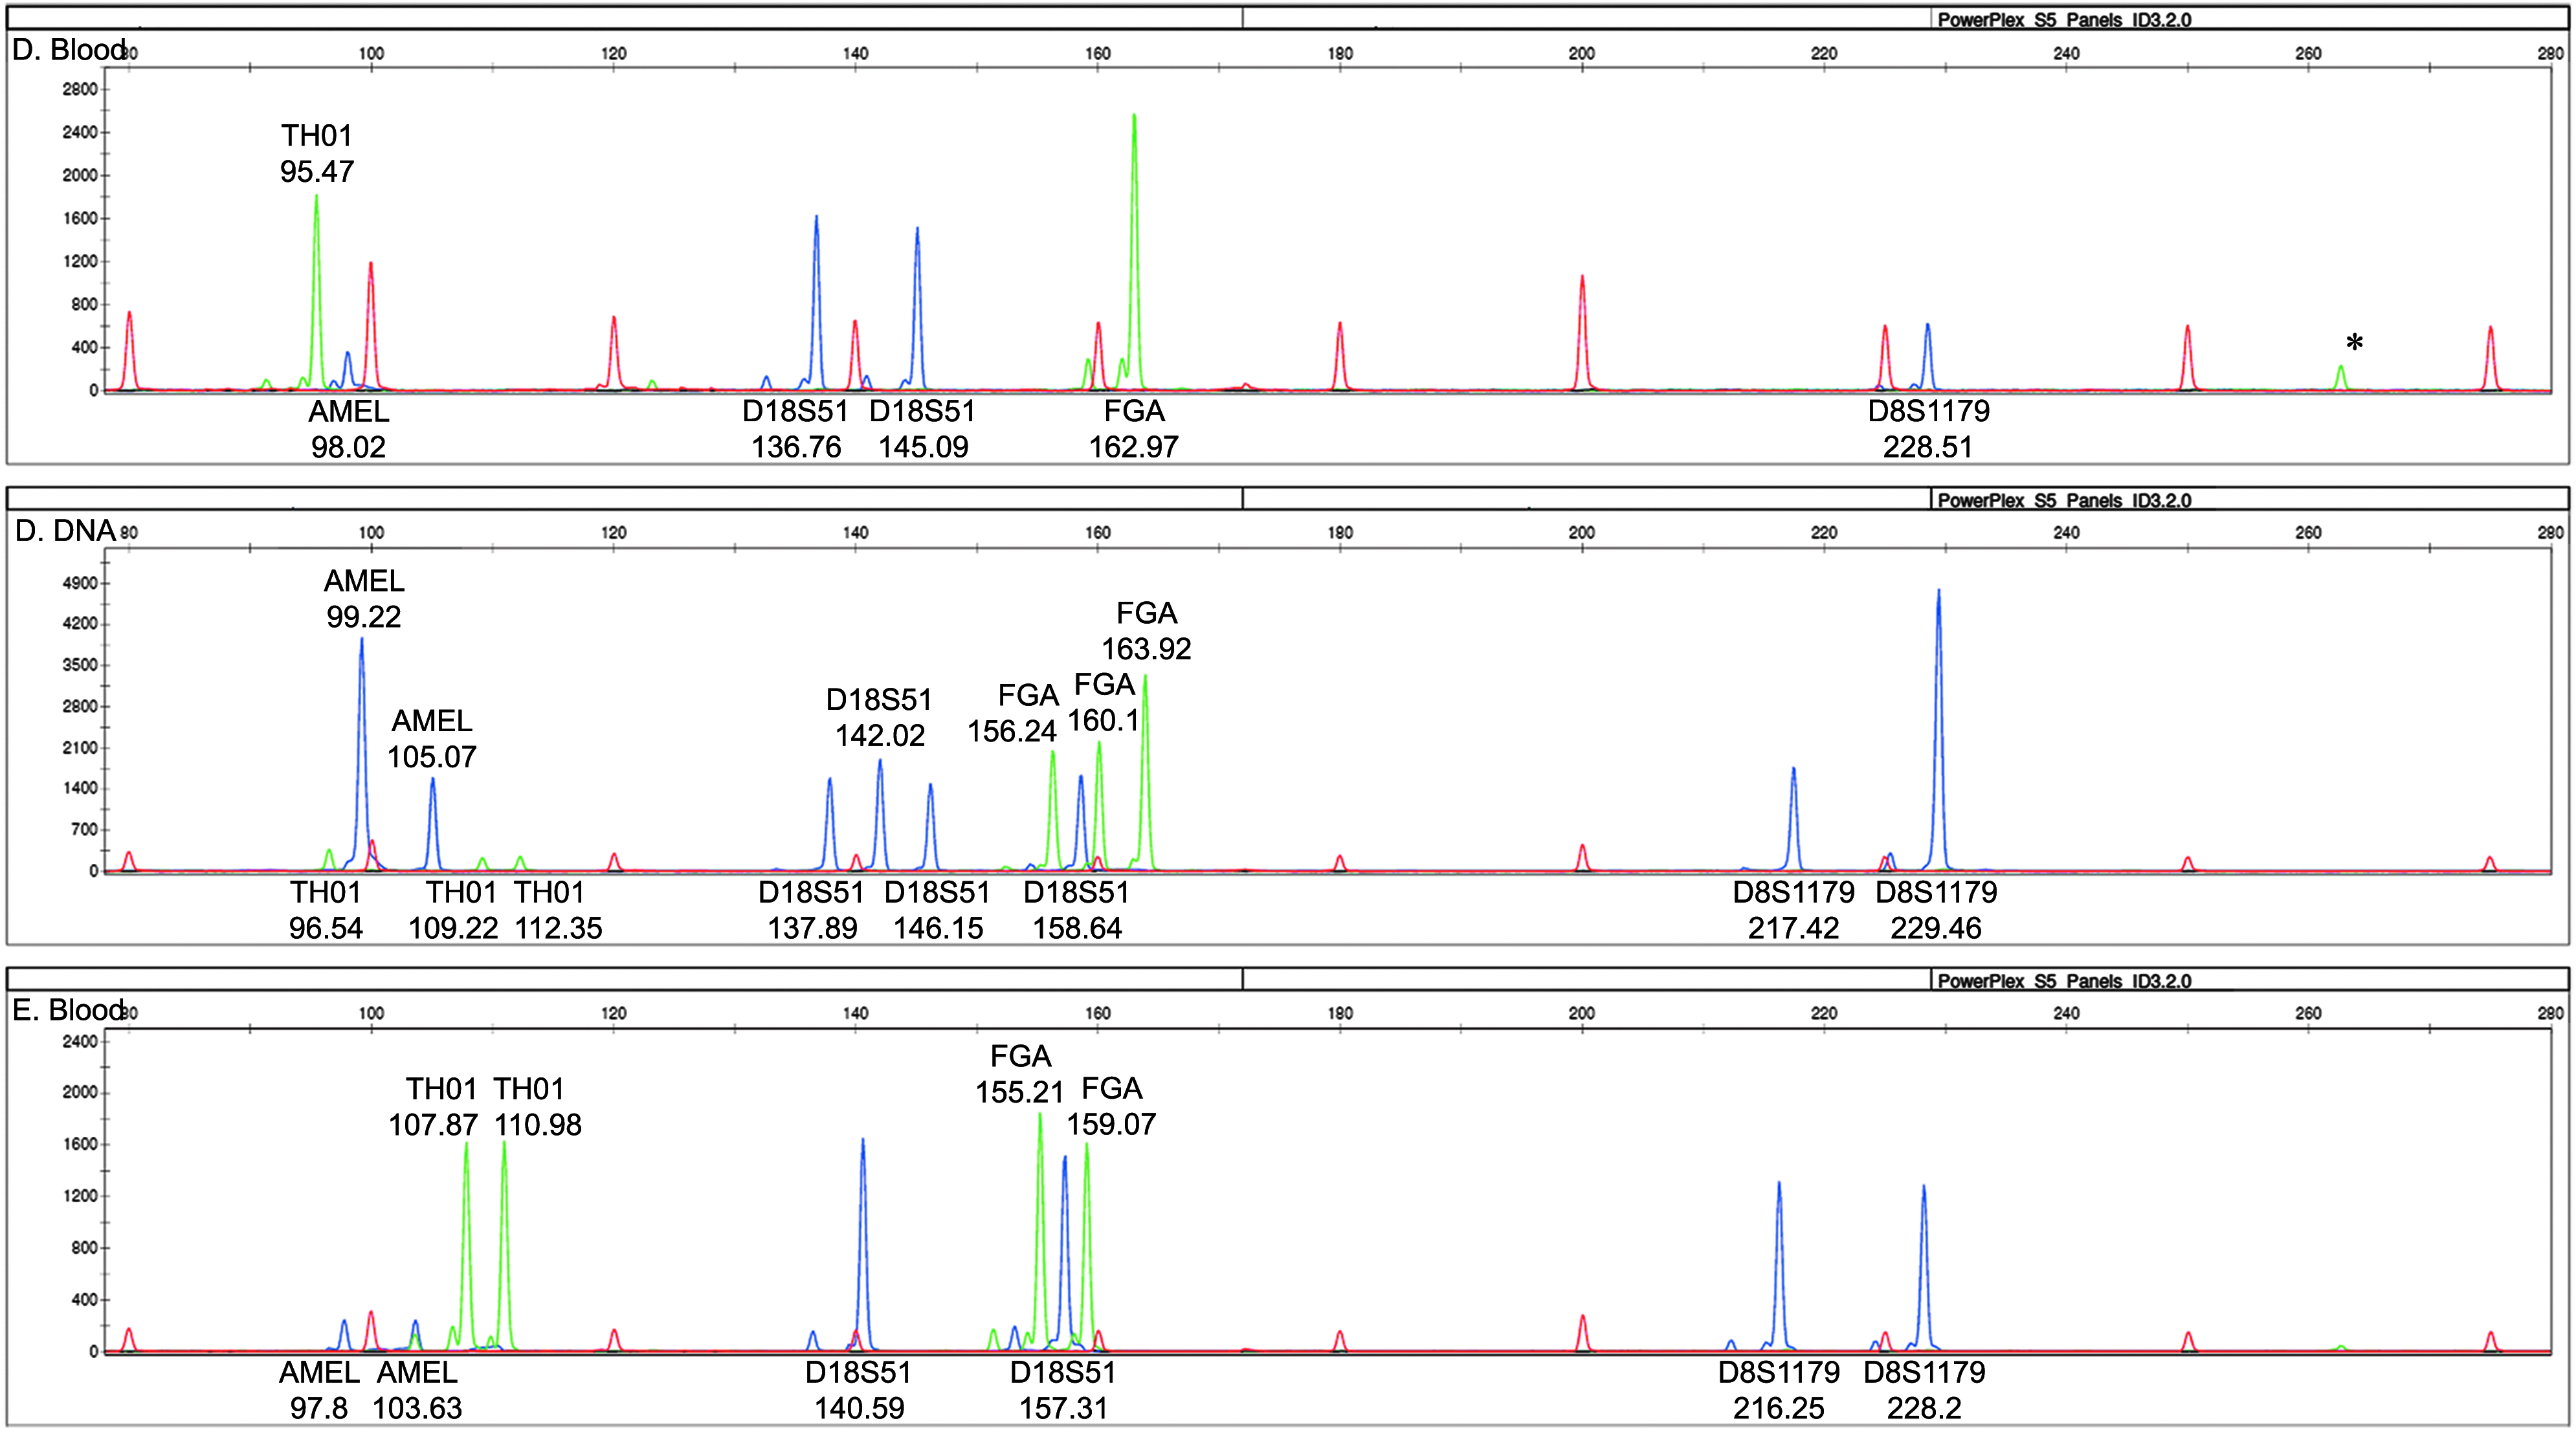
Electropherogram of fragments from the blood of Participant D, as amplified by the Phusion Kit. Electropherogram of fragments from the DNA labeled as Participant D as amplified by the PowerPlex S5 System. Electropherogram of fragments from the blood of Participant E, as amplified by the Phusion Kit. *An artifact produced by the Phusion PCR that is not considered during interpretation.
Match
Electropherograms of amplified fragments from the blood and DNA of Participant A are shown in Figure 3. The same number and pattern of peaks are seen in both electropherograms, indicating that the blood and the DNA match. The blood and DNA are both from a male who is heterozygous at all four STR loci. A comparison of the fragment sizes listed above or below each peak confirms the visual assessment that these two electropherograms match as the size of each blood fragment is 1 base less than its corresponding diluted DNA fragment, ±1 base.
Mismatch
Electropherograms of amplified fragments from the blood and DNA of Participant B depicting a sample mismatch are shown in Figure 4. The number and pattern of peaks are inconsistent between the two electropherograms. The blood is from a female who is heterozygous at all four STR loci (nine peaks total). The DNA is also from a female, but one who is homozygous at TH01 and D18S51 and heterozygous at FGA and D8S1179 (seven peaks in total). The fragment sizes listed above or below each peak confirm the visual evidence that these two electropherograms do not match.
SCT was performed on all female participants that were accessioned and/or processed to DNA in the same batch as Participant B. Through this analysis, the second participant, Participant C, was identified as the source of the DNA. Ultimately, all of the blood aliquots labeled as Participant B matched all of the DNA aliquots labeled as Participant C and vice versa (data not shown). All affected aliquots were removed from the eyeGENE Biorepository and destroyed. Each participant and their referring clinician were notified of the error, and additional blood samples were requested.
Contamination
Electropherograms of amplified fragments from the blood and DNA of Participant D as well as the blood of Participant E depicting a sample contamination are shown in Figure 5. The blood of Participant D is from a female who is homozygous at TH01, FGA, and D8S1179 and heterozygous at D18S51 (six peaks total). The DNA of Participant D appears to be from a male who has three TH01 alleles, four D18S51 alleles, three FGA alleles, and two D8S1179 alleles (14 peaks total).
Although the gender is inconsistent, the number of peaks observed in Participant D's DNA suggests that this is more than a sample mismatch. With the exception of triallelic patterns that are occasionally observed at a single locus in a multiplex STR profile, an individual should exhibit a maximum of two alleles for each STR locus (9 peaks total for females, 10 peaks total for males). Since the fragments sizes in Participant D's blood can be matched to corresponding fragment sizes in Participant D's DNA, the excess peaks in Participant D's DNA indicate contamination of the aliquot with a male participant's DNA.
SCT was performed on all male participants that were accessioned and/or processed to DNA in the same batch as Participant D. Through this analysis, the second participant, Participant E, was identified as the source of the contaminating DNA. An electropherogram of amplified fragments from the blood of Participant E is also shown in Figure 5. The fragment sizes in Participant E's blood match those of the extra peaks in Participant D's DNA. SCT analysis also confirmed that only the single DNA tube belonging to Participant D was compromised. No other blood or DNA aliquots from Participants D or E showed signs of contamination (data not shown).
Discussion
The novelty and value of SCT lie in the ability to compare the STR profile generated directly from the blood stored in its original receptacle to that of its corresponding banked DNA. This procedure successfully amplified and detected loci directly from blood for the vast majority of eyeGENE Participants tested. In a minority of blood samples, the alternate method of pre-PCR purification was required. SCT allows for retrospective STR loci analysis to be performed on blood samples that have been stored in their original tubes at 4°C or −20°C since their receipt up to 8 years ago.
Using amelogenin alone does not provide a high enough power of discrimination to serve as an appropriate QA/QC procedure for biorepositories. This is highlighted in the mismatch case where both participants involved were female, but the blood and DNA samples did not share the same STR profile, indicating that an error had occurred during processing.
Although not as comprehensive as other commercially available kits, the set of STR loci used in the PowerPlex S5 System has a probability of an identity (PI) value of 3.40 × 10⁻⁶. PI is the chance that two unrelated people selected at random will have the same genotype. The PI value was calculated using published PI values for D8S1179, D18S51, FGA, and TH01. Since amelogenin offers little to the probability of identity, it was not included in this calculation. 16 The PI value suggests that there is approximately a 1 in 300,000 chance of two unrelated individuals sharing the same STR profile (not considering gender). Based on this PI value, the PowerPlex S5 System should provide sufficient power of discrimination to continue functioning as a QA/QC procedure for the eyeGENE Biorepository and could also be used in biorepositories of similar size or larger.
The results from SCT analysis provide insight into the types of laboratory errors that are most common. Of the 0.4% of tested samples where laboratory errors were identified, two cases of contamination were observed and one case of outside clinic error was confirmed. The remaining errors were sample mismatch events, where the labels did not correspond to the participant material in the tubes. Analysis of the frequency of the three laboratory error types exposed points in Standard Operating Procedures (SOPs) where samples are most vulnerable to these types of errors. In response, SOPs were amended to include checkpoint steps designed specifically to prevent the likelihood of mismatches or contamination occurring in the future.
This QA/QC methodology also protects prospective samples from laboratory errors by providing the impetus for sample processing improvements as a whole. Implementation of this QA/QC procedure has had an overwhelmingly positive effect on biorepository operations by mitigating the effects of laboratory errors, improving the ability to curate the samples in the biorepository, and increasing the level of stakeholder and user confidence that samples in the biorepository are well curated.
The development and implementation of this QA/QC SCT method has a twofold effect on biorepository operations and sample curation. SCT improves the accuracy of the data returned to affected individuals and distributed to researchers using eyeGENE Samples by identifying a laboratory error and allowing for corrective action to take place before the error results in misinformation being presented to participants and researchers. SCT also encourages a more robust system of laboratory checks that leads to improved SOPs and sample processing, which will reduce laboratory error rates over time. The ability to identify potential laboratory errors is essential to the integrity and curation of samples in any biorepository. By proving its utility, this basic approach serves as a framework that can easily be modified and implemented in similar biorepositories to improve sample quality and biorepository management practices.
Footnotes
Acknowledgments
Supported by the Department of Health and Human Services/National Institutes of Health/National Eye Institute Intramural Research Program under National Ophthalmic Disease Genotyping and Phenotyping Network (![]() Identifier NCT00378742), which has been funded, in part, under Contract No. HHS-N-260–2007-00001-C.
Identifier NCT00378742), which has been funded, in part, under Contract No. HHS-N-260–2007-00001-C.
Author Disclosure Statement
No conflicting financial interests exist.