
Abstract
Blood microRNAs (miRNAs) are ideal biomarkers, and blood derivatives are often collected in the scope of miRNA research projects. However, knowledge of temporal variations of miRNAs in healthy individuals is lacking. In this study, miRNA variability was measured over a 1-year period in different blood derivatives, collected every 2–3 months from two healthy donors. There is a continuum of intraindividual temporal variability, with particularly stable (coefficient of variation [CV] <20%–30%) and particularly unstable (CV >100%–130%) miRNAs in serum, plasma, and specific white blood cell subpopulations. The temporal intraindividual variability of miRNAs should be taken into consideration in experimental design of biospecimen collections and validation of diagnostic biomarkers.
Introduction
E
More recently, it has been shown that miRNAs are also transported by high density lipoproteins, 4 with up to 90% of the circulating miRNAs not in fact encapsulated in vesicles, but rather associated with protein complexes. 5 Circulating miRNAs are considered to act in the manner of a hormone, exerting distant effects after uptake by cells in another region of the body. 6 The mechanisms by which miRNAs are generated in biological fluids are not well understood.
Analysis of miRNA expression in a range of disease types with quantitative reverse transcription polymerase chain reaction (RT-qPCR) allows precise quantitative analyses. 7 Optimal technical approaches, as well as pitfalls to avoid when analyzing miRNA in plasma and serum samples in this context, have been reported.8,9 Potentially critical in vivo and in vitro preanalytical factors were identified, including diurnal variations, fasting, needle gauge, precentrifugation delays, white blood cell (WBC) count, and storage duration. Another study has shown the impact of the anticoagulant type (EDTA is the anticoagulant of choice in plasma) and RNA extraction method on the sensitivity of miRNA detection. 10
The quality of extracted total-RNA samples can generally be controlled by RNA integrity number (RIN) measurements in cell subpopulations. However, the RIN algorithm is based on ribosomal RNAs, which are neither consistent nor sufficiently concentrated in serum and plasma samples and, thus, cannot be used for quality assessment of serum or plasma RNA, although that of the corresponding cell-derived RNA may be used as a surrogate quality indicator.
While miRNA quality is relevant in the scope of analytical validation of miRNA biomarkers, clinical validation entails knowledge of baseline reference ranges and of the reference change value (RCV), defined as the difference between two consecutive measurements of a given miRNA in an individual that represents a significant change in health status. 11 This validation is performed by analysis of intraindividual miRNA temporal variability occurring independent of disease occurrence.
We assessed an extensive miRNA panel for stability with a profile variability analysis performed from blood samples obtained every 2–3 months over 12 months from two healthy donors. Profiles were analyzed in serum and plasma, as well as in WBC subpopulations (granulocytes, monocytes, and T cells, the latter being representative of lymphocytes), using the WaferGen platform.
Methods
Blood collection and processing
Blood samples were collected from two healthy Caucasian donors (62-year-old male and 46-year-old female) who provided informed consent. Donors were nonsmokers with no recent illnesses or treatment for any chronic medical conditions. In total, 30 mL blood per sampling was collected between 9:00 and 11:00 am every 2–3 months over 12 months. Donors were asked to report any unusual food intake, exercise, and any infections/illnesses over the 12-month period.
Blood was processed within 2 hours following collection. Plasma was isolated from blood collected in EDTA Vacutainer tubes (Becton Dickinson) and centrifuged at 2000 g for 20 minutes. Aliquots were stored immediately at −80°C. Serum was isolated from blood clotted in a CAT Vacutainer tube becton dickinson for 30–45 minutes, then centrifuged at 2000 g for 10 minutes. Aliquots were stored immediately at −80°C. Complete blood counts in whole blood were performed with the ABX Micros CRP 200 (Horiba) according to the manufacturer's instructions.
WBC subpopulations were isolated by magnetic separation using an autoMACS® Pro Separator (Miltenyi Biotec). MicroBeads (CD3 Miltenyi Biotec, CD14 Miltenyi Biotec, CD15 Miltenyi Biotec, and CD45 Miltenyi Biotec) were added to blood samples collected in EDTA Vacutainer tubes and incubated for 15 minutes at 2°C–8°C. For CD45 and CD15 extractions, 1 mL blood was used, and for the CD3 and CD14 extractions, 2 × 1 mL blood was used. Cold autoMACS running buffer was added, and tubes were centrifuged at 445 g for 10 minutes. Pellets were resuspended in autoMACS running buffer placed in a precooled Chill 5 rack and immediately sorted with the Posselwb program.
Subpopulation purity was verified by flow cytometry using monoclonal antibodies CD3-PerCP (Miltenyi Biotec), CD14-PE (becton dickinson), CD15-PECy7 (becton dickinson), and CD45-FITC (becton dickinson) incubated for 30 minutes at 2°C–8°C, centrifuged at 300 g for 5 minutes, resuspended in autoMACS running buffer, and analyzed on a BD FACSVerse. Purified WBC subpopulations were quantified on a CASY Model TTC Cell Counter and Analyzer (Roche Applied Science) according to the manufacturer's instructions.
Hemoglobin measurement
Hemoglobin was quantified using a DetectX Hemoglobin Detection Kit (Arbor Assays) according to the manufacturer's instructions, using the standard supplied. Absorbance was measured with a Synergy MX spectrophotometer with Gen5 software (Biotec).
RNA extraction
Plasma/serum samples (250 μL) were centrifuged at 3000 g for 5 minutes at 4°C. Supernatant (200 μL) was incubated with 750 μL QIAzol (QIAGEN) supplemented with 1 μg MS2 RNA (Roche Life Science) for 5 minutes at room temperature. Samples were mixed with 200 μL chloroform and incubated for 2 minutes then centrifuged at 12,000 g for 15 minutes at 4°C. The upper aqueous phase was collected, 1.5 volumes of ethanol were added, and the total sample was transferred on an RNeasy Mini spin column (QIAGEN) and centrifuged for 30 seconds at room temperature, 13,000 g. Samples were washed with RWT buffer (QIAGEN) and then washed thrice with RPE buffer (QIAGEN). RNA was eluted with 50 μl DNase/RNase-free H2O by centrifugation for 1 minute at room temperature, 13,000 g, and then stored at −80°C.
For WBC subpopulation samples, duplicate fractions were pooled (monocytes, T cells) and centrifuged for 5 minutes at 300 g. Pellets were suspended in 200 μL phosphate-buffered saline and recentrifuged. The QIAzol Lysis Reagent (700 μL) was added to the pellet and this solution was thoroughly vortexed. Samples were stored at −80°C.
After thawing, Chloroform (140 μL) was added and thoroughly vortexed and 2 minutes incubation was followed by 15 minutes centrifugation at 12,000 g at 4°C. The upper aqueous phase was collected, 1.5 volumes of ethanol was added and transferred on to an RNeasy Mini spin column, and then centrifuged at 8000 g for 15 seconds at room temperature. Samples were washed with RWT buffer and then twice with RPE buffer. RNA was eluted with 30–50 μL DNase/RNase-free H2O, centrifuged for 1 minute at room temperature, 8000 g, and stored at −80°C. Extracted RNA from plasma/serum and WBC subpopulation samples were dried in a Labconco CentriVap and resuspended in 8 μL H2O.
RNA concentrations were determined by spectrophotometry (Synergy MX; BioTek Instruments). RNA integrity was analyzed in terms of RIN using RNA Nano Chip (Agilent) evaluated on an Agilent Bioanalyzer 2100 according to the manufacturer's instructions.
Quantitative polymerase chain reaction
0.5 μg of extracted RNA was tailed with poly As using Poly(A) Polymerase Tailing Kit (Epicentre) with RT buffer from the High capacity complementary DNA (cDNA) RT Kit and RNase inhibitor (both Applied Biosystems) for one cycle of 30 minutes at 37°C and then 5 minutes at 70°C, in a Thermal Cycler (C1000; Bio-Rad Laboratories). Samples were stored at 4°C followed by reverse transcription using the High Capacity cDNA Reverse Transcription Kit (Applied Biosystems) with SmartChip miRNA RT primers (WaferGen), with one cycle of 60 minutes at 40°C and then 5 minutes at 85°C. cDNA samples were stored at −80°C.
For qPCR, the total cDNA sample was used, mixed with 500 μL LightCycler 480 DNA SYBR Green 1 Mix (Roche Applied Science) with 1 mg glycogen (Roche Life Sciences) and 1 μg M13mp18-ssDNA (New England Biolabs) spiked in yeast controls (2.0 μL from Saccharomyces cerevisiae S288c; WaferGen) and made up to 1 mL with PCR grade H2O (Ambion). Samples were loaded onto a SmartChip Human miRNA Panel v3.0 (WaferGen) with a SmartChip Nanodispenser and read with a SmartChip Cycler using WaferGen Human miRNA v3 Protocol Rev B, or loaded chips were frozen at −20°C until analysis. Quadruplicate analysis was performed for each miRNA, time point, and specimen type.
Data analysis
miRNA qPCR profiles were analyzed with the WaferGen qPCR v2.5 software. See Supplementary Table S1 (Supplementary Data are available online at www.liebertpub.com/bio) for detailed analysis settings. Values were exported to qBase v 2.6.1 software (Biogazelle) and analyzed by specimen type and gender. Global normalization and target scaling to average were used for qBase parameter calculation settings. Calibrated normalized relative quantity (CNRQ) data were exported to Excel (Microsoft) from samples with the following QC criteria: global normalization factor between 0.3 and 3.33, reference target stability with an average GNorm M < 1.0, and coefficient of variation (CV) <0.6. Negative results were replaced by minimal CNRQ value of 0.050 to avoid artificially decreasing CVs. miRNA variability was expressed in terms of CV of the CNRQ, and miRNAs were ordered accordingly.
For each miRNA, the CVs of the CNRQ values for each gender and specimen type were ranked, together with the mean of the corresponding replicate non-normalized Ct values, of all the time points passing the acceptance criteria, and together with the number of these time points. The miRNAs with an accepted replicate number of Ct values of <2 time points per gender and specimen type were excluded. The miRNAs with at least two accepted replicate time points were sorted on CNRQ CV to generate a list of miRNA reliable ranking from the ones with the most stable levels to the ones with the most unstable levels per gender and specimen type.
Results
Characterization of plasma, serum, and WBC subpopulation samples
The two donors were healthy throughout the study duration, with no infectious episodes reported. Both followed a consistent diet and exercise schedule. There was no significant hemolysis in any of the serum or plasma samples: hemoglobin concentration was lower than 1.4 mg/mL in all samples (data not shown). The WBC subpopulation distribution was defined as being normal by HORIBA Medical Normal Ranges (Supplementary Table S2). Total yields of sorted cells were reproducible along the duration of the study: 2.7 × 10⁶ (±13%) CD45+, 1.5 × 10⁶ (±21%) CD3+, 7.3 × 10⁵ (±13%) CD14+, and 2.1 × 10⁶ (±16%) CD15+ for the female donor and 3.1 × 10⁶ (±29%) CD45+, 1.0 × 10⁶ (±40%) CD3+, 7.7 × 10⁵ (±25%) CD14+, and 2.5 × 10⁶ (±22%) CD15+ for the male donor. The purity of each sorted WBC subpopulation was >90% (data not shown).
All WBC subpopulation fractions had RIN values of 7.0 or higher (Supplementary Table S3). RIN score was not determined in serum and plasma samples.
miRNA temporal variability
miRNA variability was determined on the basis of CVs calculated for six evaluations corresponding to samples collected at six time points (every 2–3 months) over the 1-year period. From two time points (No. 1 and No. 3), the results failed the acceptance criteria and corresponding data were excluded from the analyses. We found that temporal variability of miRNAs in any of the blood derivatives that were examined (serum, plasma, lymphocytes, granulocytes, monocytes, or total leucocytes) corresponds to a continuum, with few miRNAs having extremely stable levels (0.7%–4.6% of the detected miRNAs have CV <10%), few miRNAs having very unstable levels (3.9%–7.8% of the detected miRNAs have 110% < CV <140%), and a substantial proportion of the detected miRNAs having extremely unstable levels (9.0%–19.6% of the miRNAs have CV >140%) (Fig. 1).

Number of miRNAs with different temporal CV% in blood derivatives. CV F and CV M correspond to the results obtained from the female and male donor, respectively. neg, absent miRNAs; CV, coefficient of variation; F, female; M, male; miRNAs, microRNAs.
Table 1 summarizes the least variable miRNAs in serum/plasma (CV <30%) and WBC subpopulations (CV <20%) as found in both female and male donors. The miRNAs with the most stable levels found in both serum and plasma were miR-106B*, miR-3652, miR-503, and miR-99A and in WBC were miR-4289, miR-4297, miR-3158, and LET-7A-2*. Supplementary Table S4 includes the miRNAs, which were consistently found to be absent (CV = 0%) in the blood derivatives (serum, plasma, and WBC subpopulations) of both the male and the female donor. The most variable miRNA for both female and male donor in plasma was miR-1260, while the most variable miRNAs in serum were miR-101*, miR-146B-3P, and miR-218-1*.
Indicates the opposite arm of the predominant miRNA on the predicted precursor.
CV, coefficient of variation; miRNA, microRNA.
Table 2 summarizes the most variable (CV >130%) miRNAs in serum and plasma, and Table 3 summarizes the most variable (CV >100%) miRNAs in WBC subpopulations as found in both female and male donors. Figure 2 shows representative examples of the CNRQ temporal variation for different miRNAs. Complete lists of the CV% of CNRQ of all miRNAs are available in Supplementary Table S5. The annual variation range of the raw (non-normalized) Ct values of the miRNAs with the most stable levels was generally lower than 2Ct, while the annual variation range of the raw Ct values of the miRNAs with the most unstable levels was often as high as 6Ct (Fig. 3).
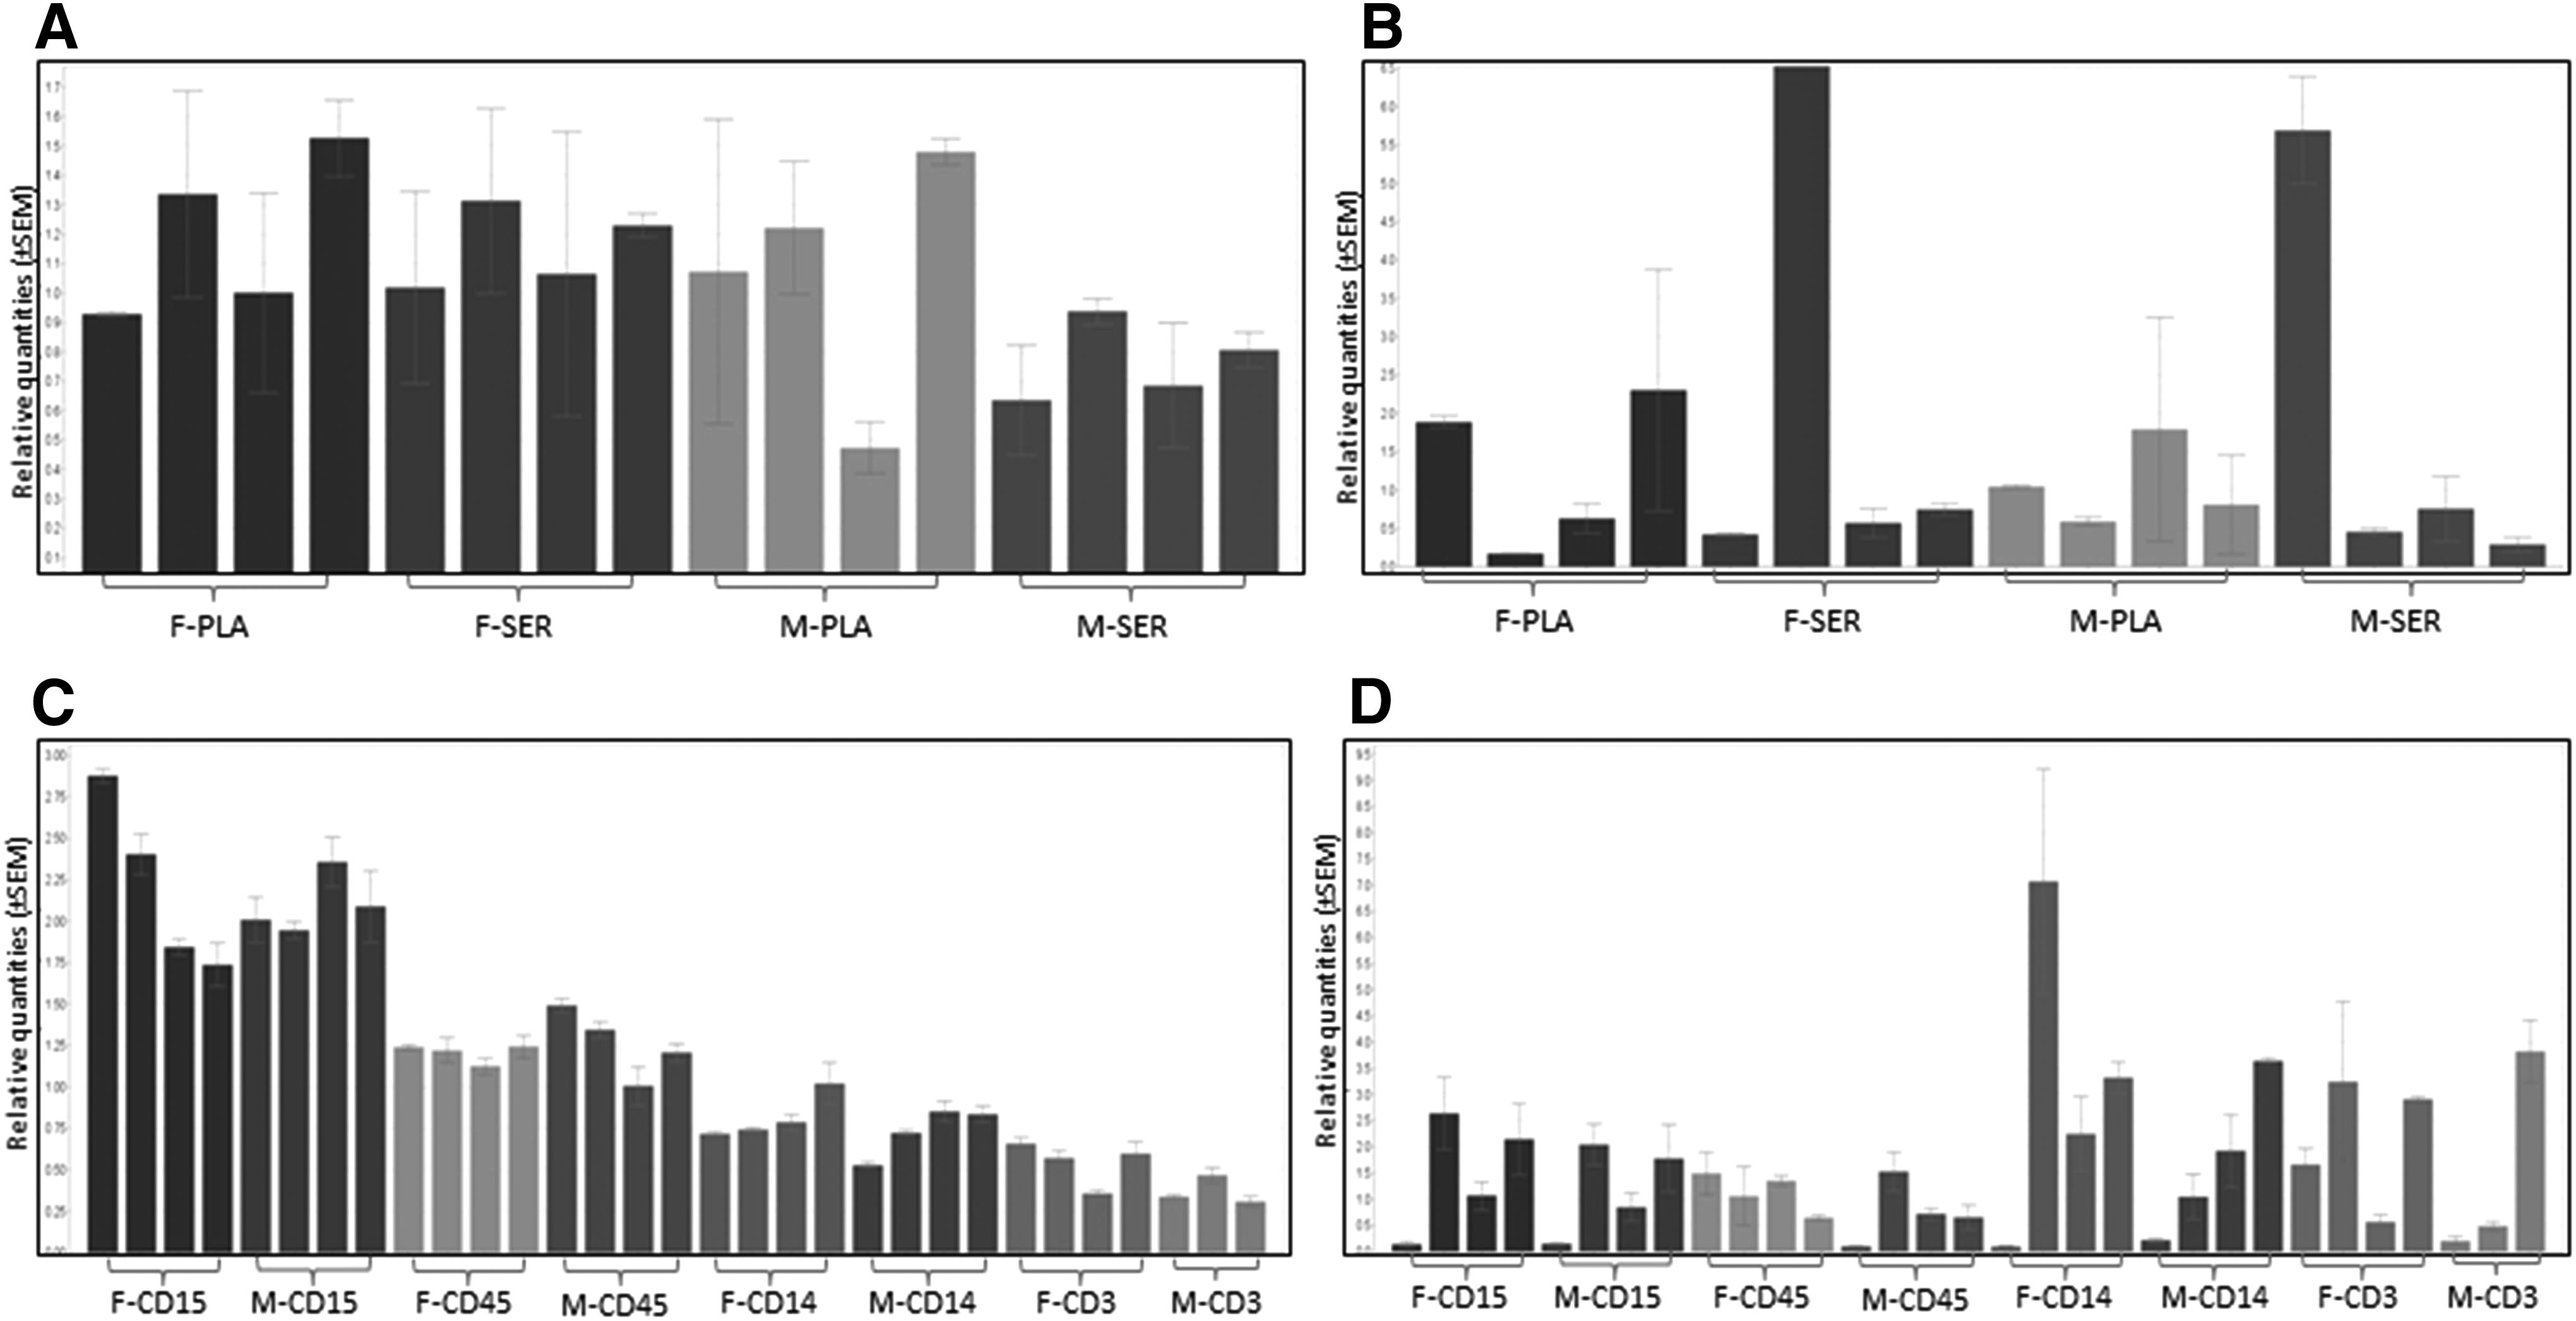
Relative quantities of four miRNAs in blood derivatives isolated from a female and male donor, at six time points over 1 year.
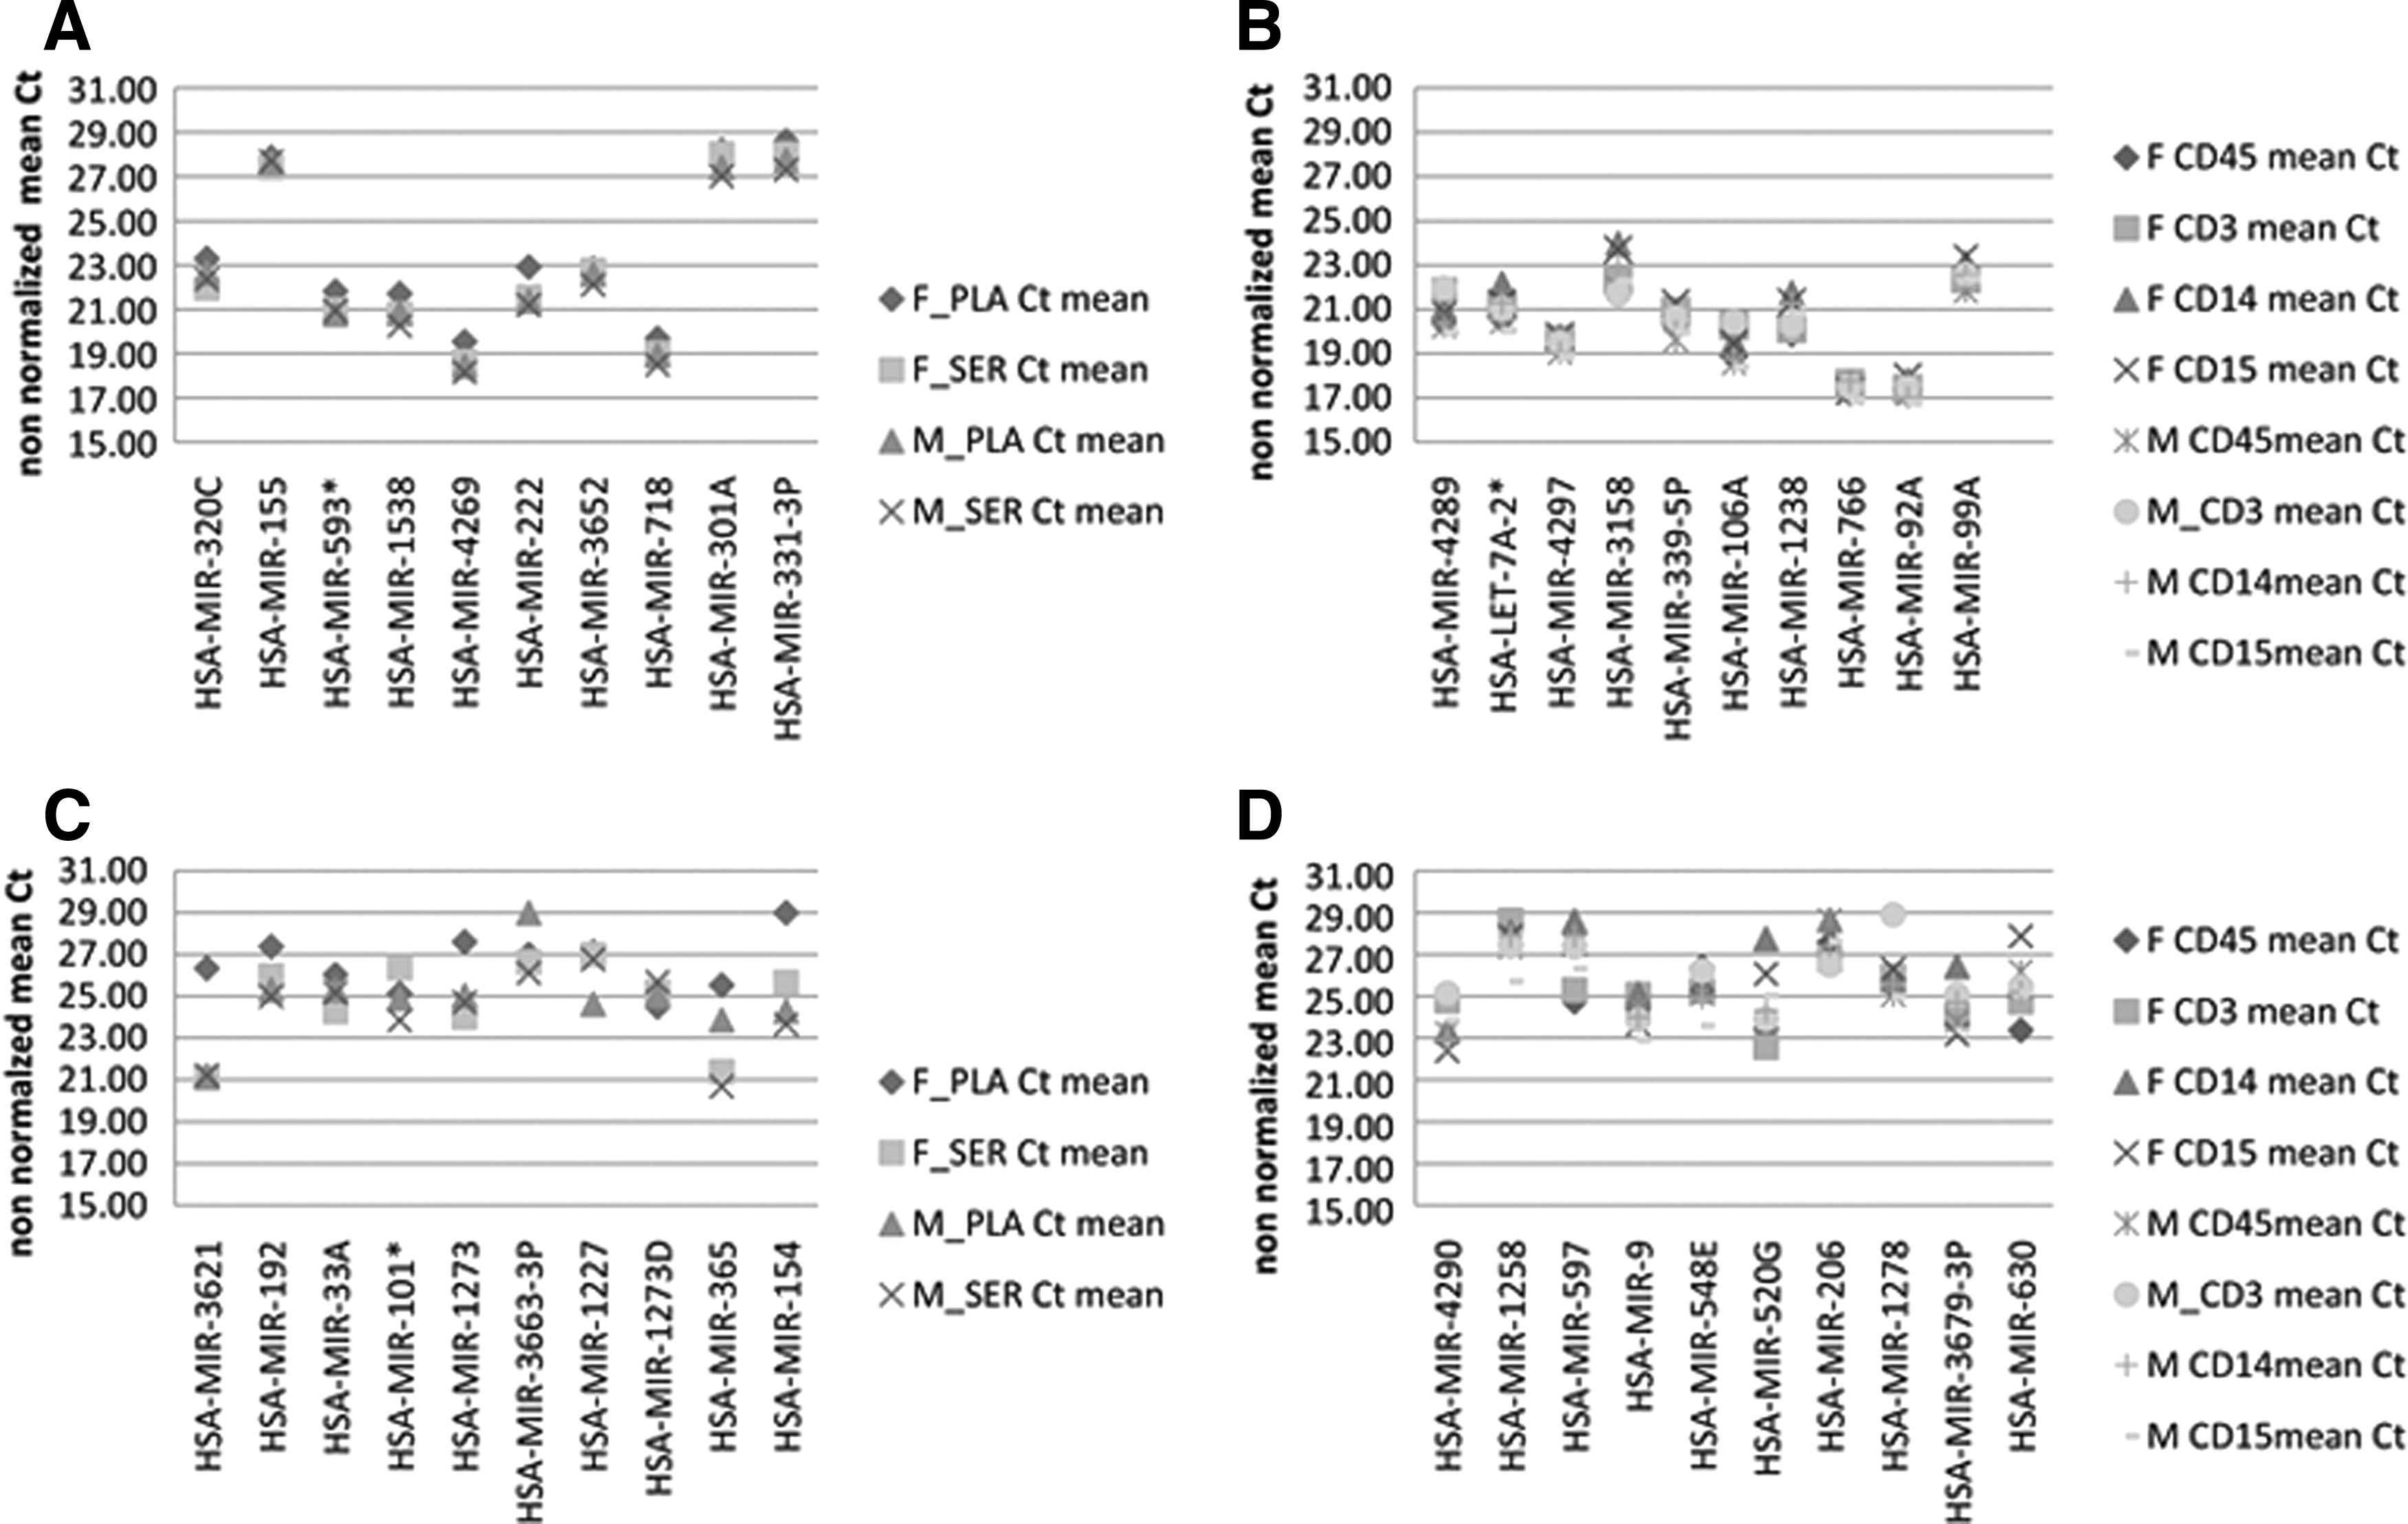
Examples of raw Ct value variations of stable miRNAs in PLA/SER
The miRNAs listed were at least in two of the time points analyzed, positive per sex and sample type. In bold are the miRNAs, which are highly variable for both female and male donors.
Indicates the opposite arm of the predominant miRNA on the predicted precursor.
F, female; M, male.
Indicates the opposite arm of the predominant miRNA on the predicted precursor.
WBC, white blood cell.
Discussion
Although differences between the miRNA profiles of serum and plasma have been shown, 12 many of the miRNAs with the most stable levels had stable levels in both serum and plasma (Table 1), for example, miR-3652, miR-503, and miR99A. Zhao et al. found the miR-346 and miR-134 to be stably detected in plasma extracted from PAXgene tubes, over various in vitro preanalytical parameters, including processing delay, storage conditions, and storage time. 13 These miRNAs showed high intraindividual temporal variability in our study. Therefore, it appears that specific miRNA targets can be robust to in vitro preanalytical conditions, when specimen collection occurs at one time point and has high in vivo intraindividual variability over time.
The significant differences we identified in the miRNA profiles of lymphocytes, monocytes, and granulocytes in both healthy donors support previous recommendations to use selected WBC subpopulations for miRNA studies, 14 and at a minimum to accurately document blood cell counts in the original blood specimens if using RNA from whole PBMCs. Many miRNAs were consistently absent from all blood cell subpopulations (Supplementary Table S4, miRNAs shown in bold under CD45+). Examples of miRNAs whose CNRQs had the lowest CV% are miR-4289 and miR-490-3P in total leucocytes, miR-106A and miR-3676 in lymphocytes, miR-3665 and miR-598 in monocytes, and miR-3137 and miR-924 in granulocytes (Supplementary Table S5).
Although miRNA circadian oscillations have been found in Drosophila 15 and mice, 16 circannual variability in humans has not previously been studied. Our analysis demonstrated high temporal in vivo variability for many miRNA normalized relative quantities in two unrelated donors. Furthermore, this variability was seen in different biospecimen types—serum, EDTA plasma, lymphocytes, monocytes, granulocytes, and total leucocytes. A range of causes may contribute to miRNA temporal instability. Seasonal variations have been reported to affect blood clinical chemistry parameters,17,18 and may also affect some miRNAs. However, a multiannual study will be necessary to assess seasonal variations.
Among other in vivo and in vitro parameters with a potential impact on miRNAs, age and gender have previously been reported as not influencing miRNA concentrations in either PBMC or plasma microvesicles. 3 Some miRNAs have been reported to increase in the event of hemolysis, including miR-15b, miR-16, miR-24, 19 and miR-451. 20 Among these, the miR-16 and miR-451 were among the most variable miRNAs in female serum.
The choice of the WaferGen platform for detecting differences between miRNAs was based on published data demonstrating very high sensitivity and reproducibility. 21 The data analysis pipeline used here combines the power of both the WaferGen and the qBase analysis programs. This allowed us to determine a list of miRNAs sorted according to temporal stability at 2 to 3-month intervals over a period of 1 year, for two donors and different sample types.
As with any validated clinical diagnostic biomarker, knowledge of the analytical imprecision (CVa), biological intraindividual variation (CVw), and interindividual variation (CVb) is required. A diagnostic laboratory must establish the following parameters to assess clinically significant differences from a patient's homeostatic baseline 1 : desirable assay imprecision (usually corresponding to half the intraindividual variability; 0.5 CVw),2 index of individuality (ratio of the intraindividual to interindividual variation), 3 and RCV. 22 The simplest method to calculate RCV, assuming that consecutive measurements are not correlated, is RCV = 2.77√(CVw2 + CVa2). 11 In the case of miRNA RT-qPCR, with very low CVa, this is RCV = 2.77 CVw. The higher the CVw the more difficult it is to prove the clinical relevance of a blood miRNA-based signature and to use it in clinical practice.
Our study showed that roughly 20% of blood miRNAs exhibited random intraindividual variations with CVw > 100% over time. This highlights the need to establish platform-specific reference ranges and databases of biological variability for all miRNAs, as has been done with other clinical chemistry parameters. 23 While this study was based on 2 donors, establishment of reference ranges in healthy population would require 120 donors, according to international recommendations. 24 When collecting blood specimens in the scope of miRNA biomarker discovery, we suggest collecting and storing specific blood derivatives (WBC subpopulations, serum, or plasma) and at multiple time points, to avoid bias from intraindividual temporal variations.
Footnotes
Acknowledgments
The authors are grateful to Sarah MacKenzie, PhD, for scientific writing assistance, to Stefaan Derveaux for advice on statistical analysis of the data, and to the two blood donors.
Author Disclosure Statement
No competing financial interests exist.
References
Supplementary Material
Please find the following supplemental material available below.
For Open Access articles published under a Creative Commons License, all supplemental material carries the same license as the article it is associated with.
For non-Open Access articles published, all supplemental material carries a non-exclusive license, and permission requests for re-use of supplemental material or any part of supplemental material shall be sent directly to the copyright owner as specified in the copyright notice associated with the article.