
Abstract
Most scientific studies are too long to be conducted in a single day or even in a few days. Thus, there is a need to store samples for subsequent investigations. There is sparse information about specific sample storage protocols that minimize analytical error and variability in evaluations of redox parameters. Therefore, the effects of storage temperature and freezing time on enzymatic activities, protein oxidative damage, and CAT (catalase) and SOD1 (superoxide dismutase) immunocontent of blood, liver, and brain from rats were determined for two different sample forms (frozen homogenized tissue or frozen intact tissue). Superoxide dismutase activity was drastically decreased in blood and liver with an increase in freezing time, but not in brain. Catalase activity showed a decrease only in intact liver at −20 and −80°C. In contrast, in blood it showed an increase in intact tissue at −20 and −80°C. Reduced thiol groups generally decreased with freezing time, but showed an increase in intact blood at −20 and −80°C, probably because of color interference. Carbonyl groups in homogenized liver and brain, and in intact blood (except at 80°C) drastically increased with freezing time. Freezing time did not modulate the immunocontent of CAT and SOD1 levels in any tissue. In conclusion, our results indicate that storage at −20°C affects redox parameters more than storage at −80°C. Storage for a long time may compromise the samples, leading to changing parameters due to oxidative stress. Thus, we suggest processing the samples as soon as possible. However, if this is not possible, then material can be aliquoted into different tubes to prevent the effect of refreezing of samples.
Introduction
R
Cryopreservation of samples induces the formation of reactive oxygen species (ROS) in animal tissues.1–3 ROS have multiple roles in various physiological systems and appear to be the most responsible for the degradation of critical biological molecules such as RNA 3 and DNA. 4 ROS may lead to damage to proteins and lipids through oxidation. 5 Therefore, formation of ROS during the freezing process is a major problem for researchers, and the storage time and the freeze-thaw cycles can aggravate the sample deterioration, compromising the final results of the study. 6
For each analyte there is an ideal storage condition to avoid compromising the reliability needed for the successful completion of the research. 7 However, the ideal storage conditions are not known for many analytes. Thus, protocols to reduce the adverse effects of the freezing process are essential. Therefore, we decided to investigate different conditions of cryopreservation to elucidate the preferred method of storage and handling of samples.
We investigated the cryopreservation effects in brain, liver, and blood of Wistar rats. These organs present different characteristics and consequently expand the range of variations to investigate the freeze-thaw cycles. The aim of our study was to compare the effects of freezing and thawing at different storage times (0, 15, 30, and 60 days) on some redox parameters and to evaluate the difference between three types of storage (homogenized samples and intact tissues at −20°C and intact tissues at −80°C). To perform our work, we used techniques for evaluating protein oxidative damage (carbonyl and sulfhydryl [SH] groups), the activity of two important ROS detoxification enzymes, including catalase (CAT) and superoxide dismutase (SOD), and the CAT and SOD1-Cu/Zn content of samples.
Material and Methods
Chemicals
The chemicals used in the study were as follows: Glycine, epinephrine, trichloroacetic acid (TCA), 2,4-dinitrophenylhydrazine, CAT (EC 1.11.1.6), SOD (EC 1.15.1.1), and hydrogen peroxide (H2O2) were purchased from Sigma-Aldrich. Electrophoresis and immunoblot reagents and materials were from Bio-Rad) and GE Healthcare Brazilian Headquarters. Blood samples were collected in tubes containing heparin (Vacuplast; Cral). SOD1/Cu-Zn (ab13498) polyclonal antibody was from Abcam®. Catalase (Cat. 219010) polyclonal antibody was from Merck Millipore. β-actin (#4967) polyclonal antibody and biotinylated protein ladder were from Cell Signaling technology®. Peroxidase conjugated anti-rabbit IgG (#AP132P) and peroxidase conjugated anti-Mouse IgG, H+L (#AP124P) were from Merck Millipore. Immunoblot chemiluminescence detection was conducted with the West Pico detection kit from Thermo Fisher Scientific. All other reagents used in this study were of analytical grade.
Animals
Male Wistar rats (8 weeks old) were obtained from our breeding colony (n = 6 per group). They were caged in groups of four animals with free access (ad libitum) to water and to standard commercial food (Chow Nuvilab CR-1 type). Rats were maintained in a 12-h light-dark cycle in a temperature-controlled colony room (21°C). The animals were manipulated during 1 week before euthanasia to reduce animal stress caused by manipulation and weighing. All experimental procedures were performed in accordance with the guidelines of the National Institutes of Health. 8
Experimental design
For this study, six male Wistar rats (60 days old) were euthanized by decapitation. Blood, liver, and brain were collected and immediately placed on ice. Blood was collected in heparin tubes (Vacuplast), centrifuged at 1500 g for 10 min, and the top layer (plasma) was removed. We only used the erythrocyte fraction for analysis. Before we aliquoted brain tissue, due to the presence of various structures in the brain, these samples were gently sliced into small pieces with a scalpel while on ice, and then the pieces were randomized. All three tissues of each rat were divided into four aliquots: (1) homogenized in 50 mM phosphate-buffered saline (PBS) (pH 7.4, KH2PO4 and K2HPO4), analyzed without freezing (in the same day of euthanasia — time 0); (2) homogenized in 50 mM PBS buffer (pH 7.4, KH2PO4 and K2HPO4) without any cryoprotectant and frozen at −20°C; (3) frozen at −20°C without homogenization (intact tissue); and (4) frozen at −80°C without homogenization (intact tissue). At −80°C, only intact (without homogenization) tissues were stored because it is the more common storage form for long periods (Supplementary Fig. S1; Supplementary Data are available online at www.liebertpub.com/bio). The samples frozen at −20°C (homogenized and intact tissue) were thawed and analyzed at 15, 30, and 60 days after freezing. After we separated the material into aliquots, samples were refrozen for analysis of additional freezing times. This process was conducted in this way to represent common laboratory practices. The samples stored at −80°C were thawed only at 60 days for comparison to the other groups. A piece of frozen intact tissue was homogenized at each time point (15, 30, and 60 days) in 50 mM PBS buffer (pH 7.4, KH2PO4 and K2HPO4) and centrifuged at 3000 g for 10 min to remove any precipitates. Similarly, samples that were frozen homogenized, after being thawed at each time point (15, 30, and 60 days), were vortexed and centrifuged at 3000 g for 10 min to remove any precipitates (detailed in Supplementary Fig. S1).
Antioxidant enzymes (CAT and SOD)
CAT and SOD activities were quantified in three tissues (heparinized blood, liver, and brain). CAT activity was evaluated by determining the rate of H2O2 absorbance decrease at 240 nm. 9 Results were expressed in units of CAT/mg of protein. The activity of SOD was measured by quantifying the inhibition of superoxide-dependent adrenaline autoxidation to adrenochrome, which was monitored at 480 nm for 10 min (32°C) in a spectrophotometer. 10 Results were expressed as units of SOD/mg of protein.
Oxidative damage markers (carbonyl and SH)
As an index of protein oxidative damage, the carbonyl groups were determined based on reaction with 2,4-dinitrophenylhydrazine as previously described. 11 The oxidative status of thiol groups was assessed by quantification of total reduced SH groups in samples. 12 Briefly, for total SH content measurement, a sample aliquot was diluted in 50 mM PBS at pH 7.4 (NaCl, Na2HPO4, KH2PO4) and mixed with 5,5′-dithiobis (2-nitrobenzoic acid) (10 mM). The reaction was read in a spectrophotometer at 412 nm after 60 min of incubation at room temperature.
Hemospectrum
To evaluate the color changes of blood samples, we homogenized samples in PBS (50 mM, pH 7.4) with an automatic homogenizer, Ultra-Turrax (1:1), and centrifuged them at 10,000 g. After we appropriately diluted (4 ×) samples, the blood in PBS (50 mM, pH 7.4) and absorption spectra were recorded at 350–750 nm. 13 Results were expressed as absorbance/μg of protein.
Western blotting
To perform immunoblot experiments, the tissue was prepared using an radioimmunoprecipitation assay buffer protocol. The proteins (30 μg/well) were fractionated by sodium dodecyl sulfate polyacrylamide gel electrophoresis and electroblotted onto nitrocellulose membranes with Trans-Blot SD Semi-Dry Electrophoretic Transfer Cell (Bio-Rad). Protein loading and electroblotting efficiency were verified through Ponceau S staining, and the membranes were washed with TTBS (Tris 100 mM, pH 7.5, 0.9% NaCl, and 0.1% Tween-20). Membranes were incubated for 20 min at room temperature in the SNAP i.d. 2.0 Protein Detection System (Merck Millipore) with each primary antibody (anti-CAT, anti-SOD1, or anti β-actin; 1:500 dilution) and subsequently washed with TTBS. Anti-rabbit or mouse IgG peroxidase-linked secondary antibody was incubated for an additional 20 min in SNAP (1:5000 dilution) and washed again, and the immunoreactivity was detected by enhanced chemiluminescence using Supersignal West Pico Chemiluminescent kit. The chemiluminescence was captured with an ImageQuant LAS 4000 (GE Healthcare). Densitometric analysis of the films was performed using Image J software. Blots were developed to be linear in the range used for densitometry. All results were expressed as a relative ratio to β-actin.
Protein assay and statistical analysis
Total protein was quantified by Bradford assay and used to normalize all data. 14 Statistical analysis was performed with GraphPad 5.0 software. The results were expressed as mean ± standard error (SEM). Data were evaluated by one-way analysis of variance followed by Tukey's post hoc test. Differences were considered significant when p < 0.05.
Results
Antioxidant enzymes (CAT and SOD)
The process of repeated freeze-thaw cycles did not interfere with CAT activity in samples that were previously homogenized and frozen. The results were exactly the same in all times, independent of the tissues analyzed (blood, Fig. 1A; liver, Fig. 1C; and brain, Fig. 1E). In contrast, tissues that were stored intact showed significant changes in CAT activity. In blood (Fig. 1B), the activity of CAT at day 0 was 7.05 U of CAT/mg of protein, while after 15, 30, and 60 days of freezing, the activity increased to 30.5, 27.3, and 40.4 units of CAT/mg of protein respectively (p < 0.001). Tissues that were frozen at −80°C showed the greatest activity, with 62.8 U of CAT/mg of protein (p < 0.0001), although liver tissue (Fig. 1D) showed a decrease in CAT activity. At time 0, liver tissue showed 44.6 U of CAT/mg of protein, but after 15 (25.2 U), 30 (16.8 U), and 60 (20.8 U) days, CAT activity decreased (p < 0.0001). CAT in brain tissue (Fig. 1F) showed decreased activity only at 60 days of freezing (p < 0.0393).
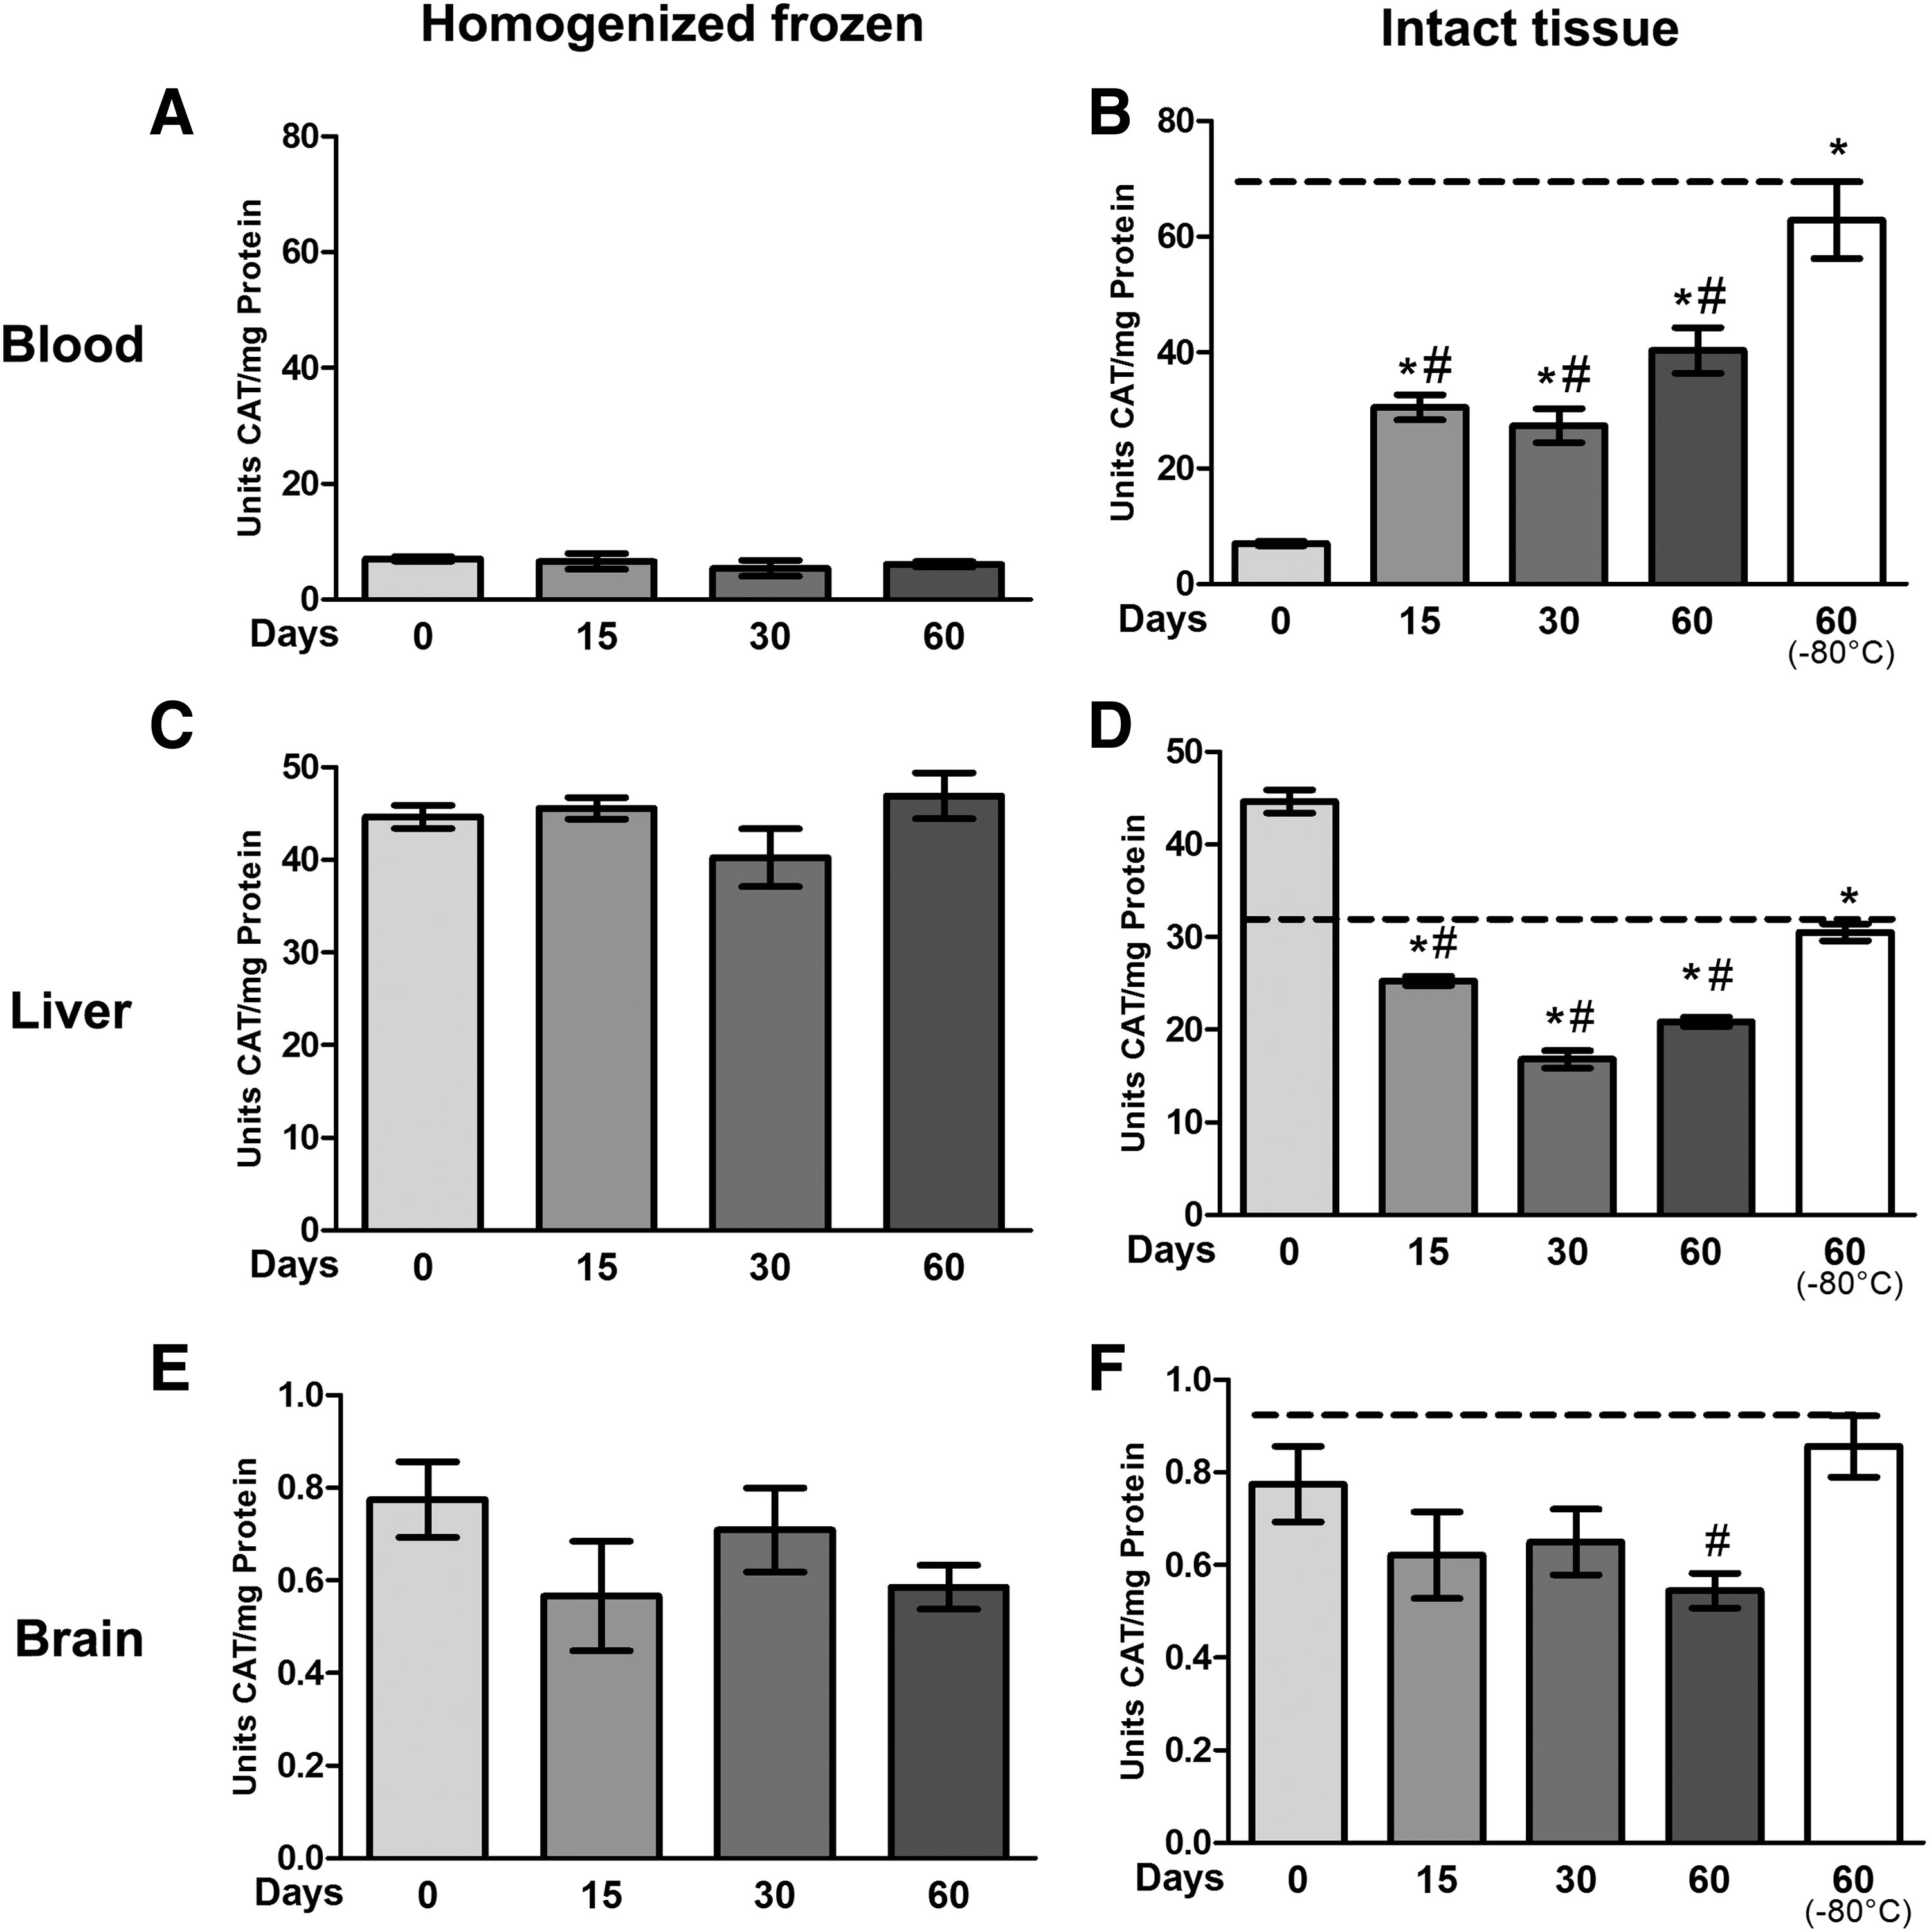
Effects of freeze-thaw and storage on CAT activity in the blood, liver, and brain.
We also observed that freeze-thaw cycles resulted in a significant decrease in the SOD activity. Frozen blood homogenates (Fig. 2A) demonstrated a sharp decrease in SOD activity after the first time analyzed (time 0), with 52.1 U of SOD activity. After 15 days, this activity decreased to 7.4 U; at 30 days, it was 1.8 U; and at 60 days, the activity was not detectable (15, 30, and 60 days, p < 0.0001). The blood (Fig. 2B) that was frozen intact and prepared only at the moment of analyses had a subtle decrease at 15 days (day 0 = 52.1 U, day 15 = 49.6 U). At 30 and 60 days at −20°C and 60 days at −80°C frozen, the results were similar (30 days = 30.8 U, 60 days = 26.2 U, and 60 days in −80°C = 32.6 U, p < 0.05). In frozen homogenized liver tissue (Fig. 2C) at 0, 15, 30, and 60 days, SOD results were similar: there was only a small decrease at 30 days (p < 0.05). In frozen intact liver tissue (Fig. 2D), the result was very different from that at time 0. SOD activity was 64.2 U at time 0, while at 15 days, the activity decreased to 31.1 U; at 30 days, it was 25.3 U; and at 60 days the activity was 30.9 U (p < 0.0001). Liver tissue stored at −80°C showed less SOD activity than that at time 0; however, this activity was greater than that for frozen (−20°C) at 15, 30, or 60 days (p < 0.05).
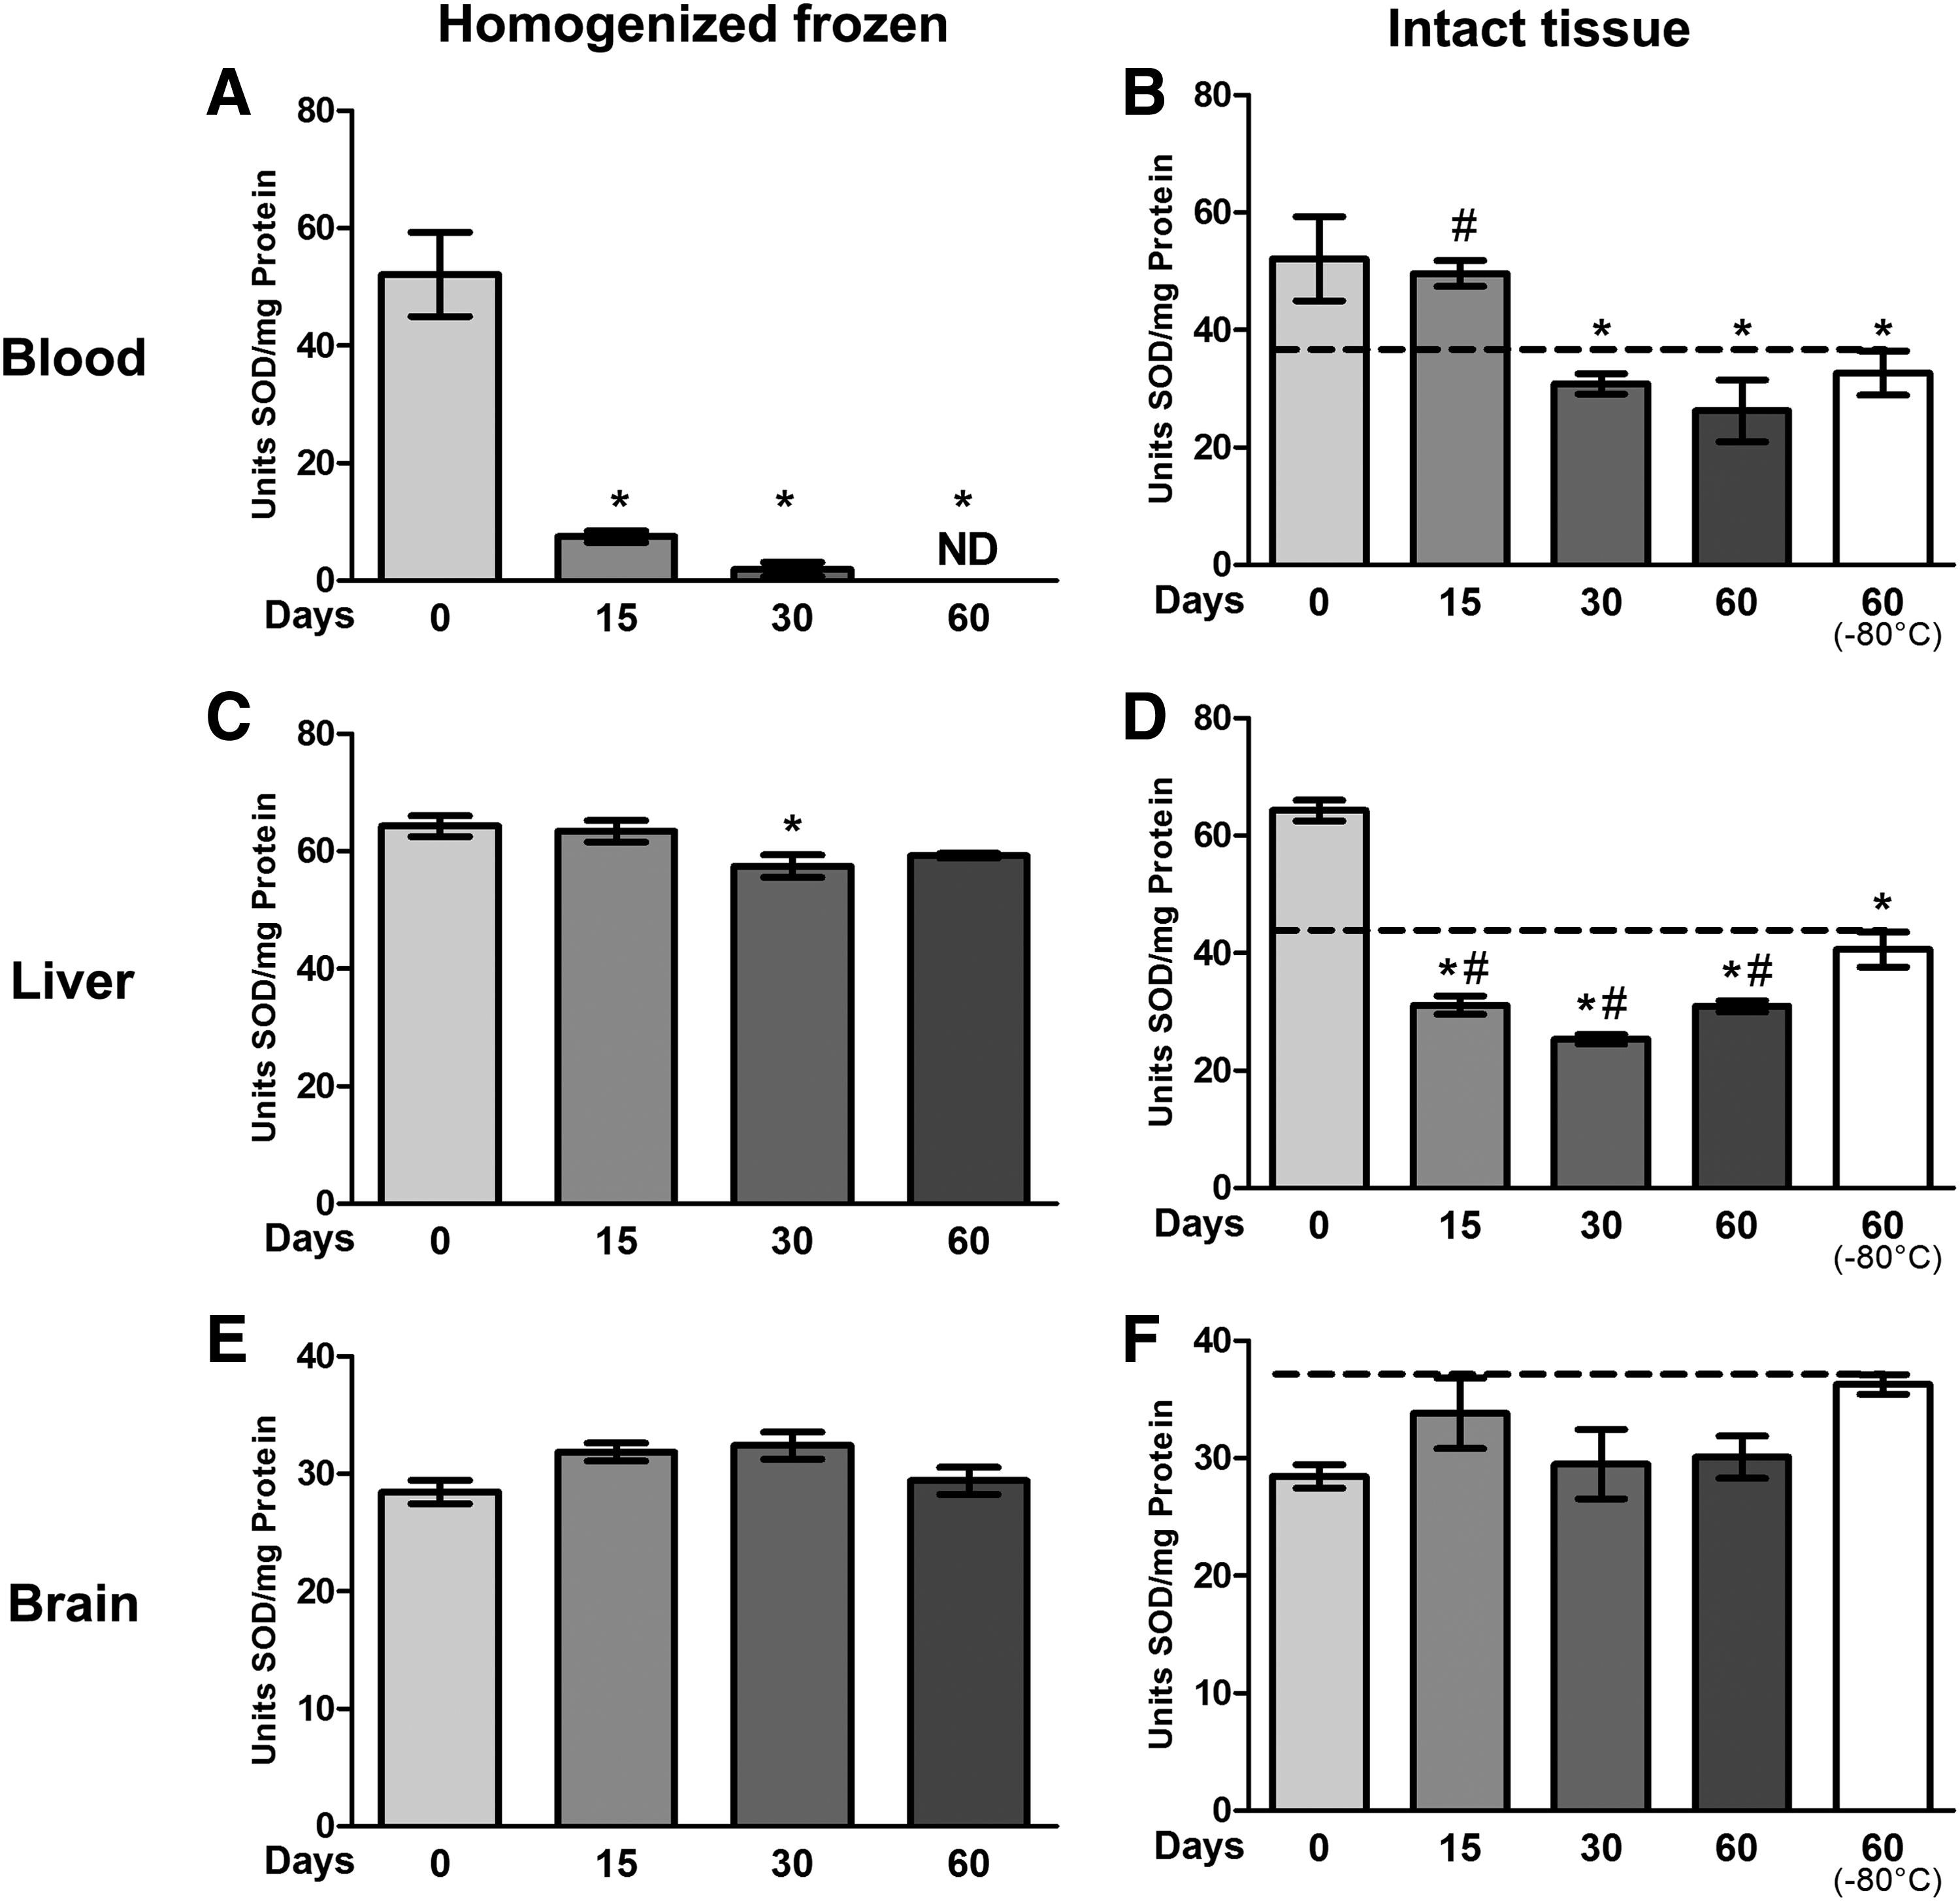
Effects of freeze-thaw and storage on SOD activity in blood, liver, and brain.
Brain tissue did not show a statistically significant difference between frozen homogenized samples (Fig. 2E) and frozen intact tissues (Fig. 2F).
Oxidative damage markers (carbonyl and SH)
Oxidative damage to proteins was determined through carbonyl groups. Frozen homogenized blood samples (Fig. 3A) did not present any difference between days. The frozen intact blood (Fig. 3B) showed increased carbonylated proteins only at 30 days (p < 0.05). However, the tissue stored for 60 days in −80°C showed a decrease at all time points (15, 30, and 60 days, p < 0.0001), including time 0 (p < 0.05). Frozen homogenized liver samples showed an increase in carbonyl levels at 30 and 60 days of storage (p < 0.0018) (Fig. 3C). In intact tissue (Fig. 3D), there was no difference in carbonyl levels between times. In frozen homogenated aliquots of brain tissue, we found the same result as with liver: carbonyl levels were increased at 30 and 60 days (p < 0.001) (Fig. 3E). In intact tissue (Fig. 3F), only at 30 days was a significant increase in carbonyl levels observed (p < 0.001).
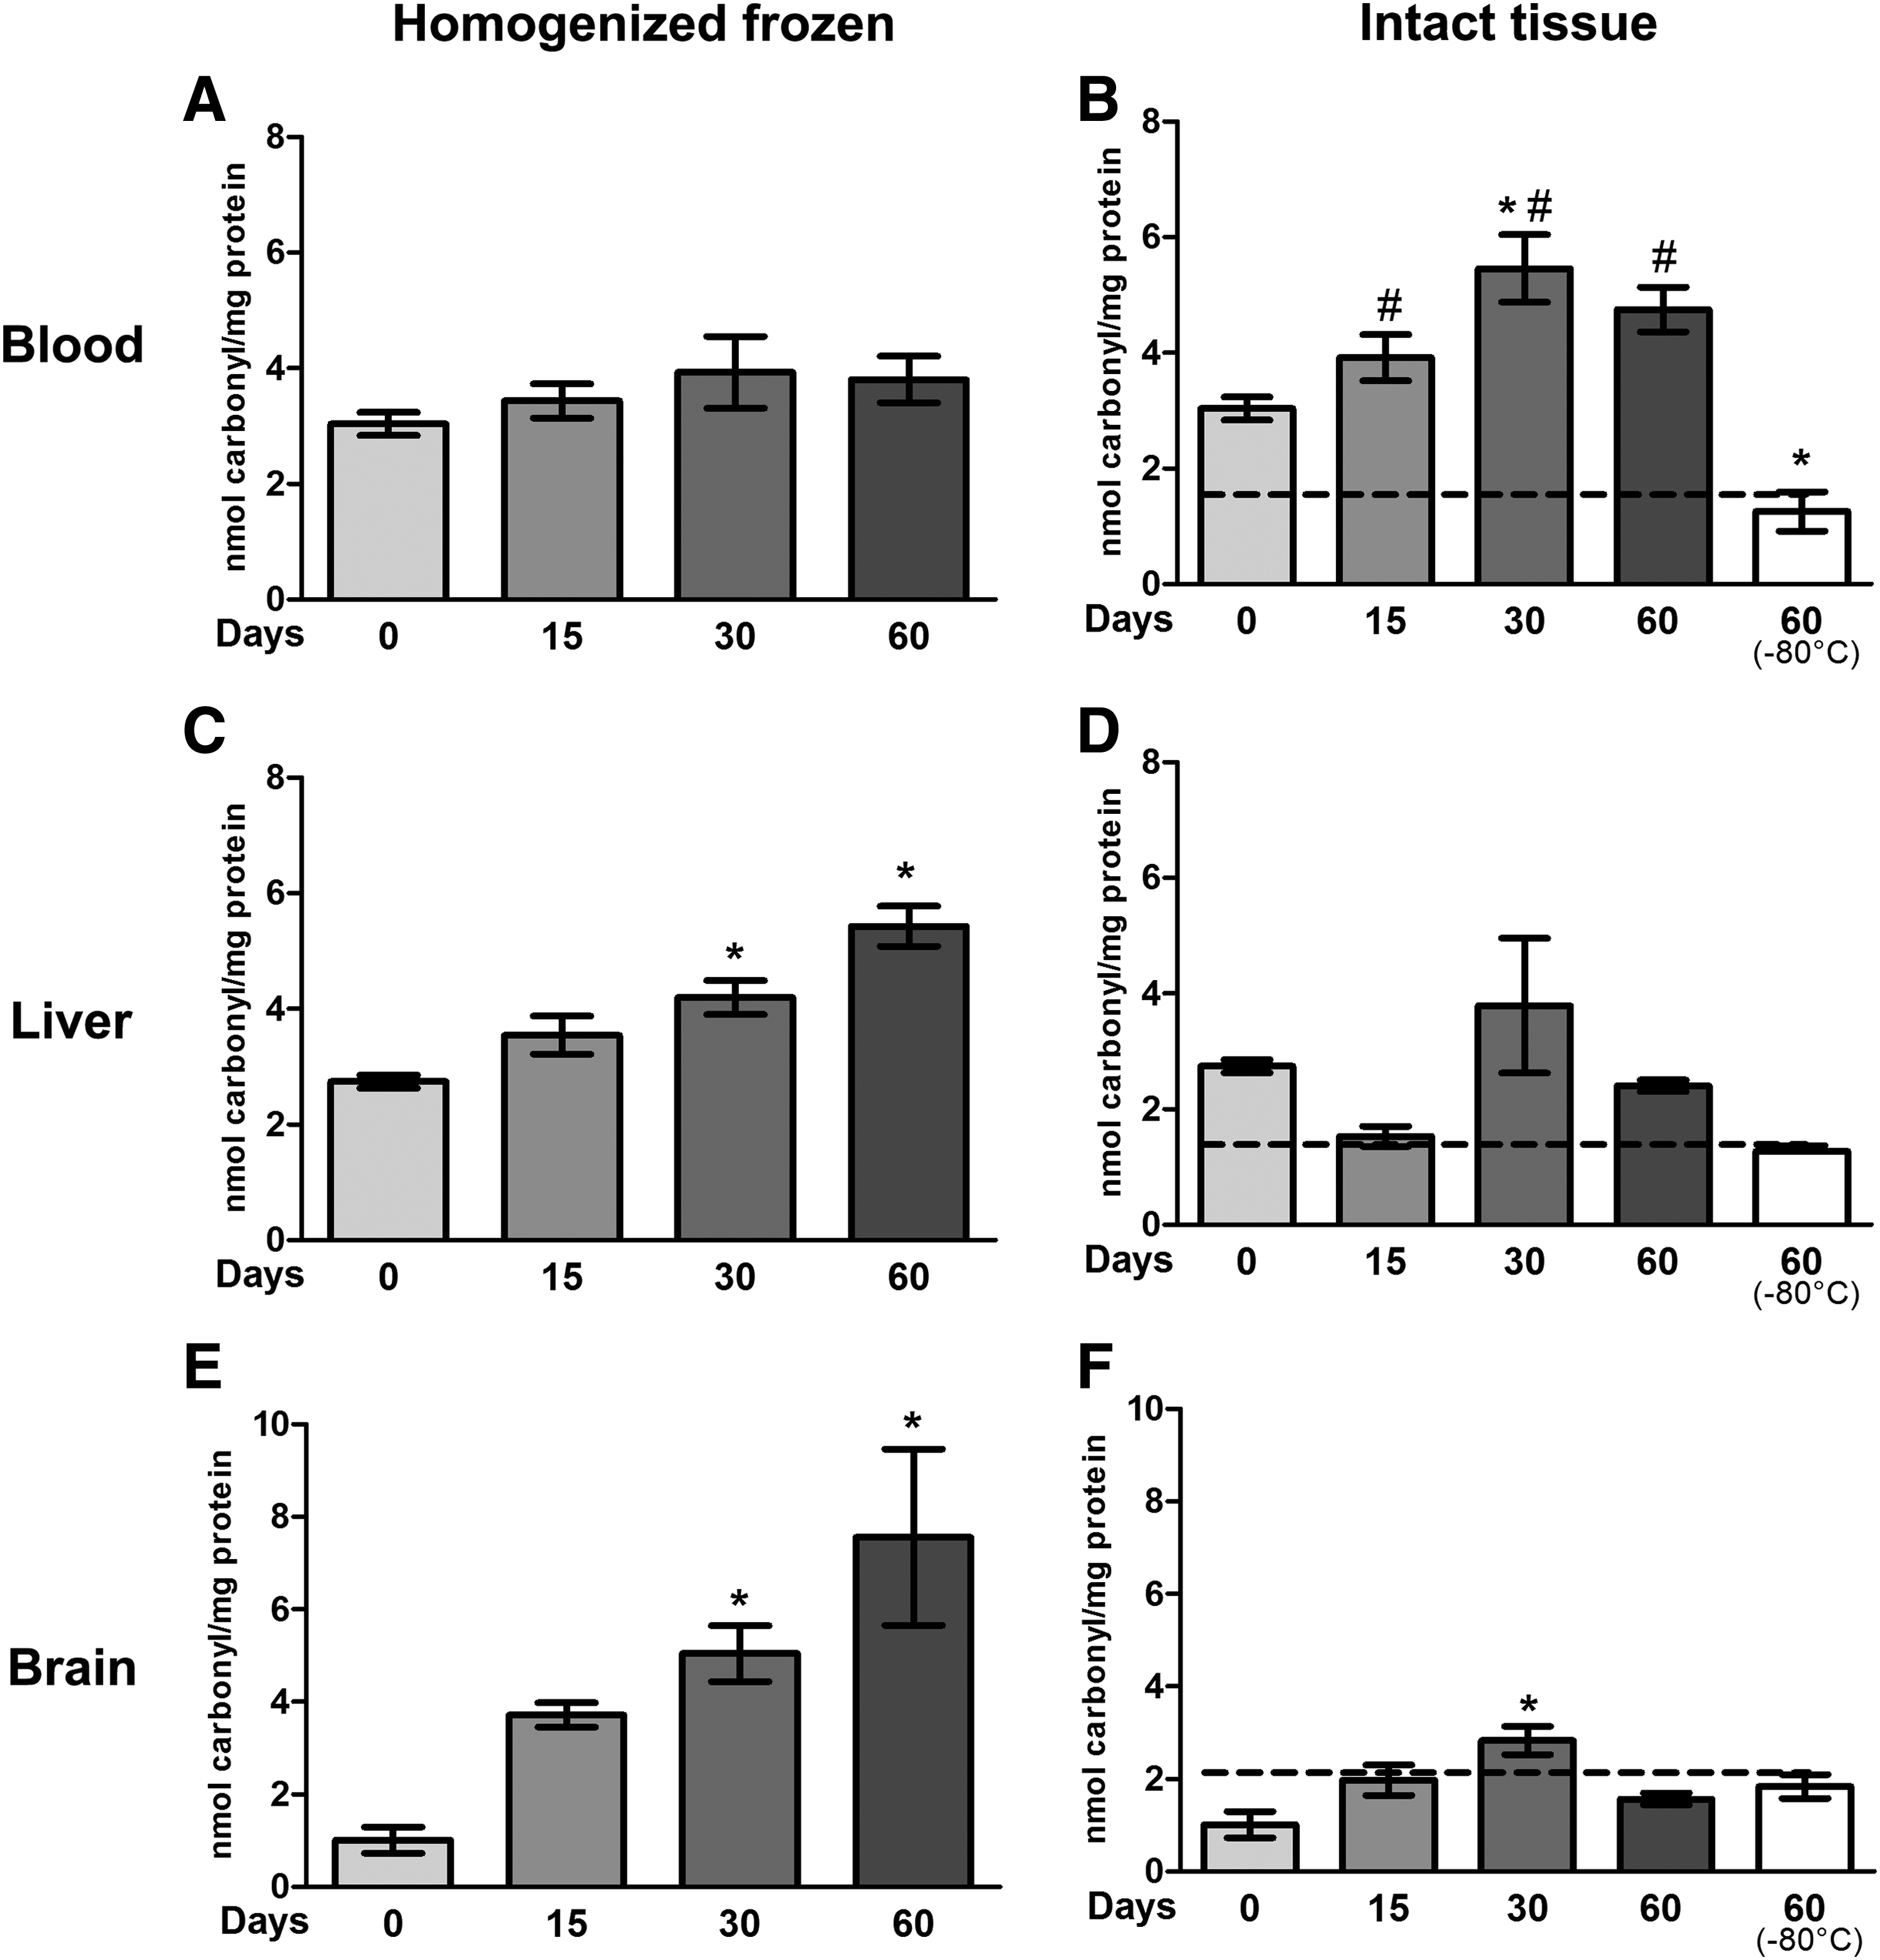
Effects of freeze-thaw and storage on protein damage in blood, liver, and brain.
Oxidative damage to thiol groups was determined by SH content. Blood, homogenized and frozen (Fig. 4A), showed a decrease in SH content after 15 days; this decrease persisted to 30 and 60 days at −20°C (p < 0.0002). This result was the opposite of that found in intact tissue (Fig. 4B) at 15 days, and there was an exponential increase in SH content at 30 and 60 days, including 60 days in −80°C (p < 0.0001). Frozen homogenized liver samples (Fig. 4C) showed a decrease in SH content at all times after time 0 (15, 30, and 60 days, p < 0.0001). In intact liver tissue (Fig. 4D), there was a decrease in SH at all times (p < 0.0001), but at 60 days stored in −80°C, the SH content was statistically greater than at the other times (p < 0.0001) except for time 0 (statistical difference, time 0, p < 0.05). Brain, homogenized and frozen, showed a decrease at day 15 (p < 0.0001), 30 (p < 0.005), and 60 (p < 0.0001) of storage (Fig. 4E). Intact brain tissue (Fig. 4F) showed a decrease in SH content at 15 and 30 days, and this was more evident at 60 days (p < 0.0001). Sixty days in −80°C resulted in greater SH content than 60 days in −20°C. However, SH content was not greater than at 15 and 30 days.

Effects of freeze-thaw and storage on SH content in blood, liver, and brain.
Hemospectrum
There were three evident maximum absorbance peaks (410, 540, and 580 nm) (Fig. 5C). The bands at 570 and 540 nm are attributed to oxyhemoglobin, and the band at 410 is assigned to hem-hem interaction. 13 The peak at 410 nm was the most remarkable. Frozen homogenized blood samples (Fig. 5A) at 15, 30, and 60 days demonstrated a decrease in absorption at 410 nm (p < 0.05). In contrast, spectrum analysis of intact tissues (Fig. 5B) showed a time-dependent increase in absorption at 410 nm (p < 0.0001), and 60 days in −20°C and 60 days in −80°C had the same absorption.
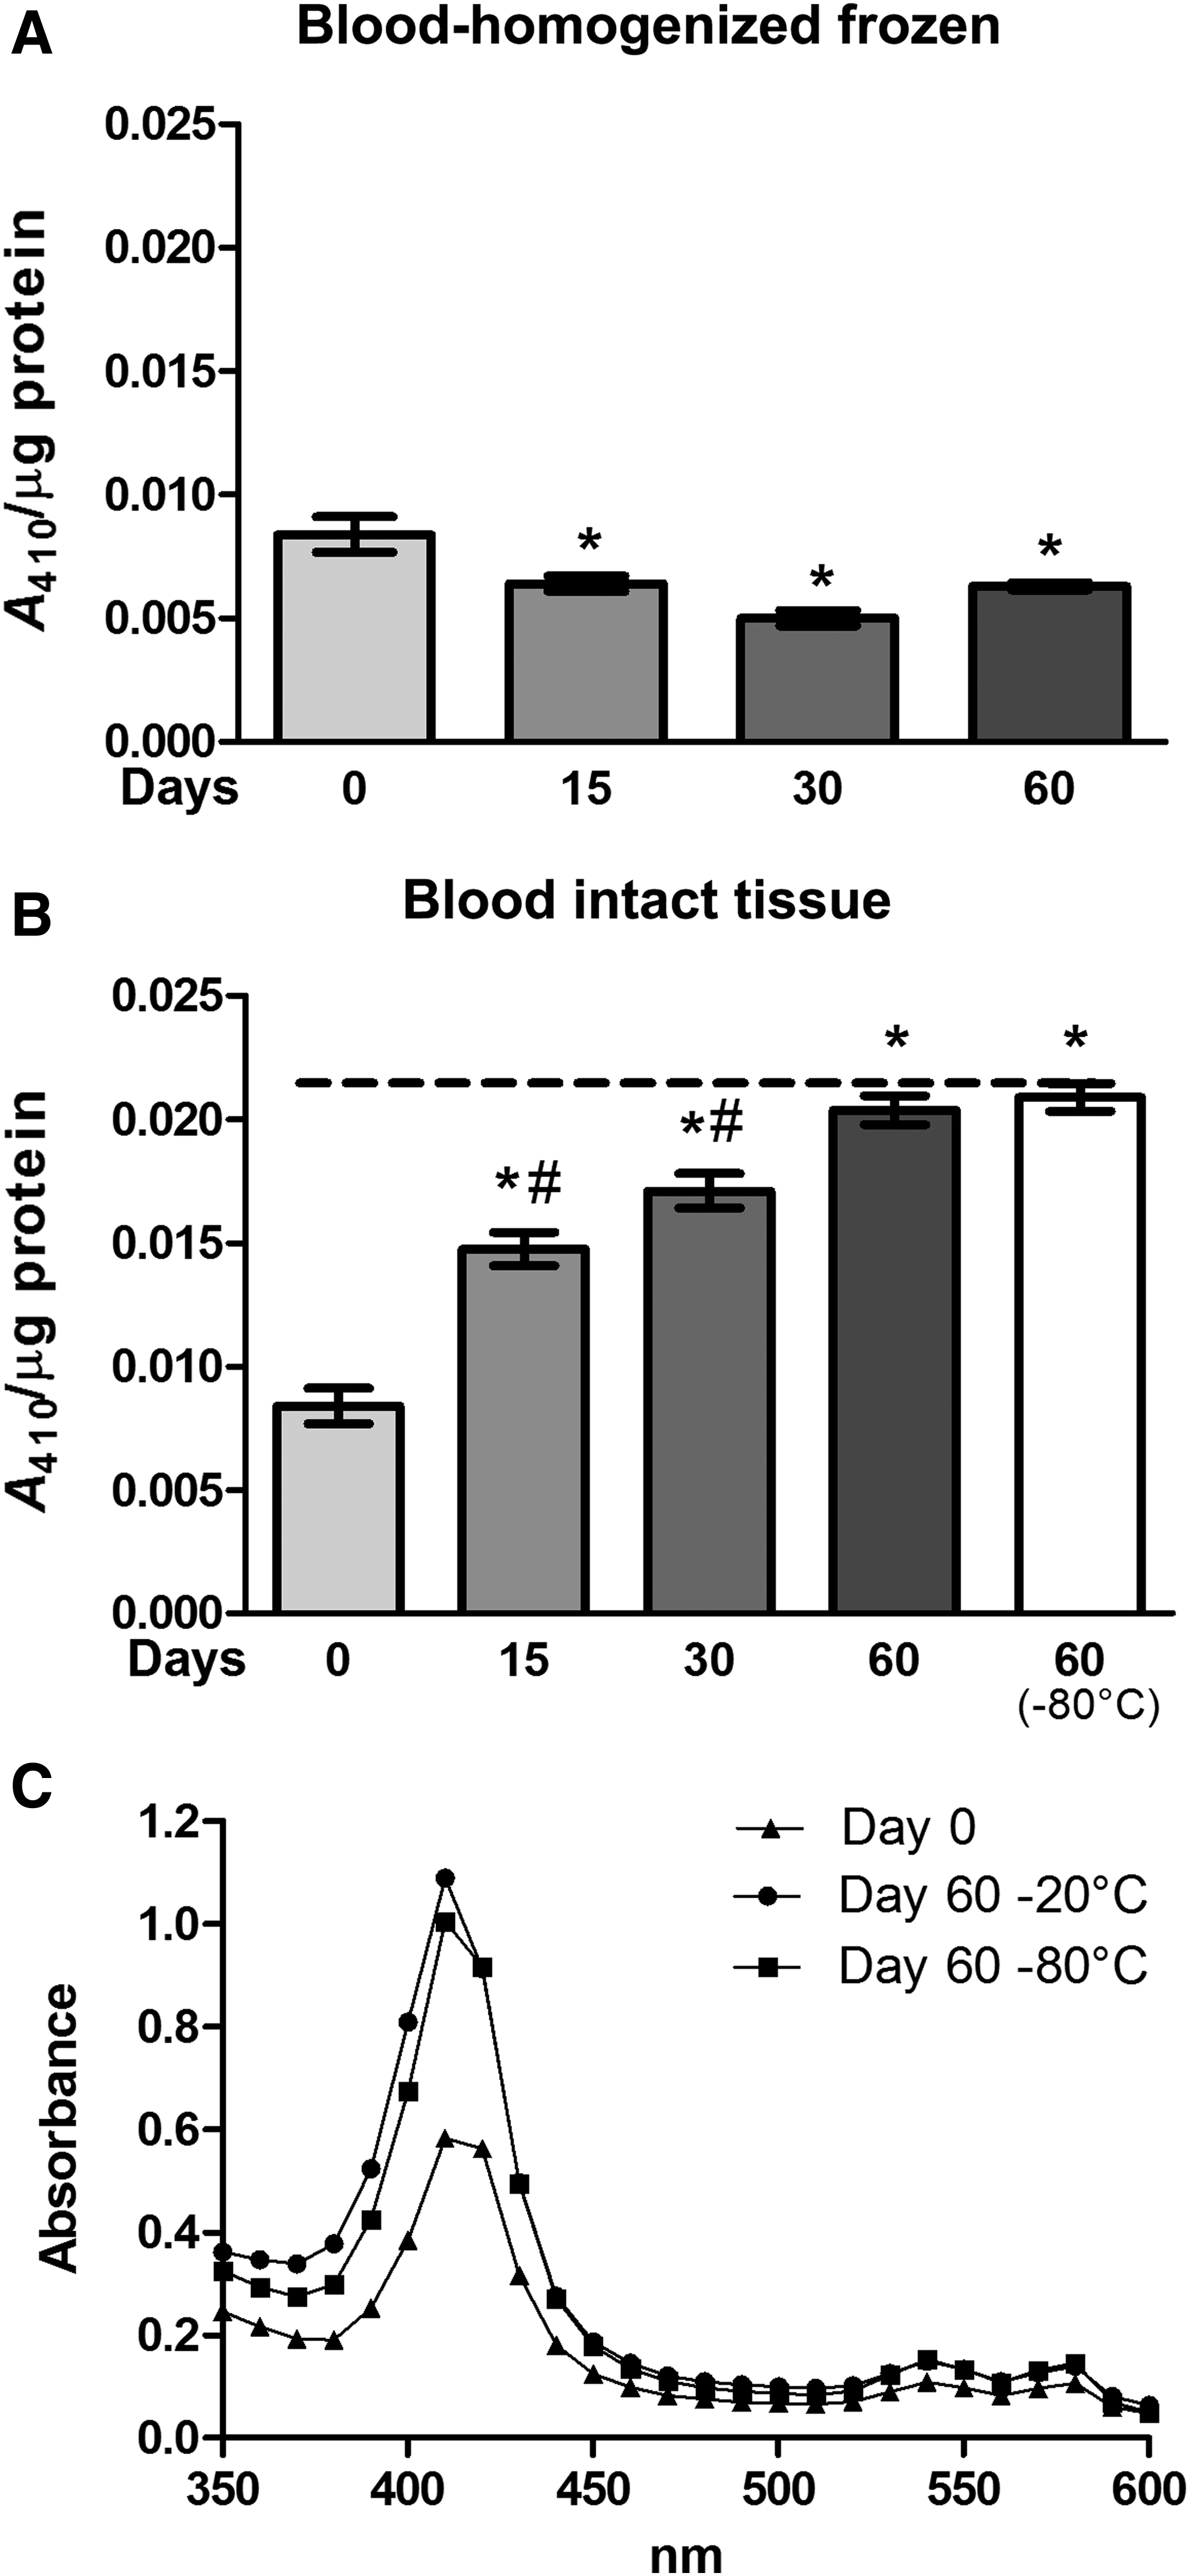
Effects of freeze-thaw and storage on spectrum changes in blood samples.
Western blotting
Freeze-thawing and storage time did not modulate the immunocontent of CAT (Fig. 6A, B) and SOD1 (Fig. 6C, D) in blood, liver, and brain of frozen homogenized samples or intact tissue. Direct evaluation of frozen homogenized samples and intact tissues showed that there was no difference between times and or samples in CAT (Fig. 6E) and SOD1 immunocontent (Fig. 6F).

Effects of freeze-thaw and storage on CAT and SOD immunocontent.
Discussion
We evaluated the effects of freeze thawing on blood, liver, and total brain of rats. The storage was conducted in two temperatures (−20°C and −80°C) and with two distinct sample preparations: frozen homogenized aliquots and intact tissues. Enzymatic activity, protein oxidative damage, and immunocontent of proteins were measured.
The activities of two relevant antioxidant enzymes (CAT and SOD) were modified after the freeze-thaw process. The loss of intracellular CAT and SOD activity in tissues after freezing and thawing might be due to altered membrane integrity and increased permeability as a consequence of membrane damage during the freezing process.1,15,16 It is known that freezing may result in the loss of tertiary structure, denaturation, irreversible protein aggregation, and consequently, loss of catalytic function.17,18
Diverging from the other enzymatic results, CAT activity was increased in intact blood. The significant increase in CAT activity with a freeze-thaw cycle may be due to erythrocyte lysis, because at time 0 the samples were not frozen. Freeze-thaw cycles are a common way to lyse RBCs for many analyses. 19 The rise in CAT activity can be considered a consequence of the enhanced content of its substrate (H2O2), which is converted to oxygen and water. 20
Regarding the blood spectrum analysis, we observed that the absorbance increased in the three peaks with storage time in both temperature −20 and −80°C when blood was stored in full (Fig. 5B, C). In contrast, in frozen homogenized blood samples we observed a decrease in absorption at 410 nm. A large amount of precipitated material was observed in frozen homogenized blood samples (Supplementary Fig. S2), which possibly is due to hemoglobin aggregation. 21 This precipitated material may explain the decrease in absorption at 410 nm observed in frozen homogenized blood. Moreover, we observed blood browning (when blood turns from bright red to brownish red) in frozen homogenized and intact blood samples at −20°C (Supplementary Fig. S2). A previous study 13 involved adding different concentrations of ozone (which is a strong oxidative compound) to blood, and observed an increase in spectra absorption similar to our study. Therefore, an increase in absorption of all spectra ranges and color change may be a result of the pro-oxidative environment caused by freeze-thaw and storage.
Oxidative stress can be evaluated by quantifying ROS or antioxidants and can be measured through oxidative stress end products. 22 Protein oxidation may be an effect of high levels of ROS, resulting in protein carbonylation and oxidative damage. 23 Our findings on carbonyl content revealed that in most cases the homogenized tissues are more susceptible than intact tissue. These results highlight an important fact: the tissue that was stored intact appeared to protect proteins against oxidative damage, while the samples that were stored homogenized (in aqueous solution) were more vulnerable to ROS. This is probably because there was no protective structure, like a membrane, and little protein content, so the freeze-thaw process could induce stresses, including denaturation and destabilization of proteins, resulting in oxidative damage.17,24
Quantification of reduced thiol groups indicates the redox state of proteins containing SH groups that may undergo oxidation or reduction and form disulfide bonds. 25 Frozen homogenized blood showed a decrease in SH groups in all times. Intact frozen blood demonstrated the opposite effect: there was an increase over time. A decrease in SH groups was observed in liver and brain with both storage methods (homogenized and intact tissue). These data provide evidence that freeze and thawing induces increases in thiol oxidation levels in three tissues (blood, liver, and brain). These data corroborate other studies, which show that thiol groups are sensitive to oxidation and degradation during sampling and storage.26,27 Intriguingly, the intact blood was the only sample that showed an increase in SH groups. This observed phenomenon may be a result of color interference because the reading at 412 nm (for measurement of SH groups) is extremely near to 410 nm, which was the maximum absorbance peak in the blood spectrum, and increased with freezing time. Moreover, the decrease in frozen homogenized blood may be a consequence of two forces: oxidation of SH groups and color interference (the readings in frozen homogenized blood also decreased). If there is an interference phenomenon, then the SH group analysis by DTNB reaction should not be performed on blood.
We used western blots to investigate the content of CAT and SOD1/Cu-Zn in blood, liver, and brain to compare the activities of these enzymes and determine whether there was any relationship between activity and immunocontent. We evaluated two different situations: First, we measured the difference between times 0, 15, 30, and 60 days, for each kind of cryopreservation (homogenized and intact tissue). Second, we investigated the difference between homogenized and intact tissue and time (15, 30, 60 days, and 60 days at −80°C). Our results showed that there was no significant difference in CAT or SOD, independent of the time or type of cryopreservation. This result demonstrates that freeze-thaw effects, such as protein denaturation or oxidation, do not interfere with the immunocontent of these enzymes. Therefore, the results found in enzyme activities had no relation with enzyme immunocontent.
According to our results, freezing time interfered in the evaluated parameters. Freezing can denature proteins and change solute concentrations due to the crystallization of water, eutectic crystallization of buffer solutes, and resultant pH changes. 24 The tissues that were stored intact appeared to retain some characteristics that were not maintained in the homogenized samples. The intact tissue showed greater structural integrity, keeping the biochemical substrates for basic physiological functions and resulting in less oxidative damage and higher antioxidant activity than in homogenized samples, and minimizing the oxidative stress caused by free radicals. Generally, however, the best option is to use fresh samples.
Taking all of the results together, we have a consistent and concerning conclusion: that the freeze-thaw process culminates in a difference in redox status of samples stored at distinct times. Samples frozen for longer periods are more vulnerable to oxidative stress and can be considered unstable in comparison with fresh samples.
Conclusion
Our results indicate that storage at −20°C affects redox parameters more than at −80°C. Storage for a long time may compromise the samples, leading to alterations in oxidative stress parameters.
Homogenized samples show increases in protein damage with longer storage periods, changing drastically the results found in the first moment evaluated. Another parameter that had strong alterations was oxidation of SH groups (except for intact blood). These results will require modification of experiments that require whole protein.
Our results indicate that experiments that require a protein's original conformation (enzyme activity) or regarding protein oxidation detection will be compromised as a result of freezing, storage time, and cycle freeze-thaws. The immuncontent of proteins evaluated in this study were not affected by the freezing process since western blots analyses are performed with denatured proteins.
Frozen intact tissues had better preserved redox characteristics compared to frozen homogenized tissues. The sample freezing time should be strictly controlled to reduce interference with results, and freeze-thaw cycles should be avoided. Additionally, we recommend freezing of nonhomogenized samples at −80°C if long storage times are necessary. Finally, efforts may be necessary to test different buffers with different cryopreservation options to reduce the effects of freezing.
Footnotes
Acknowledgments
The Brazilian research funding agencies: Conselho Nacional de Desenvolvimento Científico e Tecnológico (CNPq) and Fundação de Amparo à Pesquisa do Estado do Rio Grande do Sul (FAPERGS) supported this work.
Author Disclosure Statement
No conflicting financial interests exist.
References
Supplementary Material
Please find the following supplemental material available below.
For Open Access articles published under a Creative Commons License, all supplemental material carries the same license as the article it is associated with.
For non-Open Access articles published, all supplemental material carries a non-exclusive license, and permission requests for re-use of supplemental material or any part of supplemental material shall be sent directly to the copyright owner as specified in the copyright notice associated with the article.