




Abstract
The notion of attributing user fees to researchers for biospecimens provided by biobanks has been discussed frequently in the literature. However, the considerations around how to attribute the cost for these biospecimens and data have, until recently, not been well described. Common across most biobank disciplines are similar factors that influence user fees such as capital and operating costs, internal and external demand, and market competition. A biospecimen user fee calculator tool developed by CTRNet, a tumor biobank network, was published in 2014 and is accessible online at www.biobanking.org. The next year a survey was launched that tested the applicability of this user fee tool among a global health research biobank user base, including both cancer and noncancer biobanking. Participants were first asked to estimate user fee pricing for three hypothetical user scenarios based on their biobanking experience (estimated pricing) and then to calculate fees for the same scenarios using the calculator tool (calculated pricing). Results demonstrated variation in estimated pricing that was reduced by calculated pricing. These results are similar to those found in a similar previous study restricted to a group of Canadian tumor biobanks. We conclude that the use of a biospecimen user fee calculator contributes to reduced variation of user fees and for biobank groups (e.g., biobank networks), could become an important part of a harmonization strategy.
Introduction
B
Establishing and sustaining a biobank is expensive, and start-up costs, as well as infrastructure, investment, and operating costs, represent a substantial and ongoing investment. 4 A large proportion of biospecimen use in research involves analyzing the connection between a gene or marker in a biospecimen and the evolution and outcome of a disease or disorder. Therefore, it is implicit that much of this research cannot proceed without access to biospecimens and data collected and stored over time.
In a discipline where funding has thus far been insecure and sustainability is a major obstacle, establishing a biobank cost structure facilitates the understanding of cost drivers and pressure. 5 This, in turn, aids the biobank to consider other funding opportunities (e.g., industry partnerships, cost recovery strategies, and grant funding). Given the worldwide need for biospecimens for research to support precision medicine, failure to plan and act upon the issues around biobank sustainability is a risk that is too great to ignore.
The topic of biobank sustainability has received considerable attention recently in the discipline of biobanking.6,7 Several authors have shared sustainability measures used in their biobanks8–13 and others have offered tools and solutions to aid biobanks working toward a sustainable process.14,15 One mechanism to use as part of an overarching biobanking sustainability strategy is a cost recovery mechanism in the form of biospecimen user fees. 14
The CTRNet group has previously published on the creation and availability of a biospecimen user fee calculator that incorporates the concepts of biobank activities to aid biobanks in modeling the costs of appropriate user fees. 14 Originally designed and tested for tumor biobanking, this tool can be used by different types of human and enviro-bio focused biobanks (e.g., disease and population focused), both tumor and nontumor alike. In the long term, use of a biospecimen user fee tool may guide users in creating a more consistent biobank fee structure and promote transparency in discussion of such fees with external stakeholders (e.g., research customers, host institution administration, and funders).
The authors of this article held a workshop at the International Society of Biological and Environmental Repositories (ISBER) 2015 Annual Meeting and Exhibits Phoenix, AZ, entitled “Your Biobank User Fees: theory, practice and determining your potential user fees with the use of the Biobank Resource Center user fee calculator.” The objectives of the workshop were threefold: (i) expose a global audience to a biospecimen user fee calculator; (ii) acquire feedback on the calculator and attitudes toward user fees; and (iii) assess the behavior of how people create biospecimen user fees in different biobank disciplines (disease, population, and other types of biobanks; tumor and nontumor biobanks). This article describes the methodology and outcomes related to the workshop activities.
Methods
Online survey: participant invitation and access
For the purpose of the workshop, participants attending the ISBER 2015 Annual Meeting and Exhibits were invited to participate in an online survey formulated in three parts. Part 1 examined demographic details about participants and their biobank (Appendix 1).
Part 2 (Appendix 2) described a hypothetical biobank and introduced three biospecimen and data release scenarios to guide the utilization of the tool (available at www.biobanking.org). 17 This exercise examined different approaches to deriving biospecimen user fees. Survey participants were asked to estimate user fees based on three biobank release scenarios increasing in complexity. The data and information for these scenarios were based on the details provided about the biobank. The participant was requested to first make an estimate of user fees and then calculate user fees using the biospecimen user fee calculator tool; and comparison between the estimated and calculated user fees was generated. Part 3 asked feedback questions related to the participant's use of the calculator tool and how the participant's biobank would develop user fees in the future (Appendix 3).
The online survey was available for a period of 8 weeks (4 weeks before and 4 weeks following the workshop) in April–June 2015. The survey was conducted using a web-based application created by the Biobank Resource Center. 16 Invitations to participate were distributed to members on the ISBER mailing list (with assistance of the ISBER Head Office staff); postings on biobanking forums; social media venues (e.g., LinkedIn™); and through personal contacts.
Results
Demographics of survey respondents
Respondents to the survey provided answers online between April 10th and June 1st, 2015. Thirty-one percent (13/42) of respondents completed the entire survey; while 69% (29/42) left some questions unanswered and did not complete the full questionnaire. The majority of survey participants were from North America (61.9%, n = 26) and Europe (23.8%, n = 10), with a smaller number of respondents from Asia (9.5%, n = 4), Australasia (2.4%, n = 1), and the Middle East (2.4%, n = 1) (Supplementary Fig. S1A; Supplementary Data are available online at www.liebertpub.com/bio). The participants from these areas reflect the international scope of membership in ISBER.
Over half of the biobanks participating in the survey had a disease-oriented accrual focus: Disease focus only (35.7%, n = 15), Disease and Population (26.2%, n = 11), and one biobank had a combination of Disease and Other collection focus (2.4%). One-fifth were solely population-based repositories (19.0%, n = 8), the final portion 14.3% described themselves as “Other” (n = 6) (Supplementary Fig. S1B), and one participant did not respond to this survey question (2.4%). Our survey respondents were mostly composed of cancer biorepositories (45.2%, n = 19). Thirteen participants/biobanks did not respond to this question (31%). And the remaining biobanks focused on the following disease types: 7.1% Brain (n = 3), 4.8% Infection (n = 2), 4.8% Other (n = 2), 2.4% Cardiovascular (n = 1), 2.4% Pulmonary (n = 1), and 2.4% Renal (n = 1). Thirty-one percent of participants did not respond to this question (Supplementary Fig. S1C).
Among the biobanks participating in our study, 71.4% had a poly-user structure (n = 30), 18 21.4% were oligo-user biobanks, and only three were mono-user biobanks (7.1%) in our data set (Supplementary Fig. S1D). About 61.9% of participants represented mature biobanks (n = 26), with 33.3% working in biobanks still in development (n = 14) and 4.8% in the conceptualizing phase (n = 2) (Supplementary Fig. S1E). There was a wide range of experience in biobank operation reflected in our survey participants. About a quarter of biobanks had been operating for up to 4 years, about one-third for 5–10 years, and the remainder for 11 years or more, respectively.
Two participants did not respond to this question (Supplementary Fig. S1F). Almost two-thirds of survey respondents had over seven or more years of experience (64.3%, n = 27) in the discipline of biobanking (Supplementary Fig. S1H). The majority were biobank managers (61.9%, n = 26), and 31.0% were biobank directors (n = 13), providing a good representation of individuals working in the management and operation aspects of biobanking (Supplementary Fig. S1G, H).
User fee estimation and calculation
Fourteen biobankers completed all three user fee scenarios (North America = 7; Europe = 3; and one from each of Australasia, the Middle East, and Asia) and a comparison between the estimated user fees and calculated user fees using the calculator tool was generated (Figs. 1 and 2).
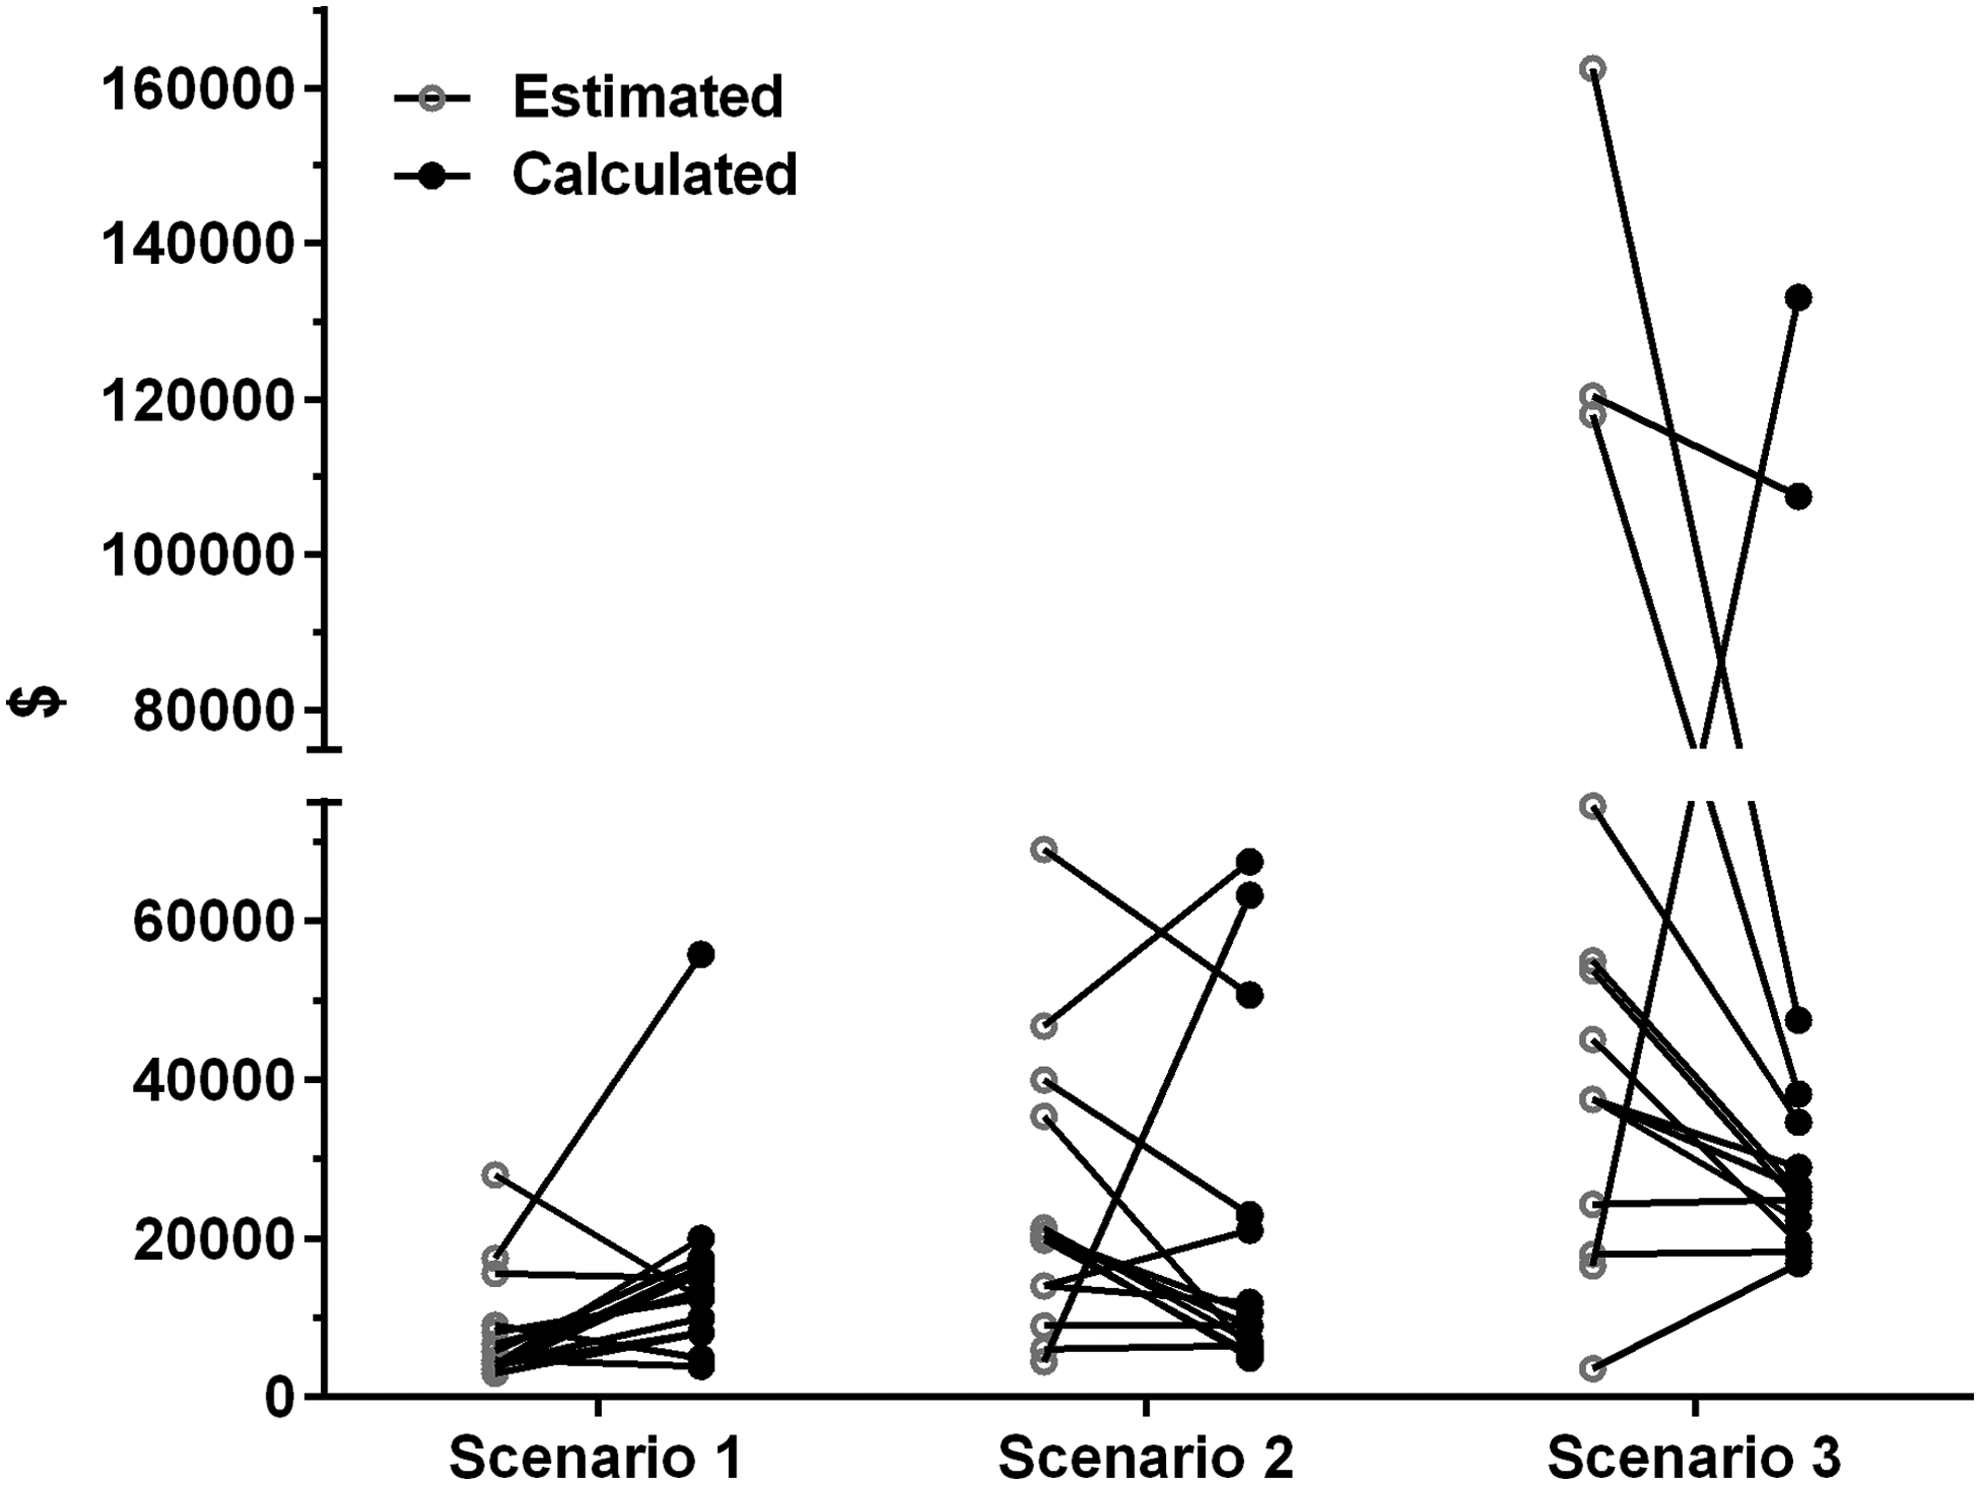
Given three scenarios escalating in difficulty, biobanks (n = 14) were asked to estimate user fees using their own methods (Estimated) and using the User Fee Calculator Tool (Calculated). The discrepancy between the estimated fees and the calculated fees increases with the difficulty of the user fee scenario. For Scenario 1—for Estimated: $8490 mean, $5255 median, and $28,000–3000 range; for Calculated: $15,241 mean, $12,890 median, and $55,776–3908 range. For Scenario 2—for Estimated: $24,361 mean, $20,378 median, and $69,050–4500 range; for Calculated: $21,154 mean, $9,882 median, and $67,522–4919 range. For Scenario 3—for Estimated: $57,443 mean, $41,315 median, and $162,500–3617 range; for Calculated: $40,614 mean, $26,183 median, and $133,057–16,858 range.
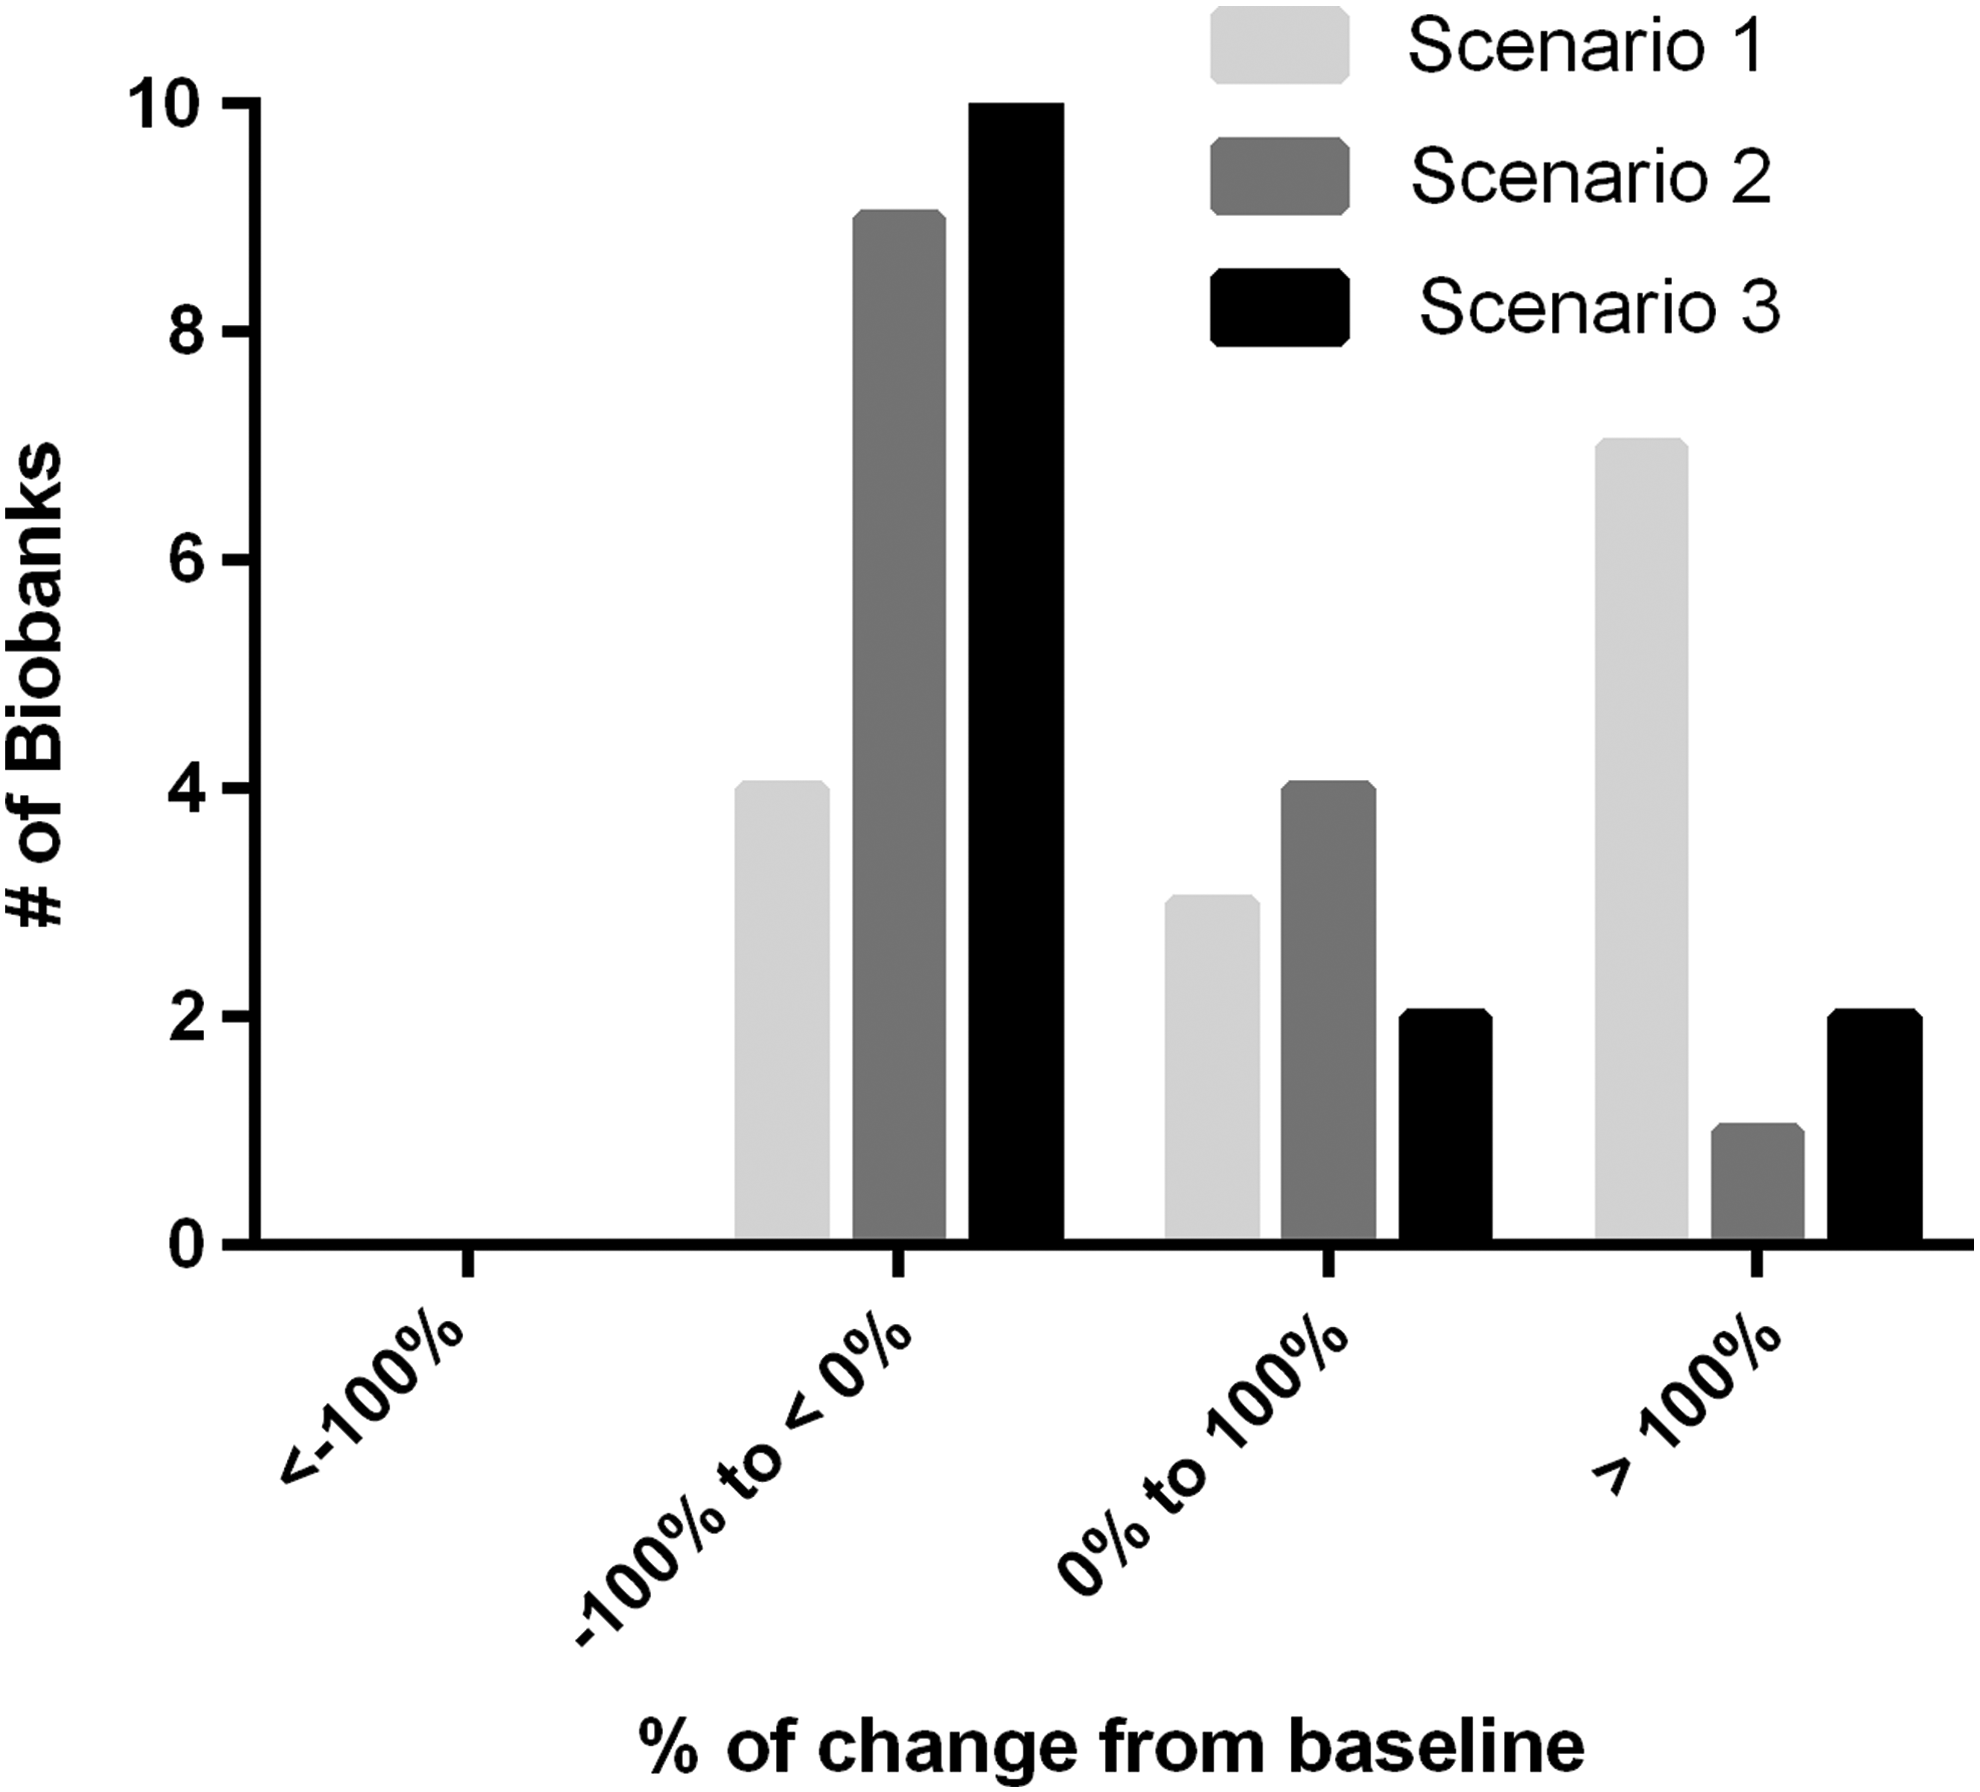
Comparison between estimated and calculated user fees among biobanks when presented with three user fee scenarios increasing in complexity. Values from baseline were a percentage of calculated value as a percentage of the estimate value (100/est. value × calc. value) and then percentage change from the estimated value (value of 1) – 100. For Scenario 1, most of the biobanks underestimate the value/cost (0%–100% and >100% from baseline), whereas in Scenario 2 and most of all in Scenario 3, value/cost is overestimated by biobanks (−100% to <0% from baseline).
The range of distribution of estimated user fees increased alongside increasing scenario complexity with a $8490 mean, $5255 median, and $3000–$28,000 range for Scenario 1 estimates; for Scenario 2, estimates were as follows: $24,361 mean, $20,378 median, and $4500–$69,050 range; and for Scenario 3, estimates were as follows: $57,443 mean, $41,315 median, and $3617–$162,500 range. The same was observed for calculated fees using the calculator tool with a $15,241 mean, $12,890 median, and $3908–$55,776 range for Scenario 1; for Scenario 2, calculated fees were as follows: $21,154 mean, $9882 median, and $4919–$67,522 range; and for Scenario 3, calculated fees were as follows: $40,614 mean, $26,183 median, and $16,858–$133,057 range.
While the estimated and calculated user fees were relatively close for Scenario 1, the discrepancy between the methods grew for Scenarios 2 and 3 (Fig. 2). For Scenario 1, most of the biobankers underestimate the value/cost of released biospecimens and data (71%, 10/14; Fig. 2: 0%–100% and >100%), whereas in Scenario 2 (64%, 9/14) and more in Scenario 3 (71%, 10/14), the value/costs are overestimated when the calculator was not used (Fig. 2: −100% to <0%). In Scenario 1, the estimated cost values from 10 out of 14 (71%) biobankers increased when the calculator tool was used (Fig. 2: 0%–100% and >100%). In contrast, in Scenario 2 and Scenario 3, the majority of cost values decreased from estimated values to calculated ones (64%, 9/14 and 71%, 10/14, respectively; Fig. 2: −100% to <0%).
Although all the calculated user fees for these scenarios were based on survey respondents’ input data, the user fee outputs were fairly uniform when the calculator was used, whereas the estimated user fees in these cases varied widely (Figs. 1 and 2). These results indicate that as biospecimen and data request complexity increases, the utility of a standardized user fee calculation approach may increase (Fig. 2).
Existing approaches to determining user fees
To evaluate the utility of a tool to develop Biobank User Fees, survey respondents were asked to describe their facilities’ current approach to developing fees. As mentioned above, the scenarios increased in complexity and the detail of their content is described in Appendix 2. Of the 13 biobanks who completed this portion of the survey, 76.9% of biobanks (n = 10) represented in our data set charge user fees by: using standardized calculated price models (38.5%, n = 5); generating a custom quote for each biospecimen request (23.0%, n = 3); or using a fixed price list (15.4%, n = 2) (Fig. 3A). The remaining biobanks do not charge a user fee (23.1%, n = 3, Fig. 3A).

Existing approaches to determining user fees.
The 10 biobanks employing an existing user fee model took into consideration a range of infrastructure, staffing, and consumable overhead costs in their calculations (Fig. 3C, Current). The majority of respondents took biospecimen user type into consideration when determining user fees, and the overwhelming majority believed there should be differential pricing for academic versus industry users of their biobank (92.3%, n = 12) where industry should be charged more than those in an academic group (Fig. 3B).
Utility of user fee calculator
Survey respondents were asked to evaluate the ease of use and utility of the User Fee Calculator. Thirteen biobanks in total completed this part of the survey also. The majority of participants found the tool easy (7.7%, n = 1) or of average difficulty to use (69.2%, n = 9) (Fig. 4A), and 30.8% (n = 4) believed that they would change their current user fee model based on their experience with the calculator (Fig. 4B). Most survey respondents (61.6%) were likely or very likely to use the tool again (Fig. 4C). Of the three participants who were unlikely to change their approach of user fee modeling based on the User Fee tool, two preferred their current method and one found the User Fee tool complicated. However, most biobankers who used the tool were likely or very likely to recommend the tool to a colleague (Fig. 4D).
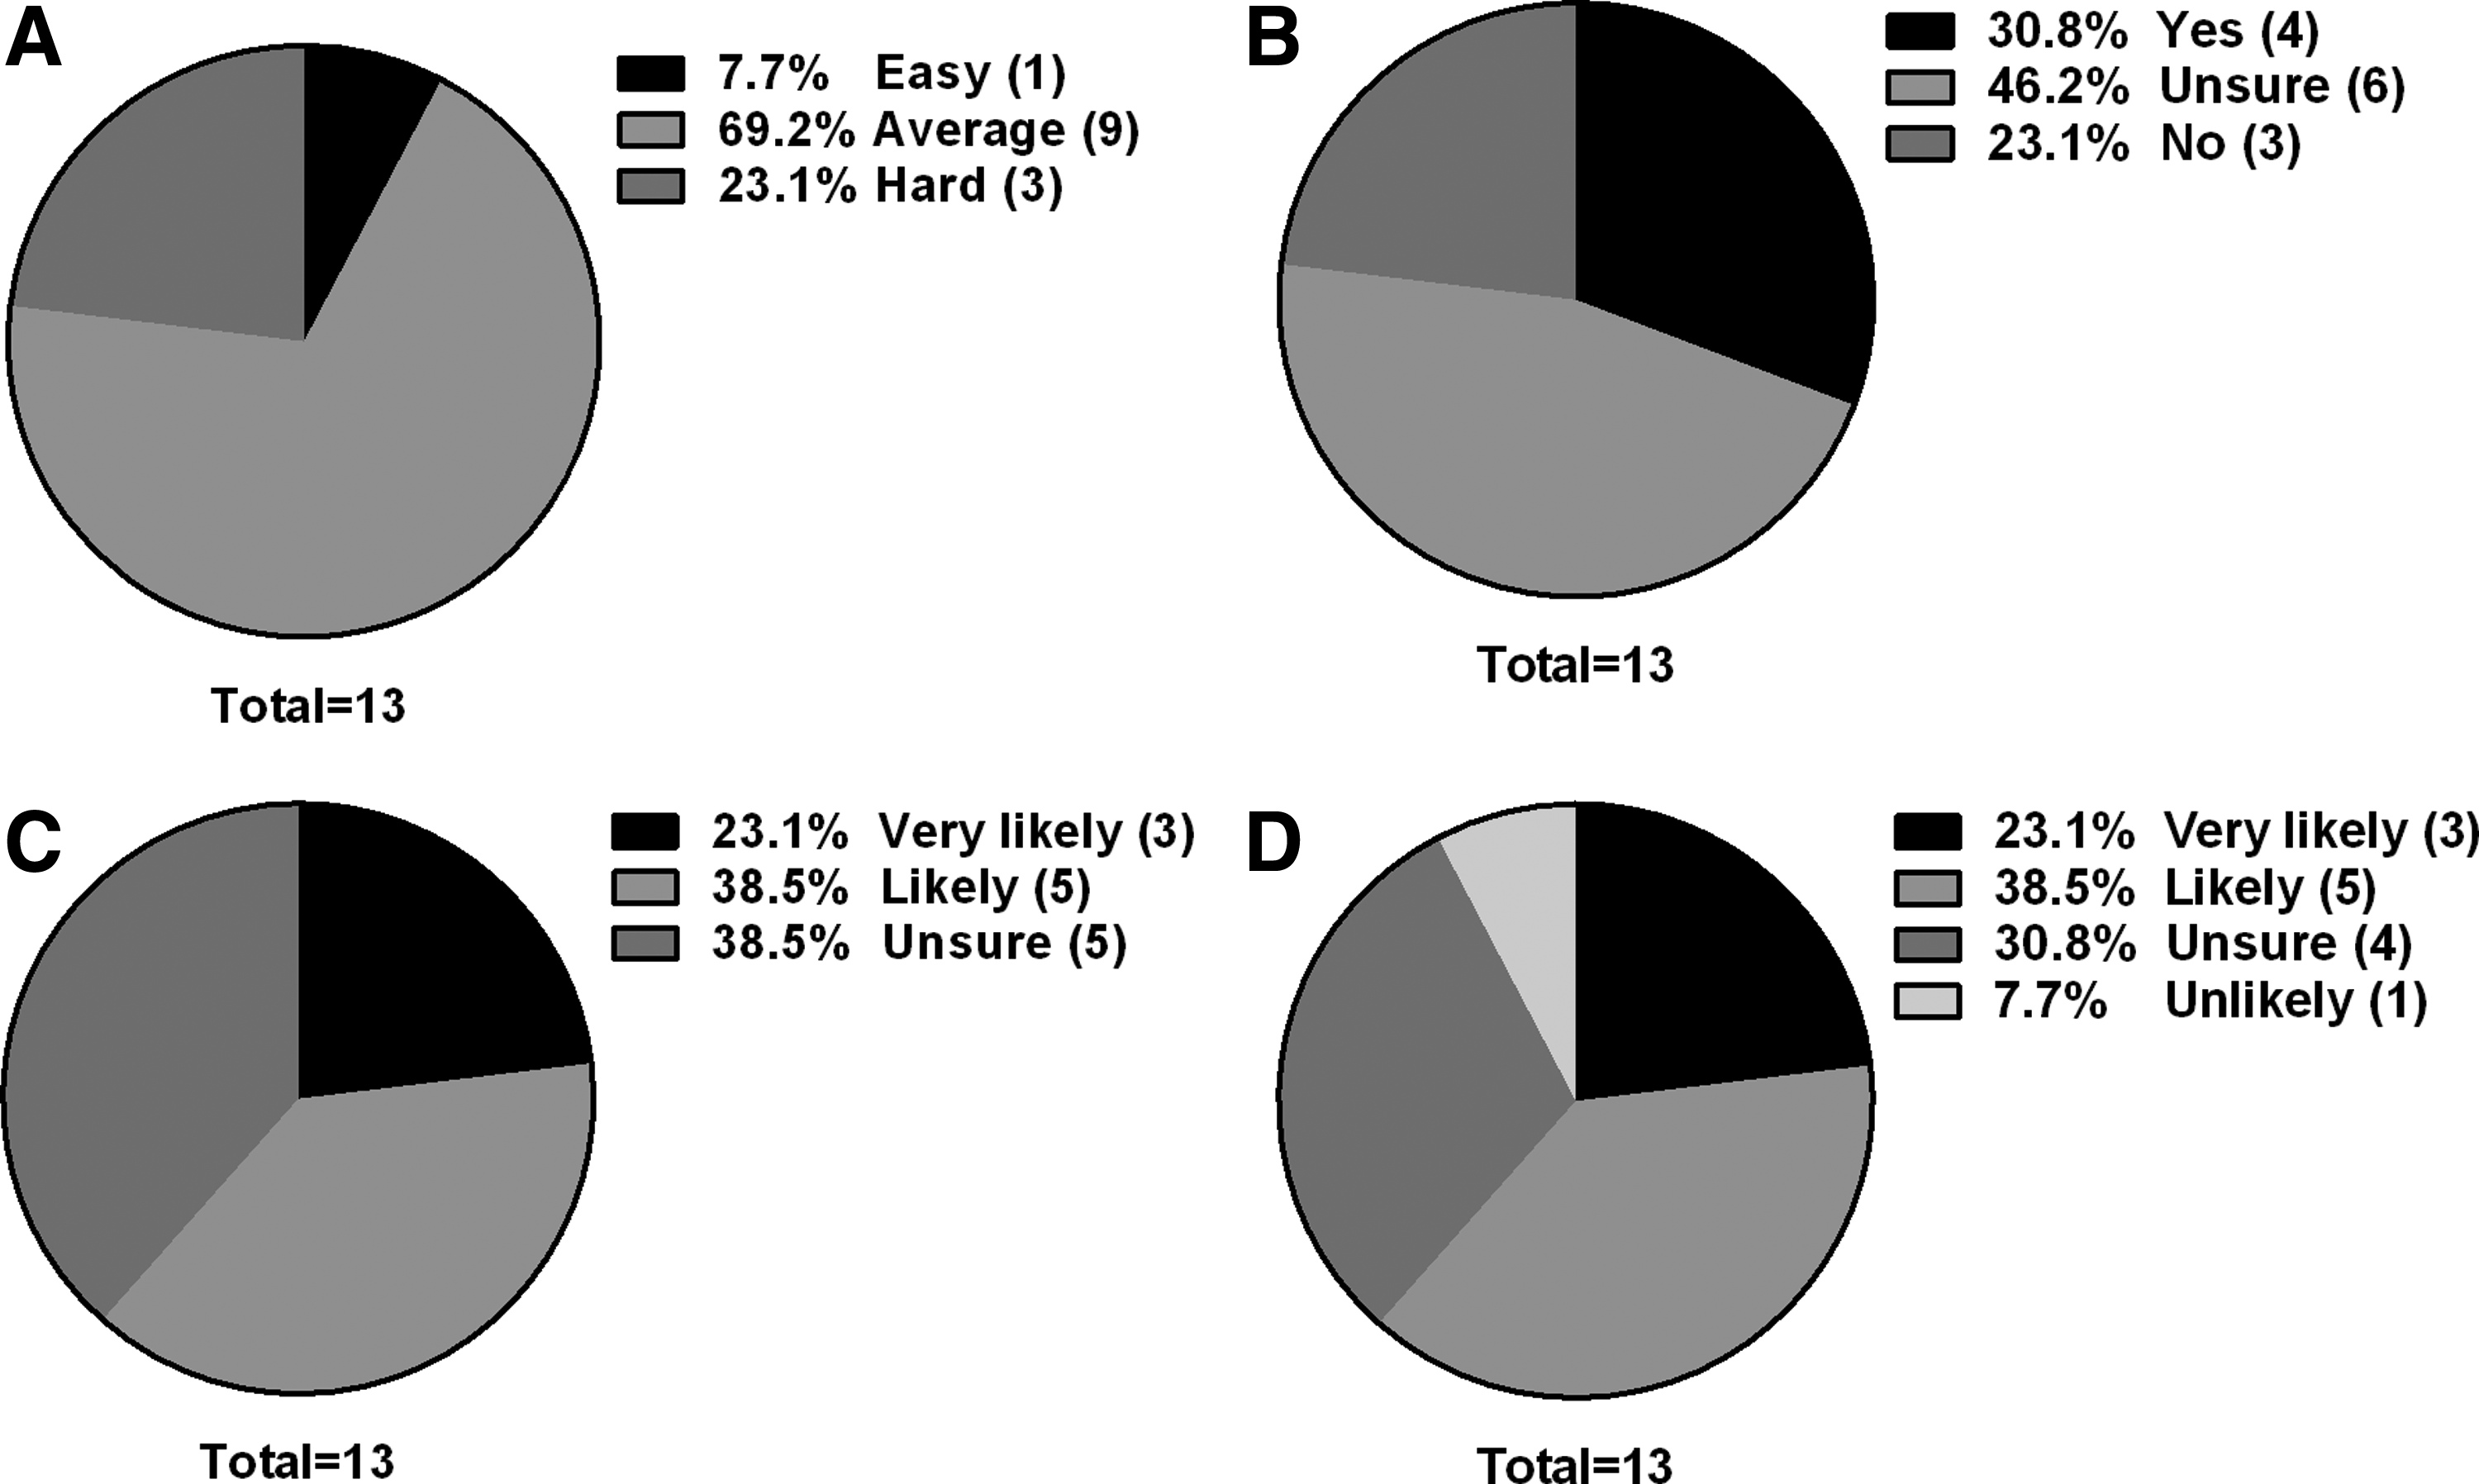
In addition, after using the user fee calculator tool, the 10 biobanks already employing an existing user fee model will also take other factors (e.g., such as staffing, equipment, IT needs, and infrastructure) into consideration when determining user fees in the future (Fig. 3C, Future).
Discussion
The biospecimen user fee calculator has been available for public use at www.biobanking.org for over 2 years. 16 This study has extended the initial assessment of usability and implications for use conducted on a defined subset of biobanks (human population and disease banks).
A global participant group was purposefully surveyed on the use of the tool itself. The workshop took place at an ISBER annual meeting held in the United States, but the distribution of numbers of participants from different regions matches that of the society as a whole with the majority (62%) of survey participants being from North America (Supplementary Fig. S1). Two-thirds of the participating biobanks were established in the last decade, and this proportion is comparable to a large survey of 447 biobanks conducted in the United States. Since the majority of biobanks are mature and managed by experienced biobankers, this cohort of survey participants represents a group whose focus has moved from activities like establishing and getting the biobank up and running to the major mid- and long-term issue of sustaining their biobanks.
Cost recovery is one of the pillars of the financial dimension of sustainability. 18 Well experienced biobankers, like the ones participating in our survey, still struggle to calculate the real cost of biobanking, which led to an overestimation of the cost in the more complex user fee scenarios that were presented (Figs. 1 and 2). In a previous study, Matzke et al. 14 used three similar scenarios to those used in this study. At that time, they found the fees that resulted from similar calculations were increased across the three scenarios.
Although hypothetical, the biobank costs and the release scenarios 2 and 3 used in this study are typical for many biobanks. It is our experience that biobanks generally take the stance of keeping fees low to increase uptake and encourage usage of biospecimens by as many researchers as possible. Similar to the Trent study, 14 the generated biospecimen user fees went up with each increasingly complex biospecimen request scenario for the baseline and calculated values. The data also show that the use of the calculator reduces the range of fees with increasing complexity of the request (Scenario 3).
These results differ from our previous survey in that we did not reproduce the finding that use of the calculator generally led to increased user fee pricing. The demographics of those surveyed in the current study were very similar in terms of overall proportions with respect to biobank use base, maturity, years in operation, and role and experience of participants. Therefore, we can only speculate that some aspect of the differences in region, focus, or broader disease focus may have contributed to this difference, perhaps by raising the initial estimated values (since the range in estimated values was much higher in this study).
Scenario 1 allowed participants to become familiar with the user fee calculator tool; having this relatively simple introductory scenario was important since about a quarter of our well experienced biobankers found the user fee calculator tool hard to use. However, the increasing complexity of the other two scenarios (Appendix 2) may have contributed to the relatively high proportion of participants who did not complete all steps. Nevertheless, the majority of participants plan to use the calculator tool again and recommend it to others. One-third would even change their current fee model based on their experience with the tool.
This survey and workshop were focused on the human biomedical biobanking community. Yet, the user fee tool itself could be adapted and adopted by the environmental/biological/biodiversity biobanking community.
Conclusion
CTRNet has built a tool that incorporates the concepts of biobank activities, classification, and development phase to aid biobanks in modeling user fees that they may charge to biospecimen users. This tool has now been tested across a Canadian Network of cancer biobanks (CTRNet), as well as by global users representing different disease (cancer and noncancer) and population type biobanks. Following the feedback and suggestions by users, we have since edited the tool, including the data field layout, drop-down options, and overall navigation improvements between sections, to ensure widespread applicability.
Modern biobanks need to become more business-like as the discipline of biobanking matures. As a research infrastructure, biobanks should be managed like a small- or medium-sized enterprise. The major activity focus will still be on providing high-quality samples and data to the research community. The focus of quality is of critical importance to help overcome irreproducibility of biomedical research that is responsible for much waste of financial resources. 19 To secure the long-term financial sustainability, cost recovery is an important part of the puzzle to solve, since without some cost recovery, biobanks could be criticized for depending entirely on core funding without contributions from users who are not made aware of the full transaction costs (e.g., accountants’ costs). 20
Nevertheless, as long as there are restricted public funds for biobanking infrastructure, all biobankers need to be able to demonstrate and encourage responsible use. Using the biospecimen user fee calculator tool, the true cost of biobanking can be computed transparently for all stakeholders and help assure financial sustainability.
Footnotes
Acknowledgments
The authors thank Dr. Serene Perkins and Ms. Deborah Garcia for their feedback on the use of the tool. In addition, the authors thank Ms. Sheila O'Donoghue for reviewing and providing feedback on the survey and workshop in general.
Author Disclosure Statement
No conflicting financial interests exist.
Appendix 1
Appendix 2
Appendix 3
References
Supplementary Material
Please find the following supplemental material available below.
For Open Access articles published under a Creative Commons License, all supplemental material carries the same license as the article it is associated with.
For non-Open Access articles published, all supplemental material carries a non-exclusive license, and permission requests for re-use of supplemental material or any part of supplemental material shall be sent directly to the copyright owner as specified in the copyright notice associated with the article.
