
Abstract
Context:
The promising perspective of storing dried blood spot (DBS) for evaluating 25-hydroxyvitamin D (25OHD) levels is increasingly being realized. While strong correlations have been demonstrated between 25OHD levels measured in DBS and in systemic serum samples in earlier works, the clinical concordance of the assay results has not been evaluated. Moreover, the utility of dried serum spot (DSS), a highly suitable matrix for sample archiving, has not been investigated in this respect.
Methods:
25-hydroxycholecalciferol and 25-hydroxyergocalciferol levels were established selectively in DBS (n = 73) and DSS (n = 67) specimens obtained from deidentified whole blood and serum using a previously validated liquid chromatography–tandem mass spectrometry (LC-MS/MS) method. In addition, total 25OHD levels were determined in the serum samples using the LIAISON 25OH Total Vitamin D Assay (LIA, n = 73). The analytical and clinical performance of the three approaches was compared pairwise.
Results:
Deming regression, Bland–Altman analysis, and concordance correlation coefficients consistently demonstrated the lack of analytical equivalence among the three result sets. The overall percentage agreement of the clinical classifications (hypovitaminosis or euvitaminosis) was moderate (67.1%–83.6%). The delivery of positive cases was decreasing significantly in the order LIA>DSS>DBS (p < 0.05).
Conclusions:
The approaches tested did not deliver equivalent outputs either in an analytical or a clinical context. Therefore, specific reference ranges must be established for each matrix to avoid false clinical evaluation. 25OHD can be quantified when assay results are scaled by a factor of 1.60–1.67. Considering the convenience and efficiency of the storage and processing of DSS, along with the difficulties of quantifying 25OHD in real-life DBS samples accurately, DSS is proposed as an alternative for the long-term archiving of specimens.
Introduction
T
The two prohormones, ergocalciferol (vitamin D2) and cholecalciferol (vitamin D3), are metabolized to their active forms in two steps. The first products, 25-hydroxyergocalciferol (25OHD2) and 25-hydroxycholecalciferol (25OHD3), are the major circulating metabolites, with blood concentrations most appropriate in terms of their magnitude and stability for characterizing the vitamin D status. Depending on the nutritional habits and showing seasonality, systemic 25OHD2 and 25OHD3 levels range between 0–10 ng/mL and 20–100 ng/mL, respectively, in the healthy adult population. 12 The active 1,25-dihydroxy end products, present in much smaller levels and demonstrating significant fluctuation, bind to the vitamin D receptor which can be found in most human cell types. Vitamin D metabolites have been demonstrated to activate a remarkable proportion, 5% to 10%, of the human genome. 13
The collection and storage of dried blood spots (DBSs) for 25OHD analysis in biorepositories may serve several purposes. First, the conditions associated with the insufficiency of the vitamin D status can be silent for years, 14 with dried spots having the unique potential to provide a'time travel’ diagnosis through the evaluation of earlier samples. Neonatal and pediatric care, 15 studies in the elderly and the disabled,16,17 as well as long-term epidemiology studies,18,19 also benefit from the opportunity to archive blood specimens. Both 25OHD2 and 25OHD3 can be reassayed efficiently after storing DBS cards for approximately two decades at ambient temperature.20,21
Although strong correlations have been demonstrated between 25OHD levels in DBS and serum (or plasma) samples, these levels have been shown to be far from equivalent.16,21,22 The concordance of the results has never been investigated, although, in the context of clinical classifications. In addition, current technology does not enable the determination of the hematocrit in finger-prick blood samples either before spotting or after preparing the dried spots; therefore the accurate quantification of 25OHD concentrations is still not feasible in DBS.
As an alternative to DBS, dried serum spots (DSSs) may serve as a suitable matrix for sample archiving and assisting the purposes outlined above. Its primary advantage is the lack of cellular components, eliminating a large body of matrix interferences and uncontrolled variables during the quantitation process. The utility of DSS has been established for vitamin A, vitamin B12, and folate,23–26 in addition to other biomarkers such as ferritin, cholesterol, and triglycerides.27,28 Nevertheless, its utility as a matrix for assessing the vitamin D status has never been investigated.
The aim of the present article is to compare the 25OHD assay results obtained in DSS to those found in DBS prepared from whole blood collected from the same patients during the same phlebotomy event, using liquid chromatography–tandem mass spectrometry (LC-MS/MS), as well as to those evaluated in serum using DiaSorin LIAISON® 25 OH Vitamin D TOTAL Assay, the most popular immunoassay technique in this respect. Both the analytical and the clinical concordance of the results obtained using the three analytical approaches are assessed in detail to provide a comprehensive view on their interchangeability.
Materials and Methods
Materials
The reference materials, [25-hydroxycholecalciferol and 25-hydroxyergocalciferol ethanol solutions (100 μg/mL) and the internal standard (IS) 26,26,26,27,27,27-D6-25-hydroxycholecalciferol ethanol solution (50 μg/mL)], were purchased from Sigma-Aldrich Hungary Ltd. (Budapest, Hungary). Water, methanol, and formic acid, all LC-MS grade, were procured from VWR International Ltd. (Debrecen, Hungary). Ethyl acetate LiChrosolv grade was obtained from Merck Hungary Ltd. (Budapest, Hungary). The IS solution was prepared at a concentration of 1.4 μg/mL in methanol.
Study individuals
Our study was conducted in compliance with the Declaration of Helsinki and related guidelines effective in the European Union. Samples were taken from 73 patients referred to the Department of Laboratory Medicine, Semmelweis University (Budapest, Hungary) for testing multiple parameters, including 25-hydroxyvitamin D in native serum and whole blood. Native serum and, in an EDTA-coated tube, whole blood specimens, were drawn simultaneously in a routine phlebotomy process. All samples were taken for the purposes of routine analysis, as ordered by the referring clinicians, and no samples were taken specifically for the purposes of the present study. Five hundred microliter aliquots of the leftover specimens were separated following deidentification for the preparation of DSS and DBS. Verbal consent was obtained from patients whose samples were eligible for the research.
Three DSS samples were excluded from the study due to technical shortcomings, and another three contained both analytes in levels below the limits of quantitation. As a result, the number of samples involved was 73 in the case of the LIA and DBS and 67 in the case of the DSS data sets.
The assessment of 25-hydroxyvitamin D2 and 25-hydroxyvitamin D3 levels in DSS and DBS
LC-MS/MS assays were performed on a PerkinElmer Flexar FX-10 UHPLC coupled to a Sciex 5500 QTRAP mass spectrometer (Per-Form Hungária Kft., Budapest, Hungary). Chromatography was performed on a Phenomenex Kinetex XB-C18 stationary phase (50 × 2.1 mm, 1.7 μm) (Gen-Lab Ltd., Budapest, Hungary). The eluent composition was a mixture of (A) water containing 0.1% formic acid and (B) methanol containing 0.3% formic acid. The following gradient program was applied: initial–B 60%, 1.0 min–B 60%, 6.0 min–B 100%, 7.5 min–B 100%, and 8.0 min–B 60%. The run time was 10 min, and the flow rate was 0.2 mL/min. The analytical column was kept at 35°C ± 0.5°C.
The mass spectrometer was operated in positive electrospray ionization mode with the following settings: source temperature: 500°C, ionization voltage: 5000 V, curtain gas: 40 psi, gas 1: 40 psi, gas 2: 40 psi, entrace potential: 10 V, CEM: 2000 V, and resolution: unit. Nitrogen for the LC-MS/MS assays was produced in situ by a Peak Genius AB3G nitrogen generator (Per-Form Hungaria Ltd., Budapest, Hungary). The compound specific settings are displayed in Table 1.
The LC-MS/MS method had been validated before the analysis of the samples presented herein. The limits of quantitation were 1.0 ng/mL and 4.62 ng/mL for 25OHD2 in DSS and DBS, respectively, versus 1.0 ng/mL and 3.85 ng/mL for 25OHD3, respectively. The intra-assay precisions were 11.1% and 14.7% for 25OHD2 in DSS and DBS, respectively, versus 7.4% and 12.9% for 25OHD3, respectively. The inter-assay precisions were 15.7% and 21.2% for 25OHD2 in DSS and DBS, respectively, versus 12.8% and 18.3% for 25OHD3, respectively.
Calibration procedure
The dynamic range of the DiaSorin LIAISON 25 OH Vitamin D TOTAL Assay was 4.0–150 ng/mL. 29 LC-MS/MS calibration was performed using a 5-level set prepared in a 1:1 mixture of water and methanol containing 25OHD2 (1.0, 2.0, 5.0, 10.0, or 20 ng/mL), 25OHD3 (1.0, 5.0, 10.0, 20.0, or 50 ng/mL), and 50 ng/mL IS. 25OHD2/IS and 25OHD3/IS peak height ratios were used for quantitation using 1/x2 weighting.
Preparation of dried serum spot and dried blood spot samples
Four hundred microliters of serum or whole blood sample was spiked with 15 μL IS solution. A disc of Whatman 903 paper (AP Hungary Ltd., Budapest, Hungary), 15 mm in diameter, was cut, and 80 μL spiked serum or whole blood was transferred with a pipette. The sample was allowed to dry overnight at room temperature.
Three punches, each 5.5 mm in diameter, were obtained from the dried spots and put into a 4 mL glass vial. Five hundred microliters water:methanol 1:1 was added. The vial was capped and vortexed vigorously for 2 min and was subsequently sonicated for 25 min. Five hundred microliter μL water and 1 mL ethyl acetate were added to the reconstituted sample, which was first vortexed for 2 min and then centrifuged at 3500 rpm for 5 min. The extraction was repeated with 1 mL ethyl acetate, the organic phases were combined, and the extract was evaporated to dryness under a gentle stream of nitrogen at 37°C. One hundred microliters of methanol and 100 μL water were added to the residue, and 20 μL was injected for analysis.
Automated assays
Direct competitive chemiluminescent immunoassays conducted on a DiaSorin LIAISON XL Immunochemistry Analyzer using DiaSorin LIAISON 25 OH Vitamin D TOTAL Assay Kits (Buda Labor Ltd., Diosd, Hungary) were used for the routine evaluation of serum 25OH Vitamin D levels. Hematocrit values were measured in whole blood samples using a Bayer Advia 2120 instrument (Diagnosticum, Inc., Budapest, Hungary).
Evaluation and statistical analysis
Various packages and functions of the R computing environment 30 were used for the evaluation of the results. Deming regression was performed using the ‘mcr’ package. Concordance correlation coefficients (CCCs) were determined using the “epiR” package. To calculate the percentage agreement of clinical classifications based on pairwise comparisons, the results were classified as hypovitaminosis, lower than 20.0 ng/mL, or euvitaminosis, not lower than 20.0 ng/mL. This specification was based on its general use and the lack of assay- and matrix-adjusted cutoff levels. Assuming a binomial distribution, the 95% confidence intervals were calculated using the binom.test function. The statistical significance of the differences in clinical performance was assessed using McNemar's exact binomial test, using the “exact2x2” package. All other calculations were performed using Microsoft Excel 2013. The limits of agreement were calculated as 95% confidence intervals of the data points.
The correction factors used for scaling the 25OHD levels measured in DBS samples were calculated using the following equation:
Results
25OHD3 was quantitated in each analyzed sample. No specimen was found, on the other hand, to contain 25OHD2 levels above the limit of quantitation. Consequently, the results presented for the DBS and DSS matrices correspond to 25OHD3 levels. Typical product ion chromatograms are shown in Figure 1. The assay results were 5.5–96.0 ng/mL (median: 32.1 ng/mL), 7.6–97.9 ng/mL (31.0 ng/mL), and 4.0–60.0 ng/mL (23.2 ng/mL) in the DBS, DSS, and LIA sets, respectively (Fig. 2).
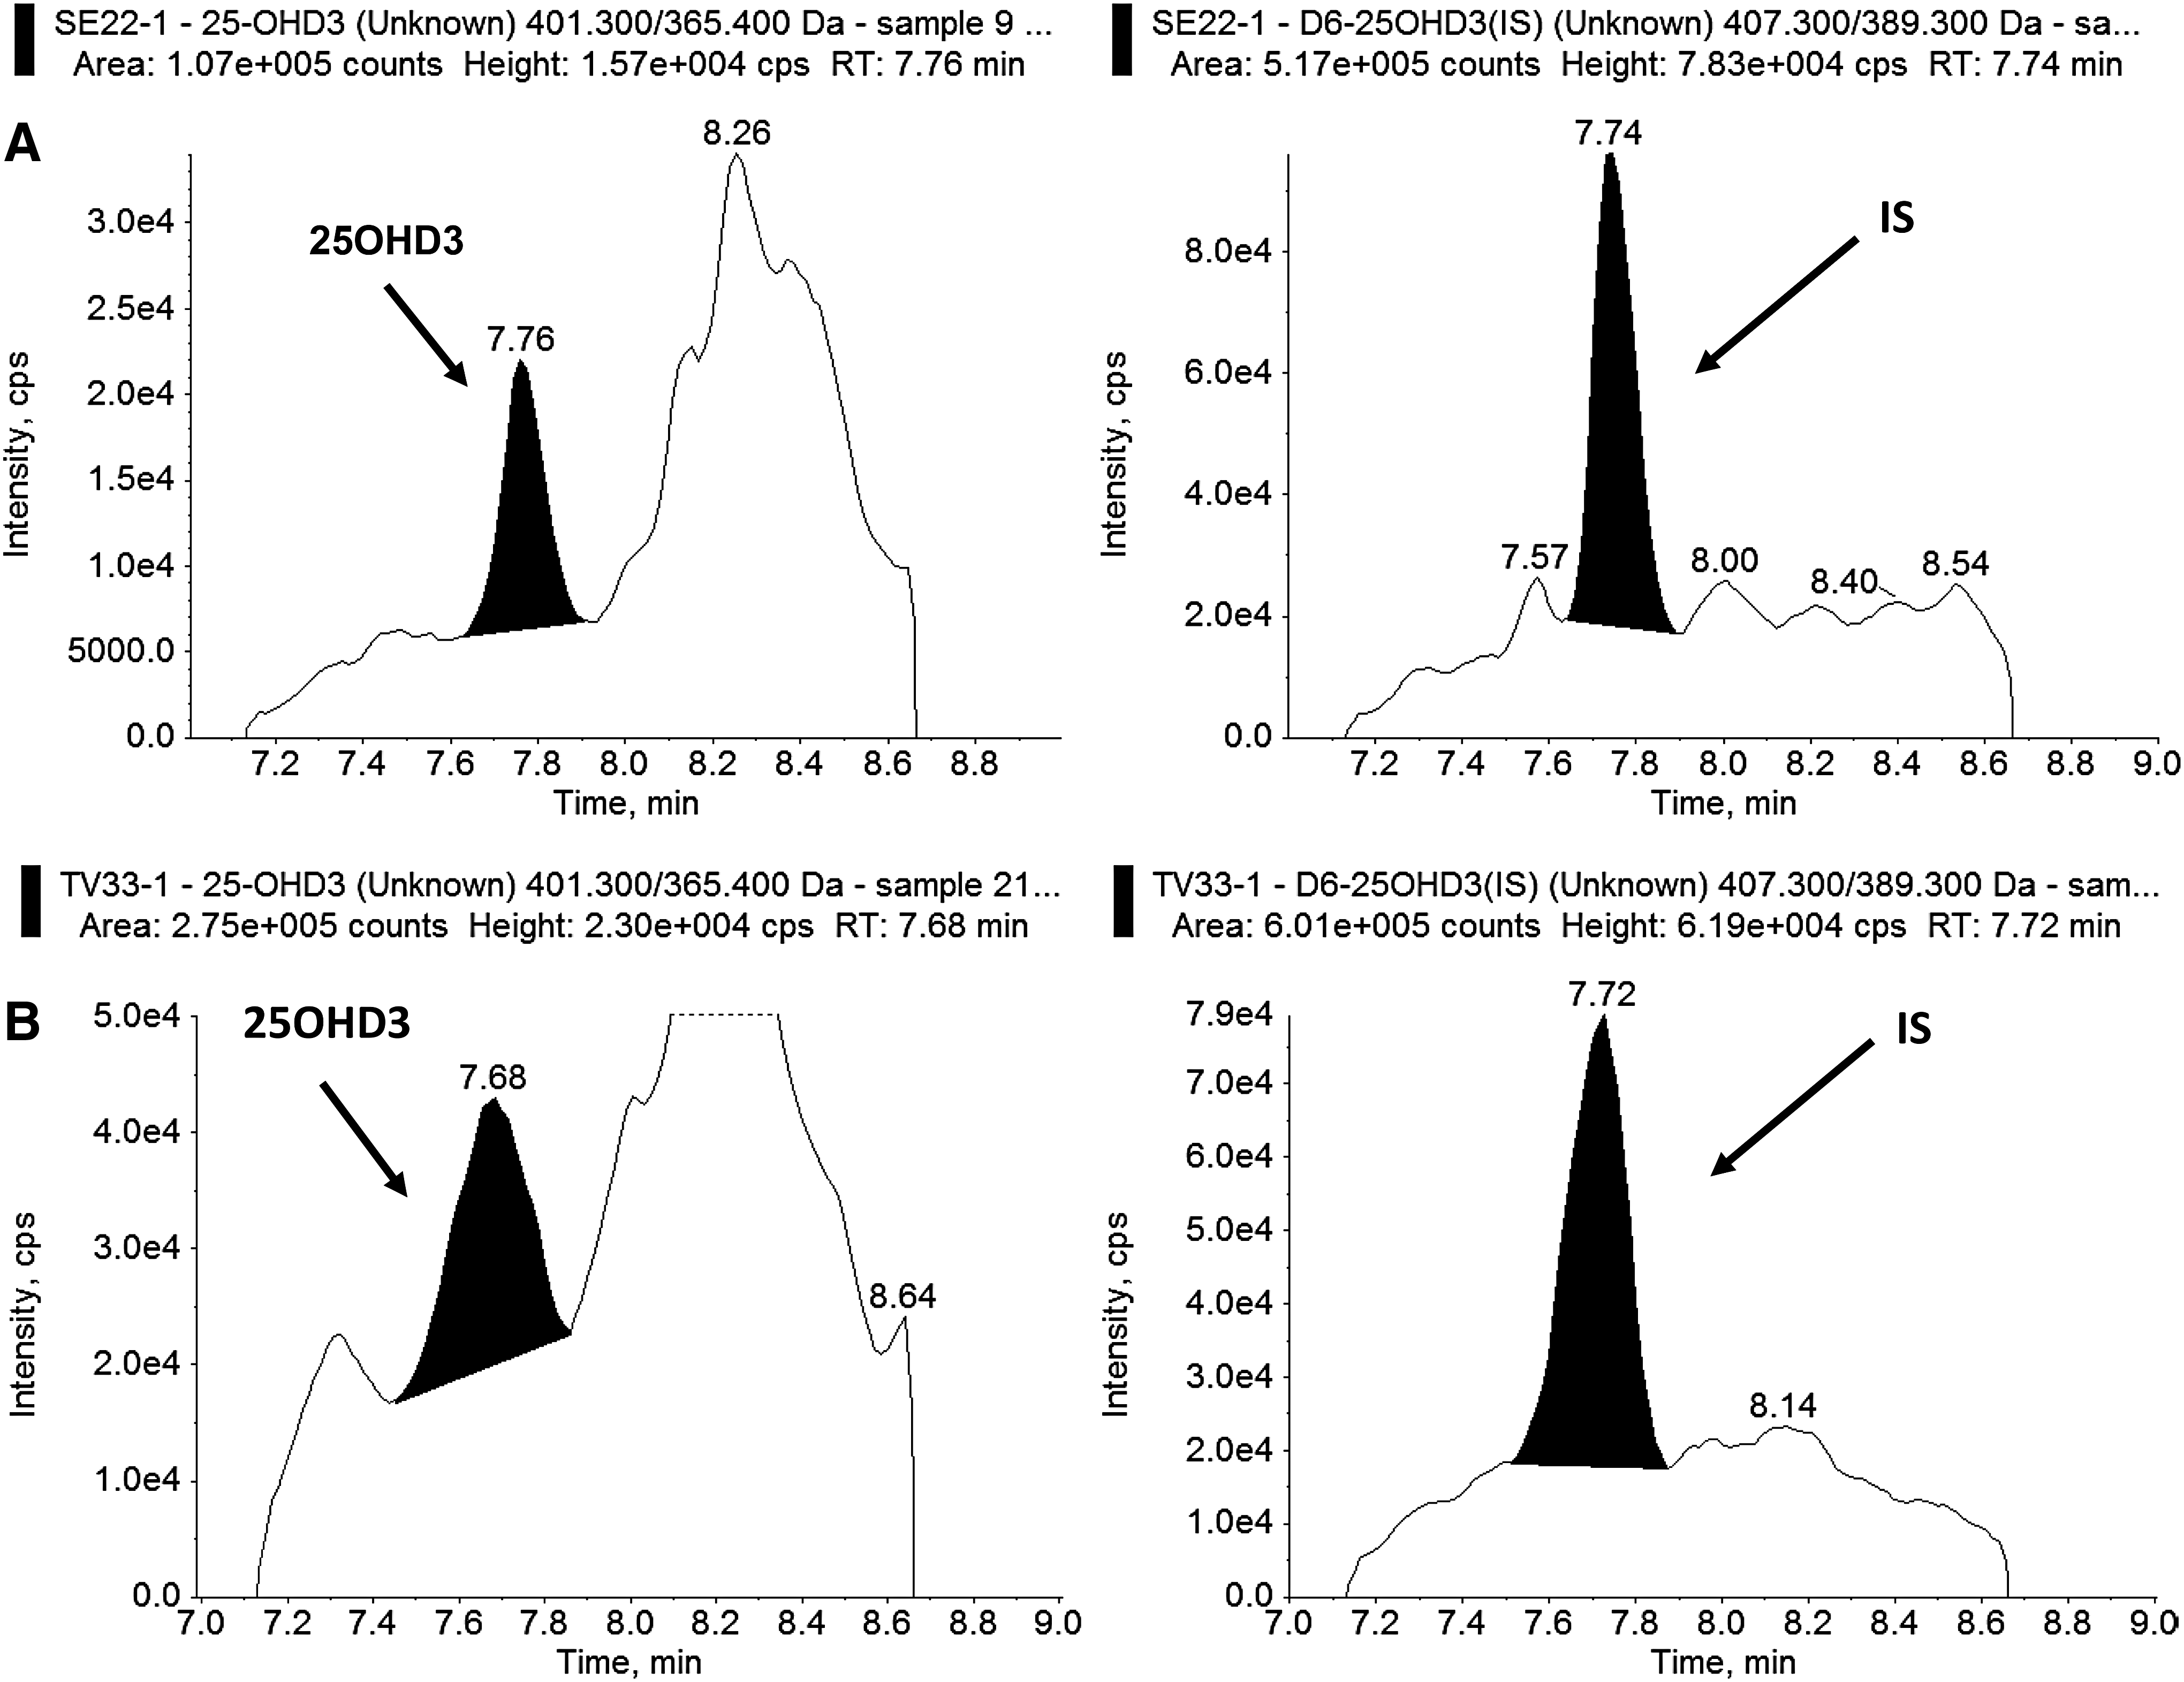
Typical product ion chromatograms of 25-hydroxycholecalciferol (25OHD3) and the IS D6-25-hydroxycholecalciferol obtained by processing

Beeswarm plot of the 25OHD assay results. The solid line at 20 ng/mL represents the cutoff value usually considered for the diagnosis of hypovitaminosis D. 25OHD, 25-hydroxyvitamin D; DBS, dried blood spot; DSS, dried serum spot; LIA, serum DiaSorin LIAISON 25 OH Vitamin D TOTAL Assay.
The results of the linear regression and the analytical concordance analysis are shown in Table 2 along with the Bland–Altman plots in Figure 3. The Deming regressions demonstrated minor constant (all intercepts lower than 1.5 ng/mL) and significant proportional (all slopes significantly different from 1) biases in the comparisons. The CCC also showed poor agreement (mean CCC: 0.515–0.775) among the 25OHD levels obtained with the three approaches. The Bland–Altman analyses revealed limits of agreement as −47.0% to 83.7%, −114.0% to 37.9%, and −82.8% to 37.3% for DBS versus DSS, DBS versus LIA, and DSS versus LIA, respectively. The mean biases showed no correlation with the 25OHD levels in the comparisons (r ≤ 0.0671).
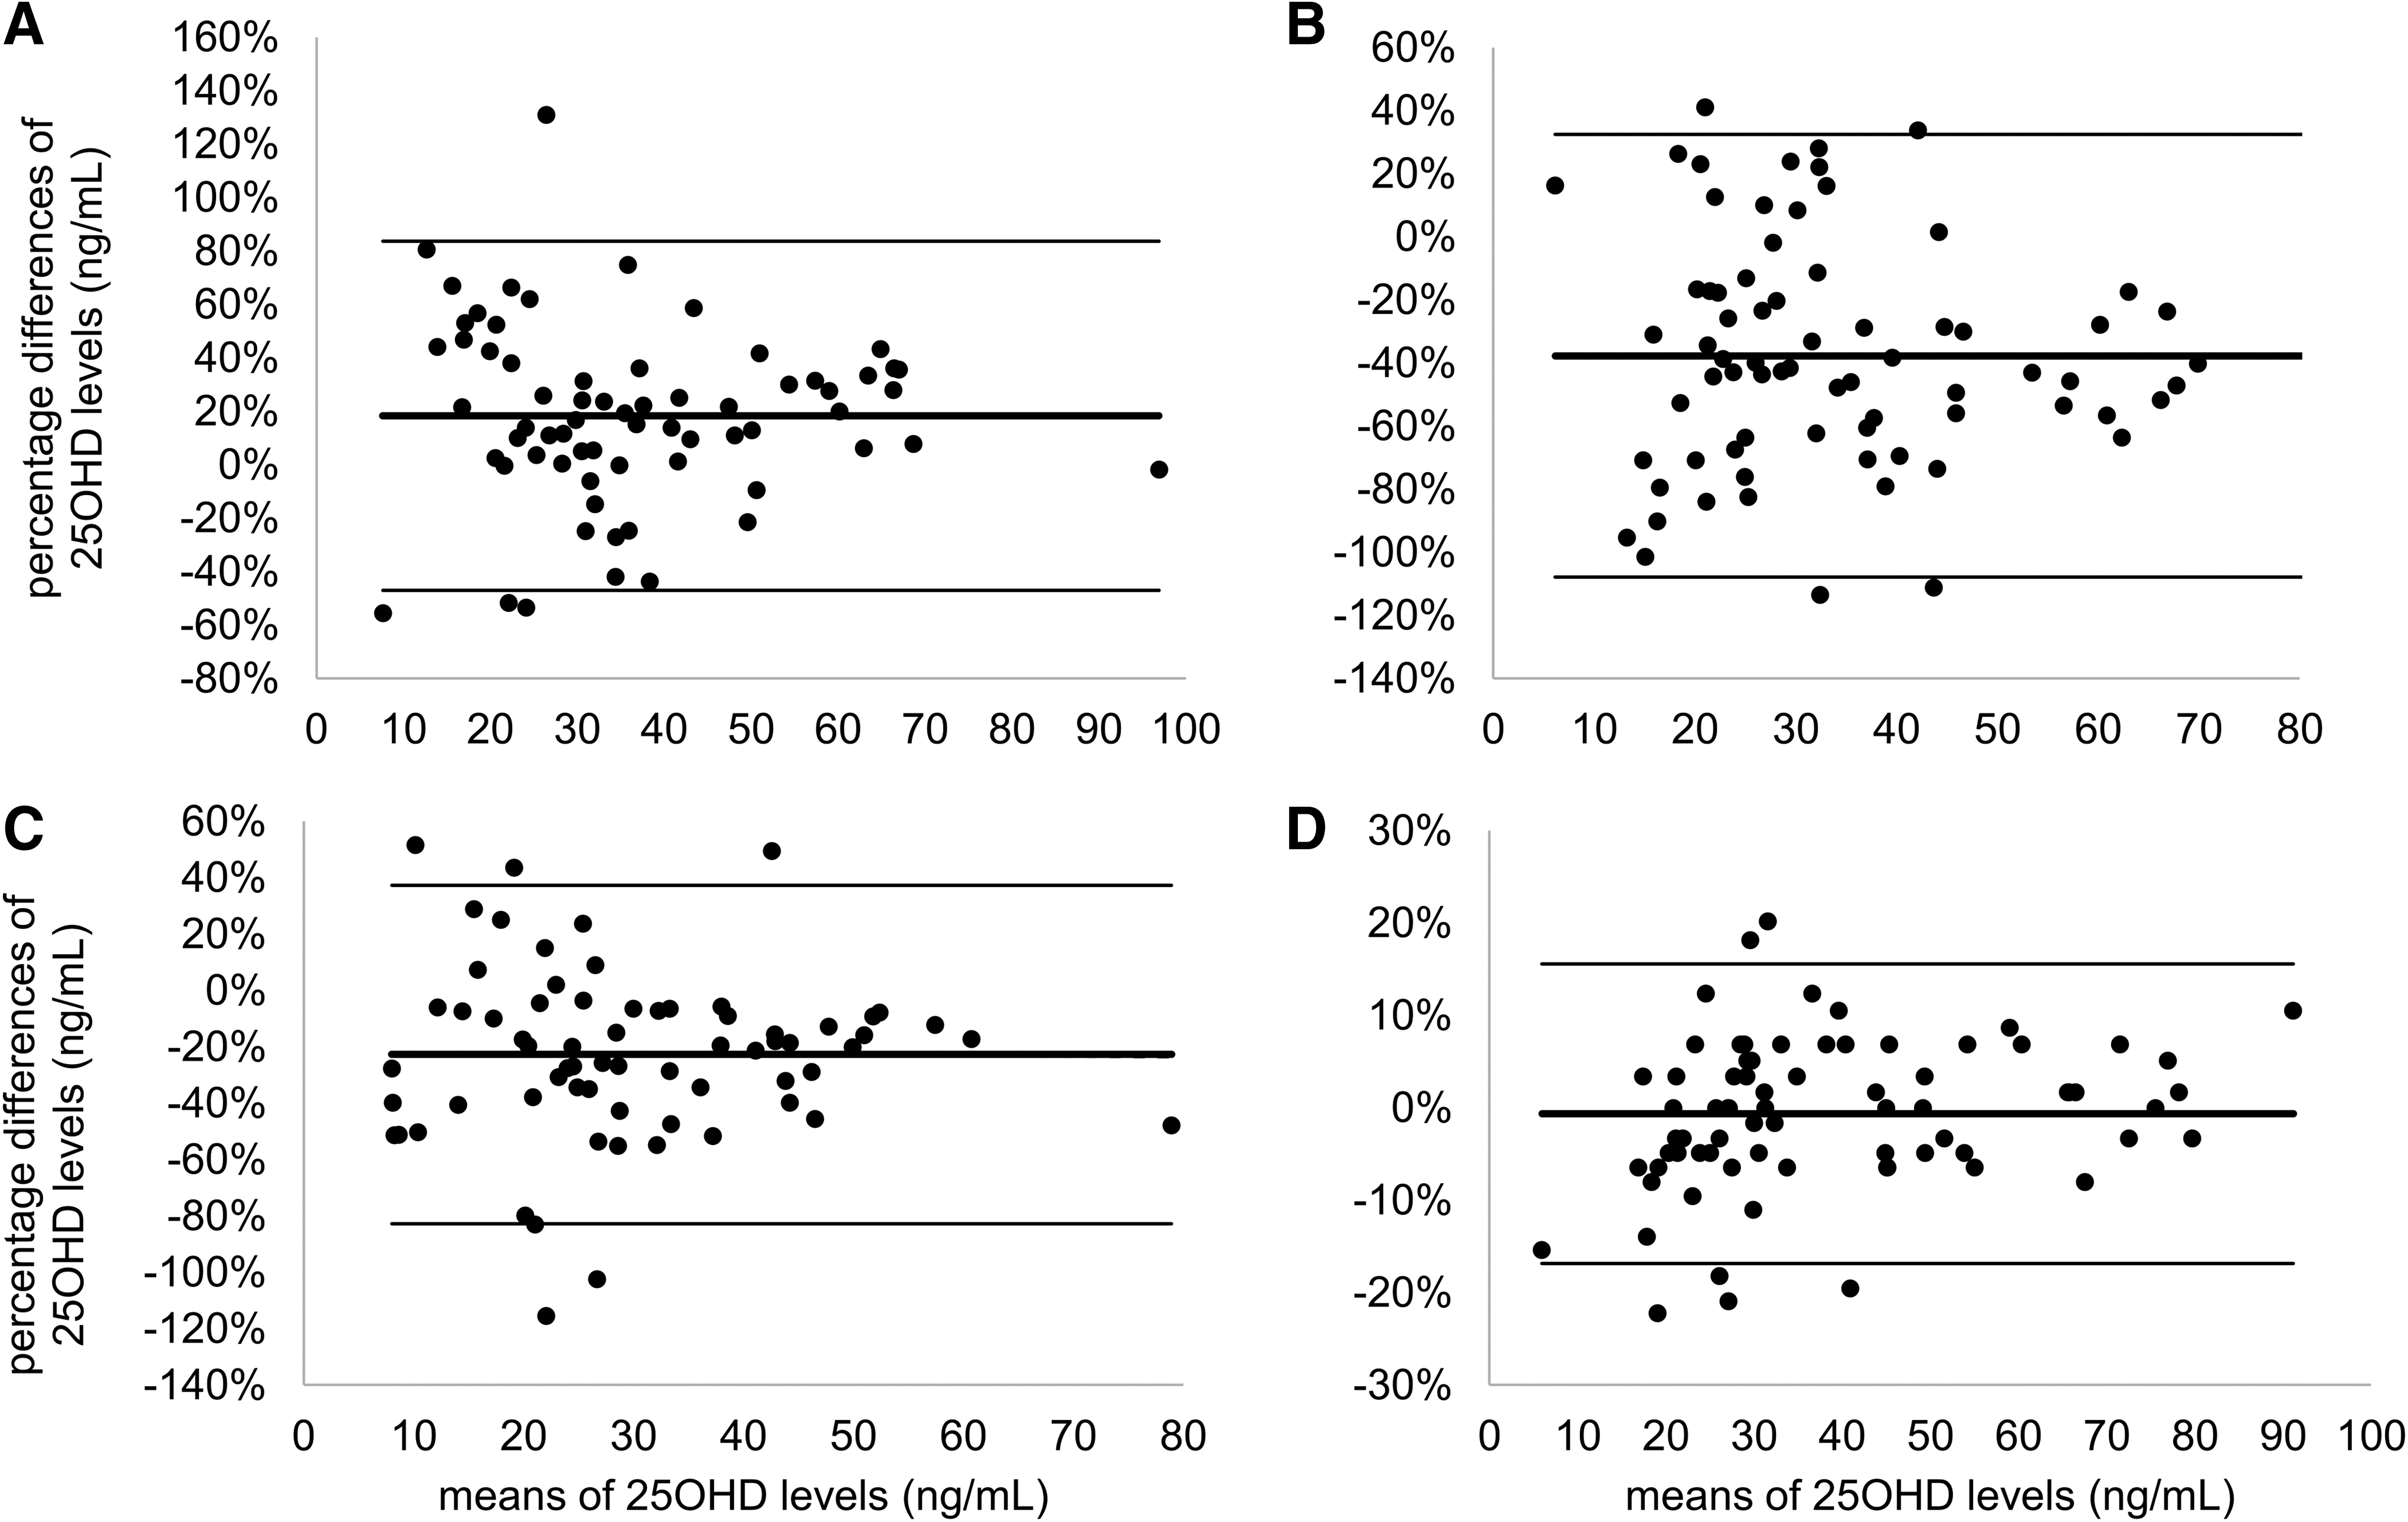
Bland–Altman plots of the results obtained in
All values in parentheses are 95% confidence intervals. For Bland–Altman analyses, the percentage differences are shown.
DBS, dried blood spot; DSS, dried serum spot; LIA, serum DiaSorin LIAISON 25 OH Vitamin D TOTAL Assay.
The analysis of the clinical classification of assay results revealed that hypovitaminosis would be suspected in 10.4%, 20.9%, and 34.3% of patients based on the 25OHD levels delivered in the DBS, DSS, and LIA experiments, respectively. The pairwise comparison of the clinical classifications showed agreement in 82.1% (95% confidence interval: 70.8%–90.4%), 67.1% (55.1%–77.7%), and 83.6% (72.5%–91.5%) of the cases for the DBS versus DSS, DBS versus LIA, and DSS versus LIA data sets, respectively.
The asymmetry of the disagreement in the clinical classifications is displayed in Figure 4. The proportion of results lower than 20 ng/mL was significantly smaller in DBS than in the serum immunoassays (p = 0.0003) or DSS (p = 0.0386). The difference was also significant between the LIA and DSS data sets (p = 0.0454).
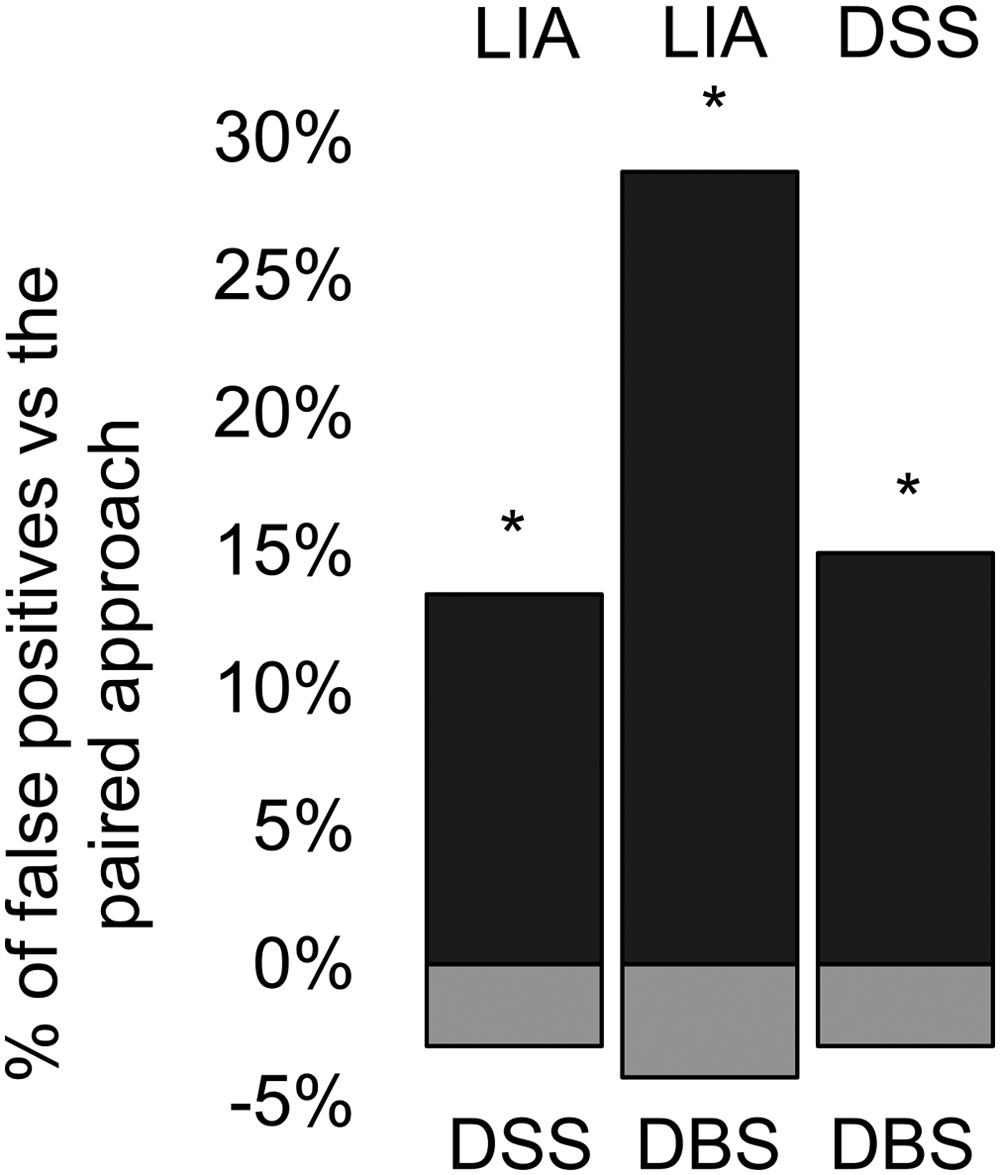
Bar charts illustrating the asymmetry of method disagreement by displaying the proportions of samples assayed lower than 20 ng/mL by only one of the approaches within each of their combinations. The asterisks indicate a significant disagreement in the clinical classifications of results (p < 0.05).
Discussion
Earlier studies have concluded that 25OHD2 levels are negligible in the European population.31–34 The reason is that in Europe both the dominant natural vitamin D sources, as well as nutritional and pharmaceutical products, contain cholecalciferol. In accordance, 25OHD2 was not detected in any of the DSS or DBS samples processed in our study.
The lower limits of quantitation (LLOQ) were remarkably different for the DSS and the DBS matrices. In the DSS validation samples the signal-to-noise ration (SNR) was higher than 10 at the lowest point of the calibration range, which was therefore considered as the LLOQ. In the DBS specimens, however, the large variations in the hematocrit values led to a much higher variability of analyte SNR. The presence of smaller amounts of analytes in the whole blood spots added to this effect, causing the threshold concentrations with SNR >10 to be eventually elevated. These findings point to analytical advantages related to the use of DSS specimens. The recovery of the internal standard spiked to the specimens was not found to be statistically different for the two matrices, which eliminates the impact of underlying technical factors such as differences in the recoveries or matrix-dependent ion supression.
The results obtained in the DBS, DSS, and LIA experiments lacked equivalence both in the analytical and clinical aspects. In analytical terms, the differences are best displayed by the poor CCC and the unacceptably broad limits of agreement in the Bland–Altman plots. These results point to the involvement, along with negligible constant and low proportional biases, of considerable random error terms. It has been shown earlier that sizeable intermethod random error terms are present in 25OHD assays 35 and our current findings demonstrate that, in addition, this error term is matrix dependent.
The medians of the percentage agreement of classifications fell in a relatively narrow range (67.1%–83.6%), which is in line with our previous finding that this is not a sensitive indicator. 35 In contrast, there were over threefold, over twofold, and 150% differences in the proportions of cases identified as hypovitaminosis between the DBS versus LIA, DBS versus DSS, and DSS versus LIA assays, respectively. In addition, significantly larger proportions of samples were statistically found to be considered as hypovitaminosis in the order LIA>DSS>DBS.
The major uncertainty over sample archiving in the form of DBS is caused by the current lack of technology for evaluating the hematocrit in any phase of its preparation or processing, which results in the increase of the random error term during the quantitation of analytes. The hematocrit affects the assayed levels of the 25-hydroxy metabolites of vitamin D substantially since at least 98% of their amount is present in the extracellular space. 36 To address this problem, constant correction factors ranging between 1.69 (Ht = 0.41) 21 and 2.56 (Ht = 0.61) 20 were used in several previous studies involving the assessment of 25OHD levels in DBS. In two studies, the used correction factor was gender dependent.19,21 Nevertheless, the validation of the specific correction factors was not conducted in any of these works, and in numerous other studies the approach to the correction with the hematocrit was not reported at all.17,18,22,37 Further key issues which contribute to the random error term in the analysis of 25OHD in DBS samples are discussed in detail in reference 36.
In the present study, each 25OHD result was corrected by the hematocrit value measured in the specific whole blood sample before the preparation of the dried blood spot. The median hematocrit was 0.39 (range: 0.25–0.51); 0.42 (0.25–0.51) for males and 0.40 (0.26–0.44) for females. These wide ranges raise the possibility that the use of a single correction factor could cause a notable increase in the matrix-dependent random error term. To evaluate this impact, we performed a simulation to compare the DBS assay results to those estimated using a factor of 1.67 (Ht = 0.4). In this comparison, the Bland–Altman analysis returned 95% limits of agreement between −16.8% and 15.6% (mean bias: −0.63%, Fig. 3D). These statistics do not support the strong influence of the hematocrit; nevertheless, the differences were observed to be considerably higher below 45 ng/mL mean 25OHD levels. The evaluation of the clinical concordance of the 25OHD concentrations obtained through a correction by the true and simulated hematocrit values was therefore conducted by scaling the assay results by a discrete series of constant factors in the range of 1.54–2.86, corresponding to hematocrits of 0.650, 0.625, 0.600, and so on, down to 0.350 (Fig. 5). The results of this simulation demonstrated that the clinical agreement ranged between 90.4%–97.3%, with the optimal agreement obtained when the hematocrit was hypothesized as 0.375 or 0.400 (scaling factor: 1.60–1.67).
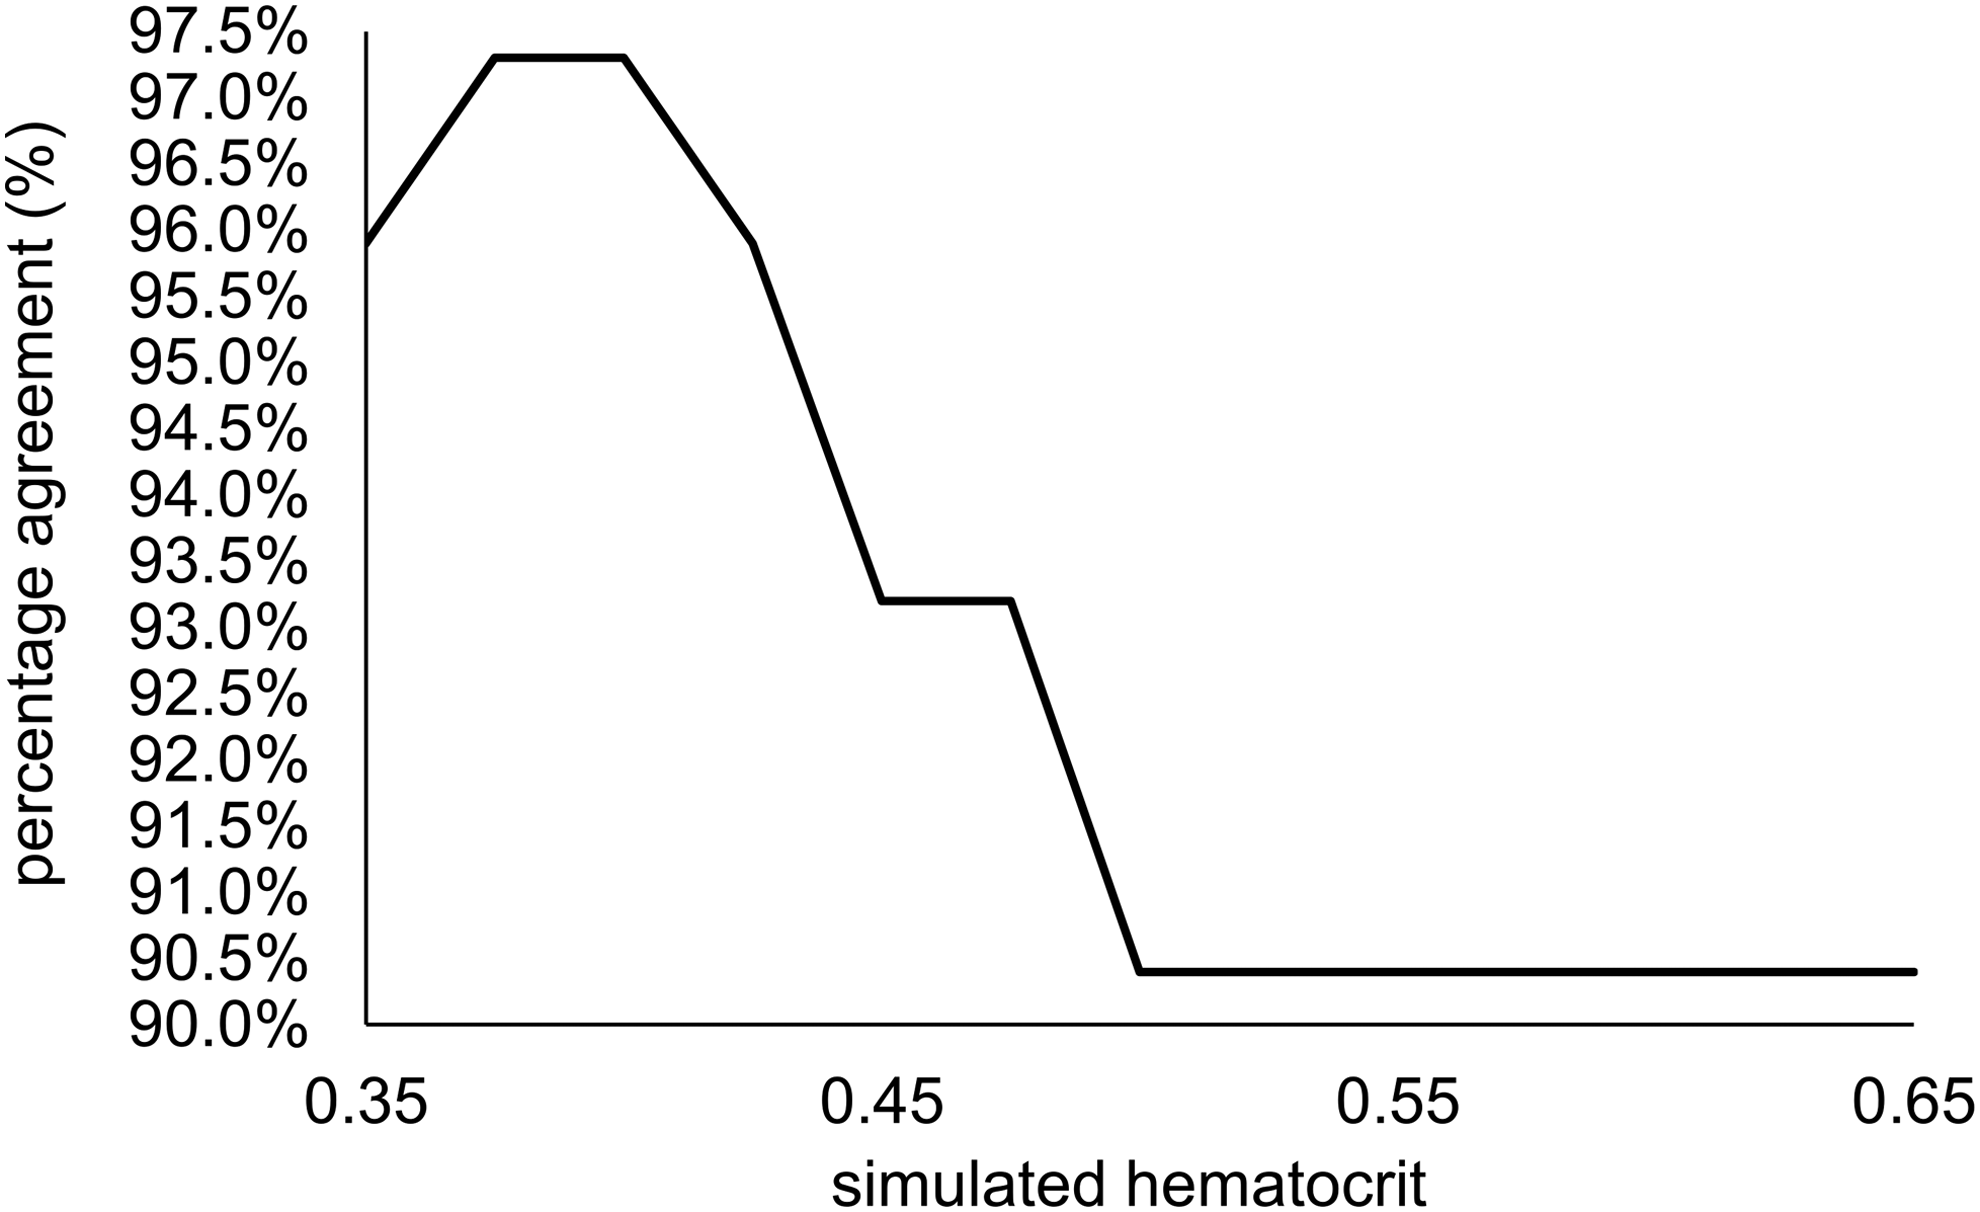
Percentage agreement of 25-hydroxyvitamin D levels obtained using the true versus estimated hematocrit values in the range of 0.35–0.65 in DBS.
The problems discussed above do not affect the analysis of DSS samples. Both the analytical and clinical agreements obtained in the DSS versus LIA comparison were in line with that found earlier when the results of serum analyses performed using the LC-MS/MS method used herein were assessed. 35 DSS samples are easy to handle, providing a cleaner matrix following reconstitution than native serum. This was confirmed by the LC-MS/MS assays of DSS displaying considerably more intensive peaks and lower noise than those observed during the analysis of DBS samples (Fig. 1). The key performance characteristics obtained in the validation studies were also superior in the DSS samples to those seen in the DBS specimens.
Conclusions
Both DBS and DSS may be suitable matrices for storing specimens for the retrospective evaluation of the vitamin D status in the future. While the application of a correction factor based on a simulated hematocrit value may prove valid and useful for the analysis of most DBS samples, false results will likely be obtained in samples with extreme hematocrits. Therefore, there lies some clinical risk in using archived DBS samples for the evaluation of vitamin D status. DSS, on the other hand, provides a valuable alternative in terms of matrix interferences, performance characteristics, and quality control.
Our findings highlight the importance of performing the clinical classification of 25OHD levels in archived samples based on method- and matrix-specific reference ranges and cutoff levels. The diversity of factors which interfere with the assayed 25OHD concentrations renders the evaluation of the clinical performance of various approaches highly valuable in addition to establishing the analytical indicators of agreement when cross-validating them for biopreservation purposes.
Footnotes
Acknowledgment
The authors are grateful to Ibolya Kocsis DPharm, PhD, for her contribution to the presented work.
Author Disclosure Statement
No competing financial interests exist.