




Abstract
Whole genome amplification (WGA) has become an invaluable method for preserving limited samples of precious stock material and has been used during the past years as an alternative tool to increase the amount of DNA before library preparation for next-generation sequencing. Myelodysplastic syndromes (MDS) are a group of clonal hematopoietic stem cell disorders characterized by presenting somatic mutations in several myeloid-related genes. In this work, targeted deep sequencing has been performed on four paired fresh DNA and WGA DNA samples from bone marrow of MDS patients, to assess the feasibility of using WGA DNA for detecting somatic mutations. The results of this study highlighted that, in general, the sequencing and alignment statistics of fresh DNA and WGA DNA samples were similar. However, after variant calling and when considering variants detected at all frequencies, there was a high level of discordance between fresh DNA and WGA DNA (overall, a higher number of variants was detected in WGA DNA). After proper filtering, a total of three somatic mutations were detected in the cohort. All somatic mutations detected in fresh DNA were also identified in WGA DNA and validated by whole exome sequencing.
Introduction
I
Samples and Methods
Patients and samples
The study included four MDS patients from the ICO-Hospital Germans Trias I Pujol (Badalona) diagnosed according to the World Health Organization classification. All samples were collected with patient consent, in accordance with the Declaration of Helsinki. Fresh bone marrow (BM) and peripheral blood (PB) samples were collected from each patient. Whole BM cells were obtained after BM erythrocyte lysis and were used as tumor samples. As a source of constitutional DNA, we used CD3+ T cells from each patient isolated from PB by magnet-activated cell sorting (Miltenyi Biotec, Bergisch Gladbach, Germany). DNA was extracted in all samples using the Maxwell 16 Blood DNA Purification Kit (Promega, Madison, WI). WGA was performed in all tumor DNA samples using REPLI-g (Qiagen, Hilden, Germany) (Fig. 1).
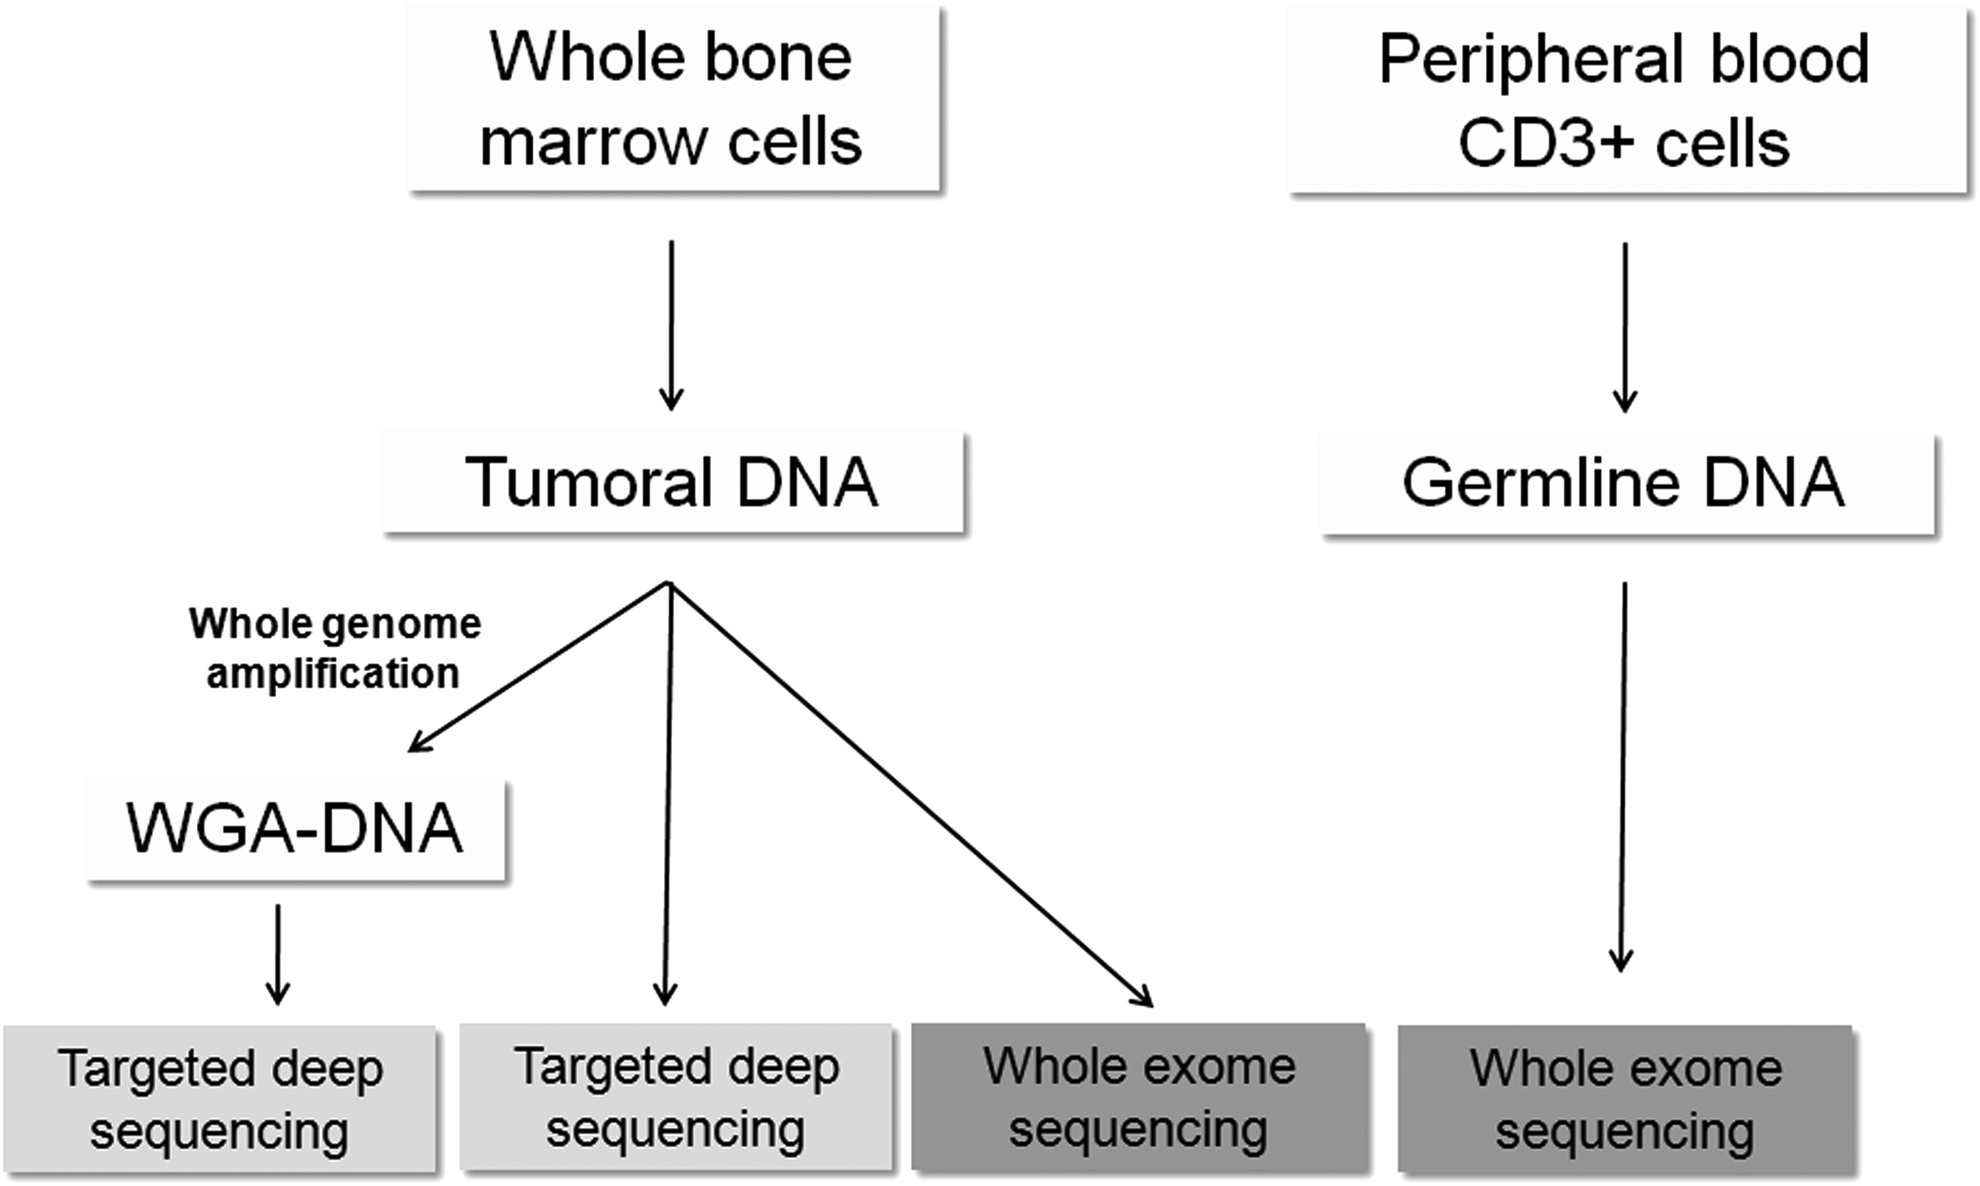
Workflow of this study.
Targeted deep sequencing
TDS libraries were prepared from both fresh DNA and WGA DNA, following the manufacturer specifications for TruSight Myeloid Sequencing Panel protocol (15054779 v01) (Illumina, San Diego, CA), and then sequenced on one single run on an Illumina MiSeq. This gene panel includes previously described oncogenic regions of 54 myeloid-related genes. 8
Whole exome sequencing
To validate the variants detected by TDS and also to identify true somatic variants, whole exome sequencing (WES) was performed in paired tumor and control (germline) samples. WES libraries were generated using the SureSelect Human Exome Kit 51Mb v4 (Agilent, Santa Clara, CA) and then sequenced on an Illumina HiSeq2000 (Illumina, San Diego, CA).
Analysis of NGS data
WES data were analyzed using the following pipeline. Alignment of raw data against the human genome build 37 (GRCh37/hg19) was performed using BWA v.0.5.9-r16, with default parameters for paired-end reads. 9 Realignment was performed using the Indel Realigner v 1.6-5-g557da77 tool from GATK, g557da77. 10 Picard Tools v 1.65 Mark Duplicates was used to remove duplicate reads (http://picard.sourceforge.net). Finally, base quality scores were recalibrated using the Table Recalibration GATK v 1.6-5-g557da77 tool. 10 Median coverage was 60 × . VarScan2 v 2.3 was used, comparing the tumor to the normal sample, to identify single nucleotide variants (SNVs) and small insertions and deletions (indels) that were inherited (germline variants), acquired in the tumor (somatic mutations) or of unknown status. 11 SAMtools mpileup v 0.1.18 was used to generate the required pileup files for VarScan2. 12
For TDS data analysis, reads were aligned against human genome build 19 (hg19) using BWA-MEM v 0.7.12. 9 Postalignment, including local indel realignment and base recalibration, was performed using the tools in GATK v 3.4.46 software package. 10 Packages SAMtools mpileup v 1.2 and VarScan2 v 2.4.0 were used for variant calling and ANNOVAR (v 2015Jun17) for variant annotation.11–13 Comparison with WES data from control sample was performed in each patient to discard germline variants, in both data from fresh DNA and data from WGA DNA.
Filtering of called variants, in both WES and TDS data, was performed using the following pipeline. First of all, we discarded variants located in highly variable regions, as previously defined. 14 Then, we retained exonic and splicing variants. Automatic filtering was performed using GNU Awk v.4.1.1 to remove variants with low quality, and GATK v3.4.46 (using VariantFiltration algorithm) to remove variants presenting strand bias. Finally, we performed additional manual filtering by observation on the integrative genome viewer (IGV), for which the following criteria were followed: (1) select variants located at a uniformly aligned region, (2) discard variants located at one of the ends of the amplicon, (3) if covered by >1 amplicon, discard variants only detected in one of these amplicons, (4) discard variants located at highly repetitive regions (at least six consecutive repetitive bases).
Statistical analysis
All statistical analyses, including analyses of raw sequencing metrics, were performed using the R statistical package. Differences in the number of variants between fresh DNA and WGA DNA were studied using the nonparametric Wilcoxon test for paired samples. p value <0.05 was considered as statistically significant.
Results
TDS metrics
A comparison of standard NGS metrics between fresh DNA and WGA DNA samples was performed after TDS (Table 1 and Supplementary Fig. S1; Supplementary Data are available online at www.liebertpub.com/bio). On average, fresh DNA samples generated 6.1 million reads (standard deviation [SD] = 2.0 million), with 99.8% (SD = 0.1) of the mapped reads on target and a mean target coverage of 12,208 × ± 3887. WGA DNA samples yielded about 5.3 million reads (SD = 1.5 million), with 99.2% (SD = 0.7) of the mapped reads on target and a mean target coverage of 10,508 × ± 2955. Across all the samples, a mean of 77% of total bases displayed a Q score ≥30, which did not differ between fresh DNA and WGA DNA (76% Q≥30 for fresh DNA vs. 77% Q≥30 for WGA DNA) (Supplementary Fig. S2).
MC, mean coverage; WGA, whole genome amplification.
Comparison of variants detected in fresh DNA and WGA DNA
Comparison of all called (before germline variant filtering) exonic and splicing variants within the four fresh/WGA pairs revealed a high level of discordance between fresh DNA and WGA DNA. A mean of 490 (SD = 137) variants and 1080 (SD = 489) variants per sample were detected in fresh DNA and WGA DNA, respectively, but the difference was not statistically significant (p = 0.068). Of note, PAIR 2 revealed a significantly higher number of variants exclusively detected in WGA DNA (WGA DNA-specific variants) compared to the other three pairs (Fig. 2A). The pairwise comparison across the paired samples showed, on average, a total of 16.2% (SD = 7.2) of shared variants, 22.6% (SD = 9.5) of unique variants exclusively detected in fresh DNA, and 61.2% (SD = 14.0) of unique variants exclusively detected in WGA DNA (Fig. 2A). Across these variants, considering both fresh DNA and WGA DNA, 95.7% (6009/6280) were detected at a low variant allele frequency (VAF) (<5%) (Supplementary Fig. S3). Of these, a mean of 472 (SD = 138) variants were found in fresh DNA, whereas 1031 (SD = 452) were seen in WGA DNA (p = 0.068). Therefore, stricter filtering was performed, in which all variants detected at a VAF <5% were removed from further analyses. After this, a mean of 19 (SD = 2) variants and 31 (SD = 12) variants were detected per sample in fresh DNA and WGA DNA, respectively (p = 0.068) (Fig. 2B).

Number of variants detected within the four fresh DNA/WGA DNA pairs.
WGA DNA as a source to detect somatic variants
To assess whether or not WGA DNA is a reasonable alternative to identify somatic variants, germline variants were removed by comparison with WES data from control DNA. Furthermore, additional filtering was performed automatically and by visual analysis on the IGV to discard artifacts introduced during WGA, sequencing, and analysis (Fig. 2C). All artifacts were detected at VAFs between 5% and 15% (variants with a VAF <5% had been previously removed). Recurrent artifacts called in all samples, including fresh DNA and WGA DNA, mostly corresponded to variants that showed strand bias and that were located at one of the ends of the amplicon. In contrast, artifacts that were only detected in WGA DNA mainly corresponded to small indels (1–2 bp long) located at highly repetitive regions. Overall, after discarding germline variants and removing artifacts by observation on the IGV, a total of four somatic mutations were detected in the cohort. In detail, Patient 1 did not harbor any somatic mutations. In Patient 2, a somatic splicing mutation in DNMT3A was detected in both fresh DNA and WGA DNA and was validated by WES. Patient 3 harbored two somatic mutations, which were detected in fresh DNA and WGA DNA and were also validated by WES. These corresponded to one missense mutation in CALR gene and a small frame shift deletion in RUNX1 gene. A somatic synonymous mutation was detected in DNMT3A in Patient 4. Overall, all somatic mutations detected in fresh DNA were also identified in WGA DNA and validated by WES (shared variants in Fig. 2C). There were no variants exclusively detected in fresh DNA.
WGA DNA-specific variants
A total of 13 variants were uniquely detected in WGA DNA, even after all filtering steps. These variants had VAFs between 10% and 25% and were not seen in fresh DNA by either TDS or WES. The fact that the coverage and alignment uniformity in these regions were equivalent between fresh DNA and WGA DNA, and the fact that the reference alleles were confidently called in fresh DNA, in both TDS and WES analyses, suggested that these variants corresponded to false positives introduced during the WGA process. Among these, 1 variant was identified in Patient 1, whereas the other 12 were seen in Patient 2 (Fig. 2C). Focusing on these variants, all of them corresponded to SNVs and the most recurrent introduced base was C (10/13). The detected base substitutions corresponded to G → T in 31% (4/13), C → T in 23% (3/13), A → T in 23% (3/13), T → C in 15% (2/13), and G → C in 8% (1/13) (Fig. 3).
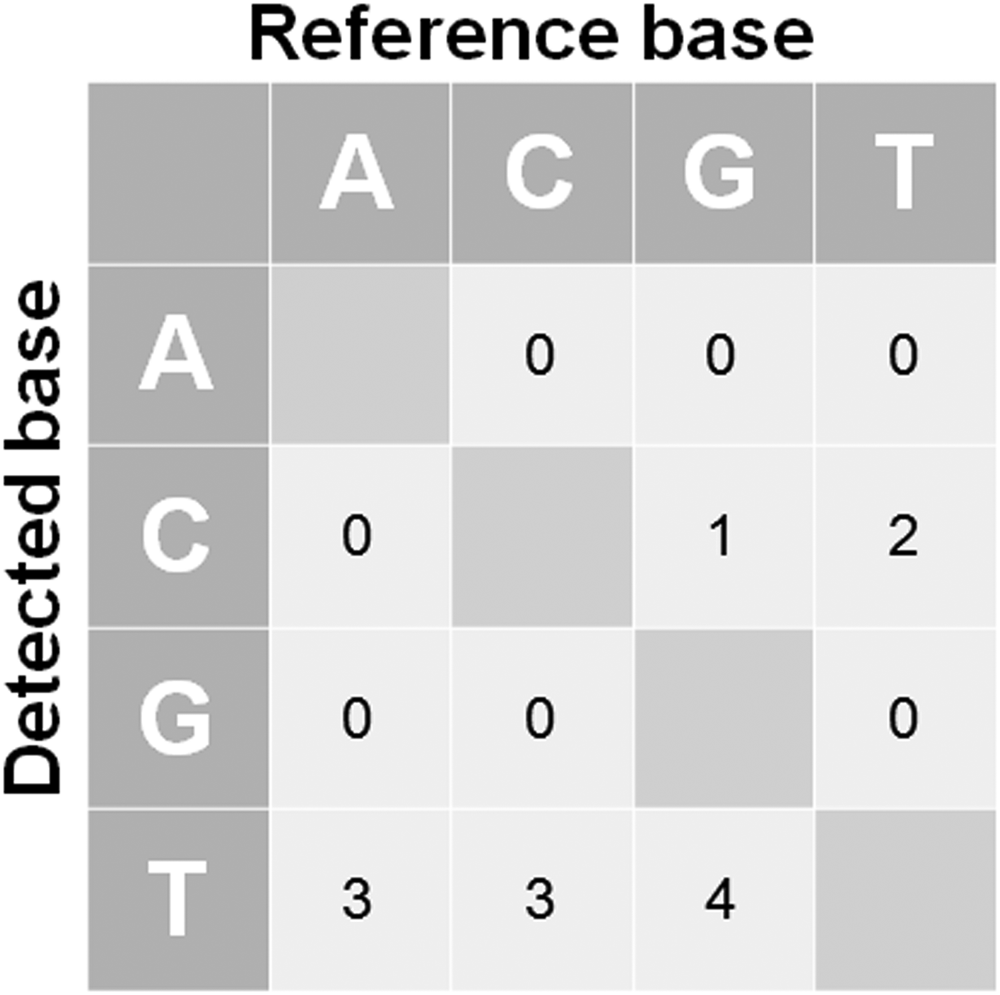
Base substitution detected in the 13 WGA DNA-specific SNVs. SNVs, single nucleotide variants.
Discussion
WGA is widely used in NGS wherein the amount of DNA is limited but follow-up analyses are required. In this study, we conducted a comparison of TDS data between four fresh WGA paired DNA samples to assess the feasibility of using WGA DNA for the detection of somatic variants in samples from MDS patients.
The results of this study highlighted that, in general, the sequencing and alignment statistics of fresh DNA and WGA DNA samples were similar: total number of reads, quality scores of sequenced bases, percentage of unmapped reads, percentage of properly mapped reads, on-target reads, depth of coverage, breadth of coverage. However, after variant calling and when considering variants detected at all frequencies, there was a high level of discordance between fresh DNA and WGA DNA. The number of variants detected by WGA DNA before germline variant filtering was higher than in fresh DNA for all the analyzed sample pairs. Across all called exonic and splicing variants, considering both fresh DNA and WGA DNA, 95.7% were detected at a low VAF (<5%). In addition, even though the difference was not statistically significant, a higher number of low frequency variants were detected in WGA DNA than in fresh DNA (p = 0.068). These findings suggest that WGA methods may introduce errors that result in artifacts detected mainly at low frequency. Thus, variants with a VAF <5% were removed from further analyses.
To compare the data between fresh DNA and WGA DNA regarding the detection of somatic variants, germline variants were removed and additional filtering was performed automatically and by observation on the IGV. After this, a total of four somatic mutations were detected (one in Patient 2, two in Patient 3, and one in Patient 4). Mutations in RUNX1 and DNMT3A are recurrently mutated in MDS and have been associated with poor prognosis.6,15 Mutations in exon 9 of CALR gene are frequent in patients with myeloproliferative neoplasms, but have been also reported in a small proportion of MDS patients. 16 Overall, all somatic mutations detected in fresh DNA were also identified in WGA DNA and validated by WES. These results are in agreement with previous studies, in which variants of WGA DNA samples are detected at high accuracy.5,17 Interestingly, previous studies report lower detection rates in WGA DNA from BM smears, so less accurate results would be expected with lower quality starting DNA, such as the one derived from BM smears or formalin fixed paraffin embedded (FFPE) tissue. 18
Regarding WGA DNA-specific variants, which were not detected in fresh DNA by either TDS or WES, they probably correspond to amplification artifacts introduced during the WGA process. Focusing on these variants, most of them (12/13) corresponded to WGA DNA of PAIR 2, showing that WGA in this sample may have not performed as efficiently as in the other cases. The quality (assessed by Nanodrop and Bioanalyzer) of gDNA in this sample did not differ from the others. However, we believe that this DNA sample may be more exposed to changes introduced during WGA. This sample could also correspond to a hypermutable neoplasm, because a much higher number of variants has been detected in this sample that the rest of pairs, before germline variant filtering.
The main limitation of this study is the small set of patients that have been studied. Moreover, there is one sample that behaves very differently than the others, but because of the small number of samples analyzed, we have no statistical power to be able to consider PAIR 2 as an outlier.
Overall, WGA DNA was useful in this set of samples for the detection of somatic variants with VAFs >5% by using TDS. However, we would not recommend the use of WGA DNA for the detection of small subclonal mutations, because it would not be possible to distinguish true somatic mutations from artifacts introduced during the WGA process at very low frequencies. Also, we draw attention to the importance of benchmarking before applying state-of-the-art experimental procedures to determine whether it is best suited to the experimental needs of the researcher.
In conclusion, we believe that applying the WGA technique in library preparation should be restrained to cases with limited material source and should be followed by a more in-depth and strict quality controls, bioinformatics analysis, and filtering process. Regarding genetic prognostic purposes, future studies need to be done to validate an accurate bioinformatics pipeline.
Footnotes
Acknowledgments
The authors would like to thank Illumina for providing the sequencing reagents that were used in this study. This work was supported, in part, by grants from the Ministerio de Educación Cultura y Deporte (FPU13/03770); Instituto de Salud Carlos III, Ministerio de Economia y Competividad, Spain (PI/14/00013); Red Temática de Investigación Cooperativa en Cáncer (RTICC, FEDER) (RD12/0036/0044); 2014 SGR225 (GRE) Generalitat de Catalunya; with economical support from CERCA Programme/Generalitat de Catalunya, Fundació Internacional Josep Carreras, Obra Social “la Caixa” and Celgene Spain.
Author Disclosure Statement
No conflicting financial interests exist.
References
Supplementary Material
Please find the following supplemental material available below.
For Open Access articles published under a Creative Commons License, all supplemental material carries the same license as the article it is associated with.
For non-Open Access articles published, all supplemental material carries a non-exclusive license, and permission requests for re-use of supplemental material or any part of supplemental material shall be sent directly to the copyright owner as specified in the copyright notice associated with the article.
