
Abstract
Long-term storage of whole blood can affect the integrity of DNA if it is not done under optimal conditions. The aim of this study was to determine whether long-term storage (2–19 years) of whole blood samples at −30°C had a negative effect on the quality or quantity of genomic DNA that could be recovered at extraction. Genomic DNA was isolated from 2758 whole blood samples collected in 4 mL EDTA vacutainers from 1997 to 2012. DNA was extracted using the Qiagen® FlexiGene® DNA kit. The average storage duration at −30°C was 12 years. The quality and quantity of the isolated DNA were assessed using spectrophotometry (NanoDrop™), a fluorometric assay for double-stranded DNA (Qubit™), and agarose gel electrophoresis. The mean DNA yield per sample was found to be 114 μg from whole blood volumes that ranged from 0.5 to 4 mL. The mean A260/280 ratio and median A260/280 ratios were both 1.8. No correlation was found between the duration of storage and the total yield or the quality of DNA extracted. These data suggest that high-quality DNA can be extracted from whole blood samples that are stored at −30°C for up to 19 years.
Introduction
D
Large genetic epidemiological studies can involve the collection of tens of thousands of valuable whole blood samples that can be, or have been, stored for many years. The blood volume available for DNA extractions is an obvious indicator of DNA yield. 3 However, long-term storage conditions of whole blood can affect the integrity of DNA. 4 Blood samples stored at 4°C for a short period of time will still yield DNA of acceptable quality provided the correct blood collection tubes were used.1,5 However, the desired temperature for whole blood samples for DNA isolation is at −80°C for long-term storage. 4 Whole blood samples can also be frozen at −20°C for long-term storage,4,6,7 however, other studies have found lower DNA yields following this approach.1,7 A study by Di Pietro et al. found that whole blood samples stored for long periods at −20°C yielded high-quality DNA for genotyping studies, although the sample size was small (n = 82). 8
The current study sought to determine whether the duration of long-term storage of whole blood samples, using a large sample size (n = 2758), stored at a stable −30°C, has a negative effect on the quality and quantity of the genomic DNA extracted.
Materials and Methods
Samples
Samples analyzed were sourced from the Johannesburg Cancer Case–Control Study (JCS) at the National Cancer Registry (NCR) of South Africa. The JCS is a large, recently (2016) ended case–control study established in 1995. 9 In brief, the JCS recruited newly diagnosed cancer patients of black African ancestry. These patients were interviewed by trained research nurses and their blood was collected with informed consent for future research as approved by the Research Ethics Committee at the University of the Witwatersrand and described by Urban et al. 9 Blood samples were drawn from patients in 4 mL EDTA vacutainers and were stored in −30°C freezers until further use. More than 20,000 whole blood samples (representing various cancer types) have been collected since March 1995 for the JCS, of which a subset of 2758 blood samples were used for this study. DNA extractions were performed on request for specific studies in collaboration with the JCS. At the time of the study being reported here, DNA had been extracted from 2758 blood samples for four different studies. Ethical approval was obtained from the University of the Witwatersrand Human Research Ethics Committee (Medical), clearance numbers: M140271 and M120117.
Sample storage
All blood samples collected under the JCS were kept at room temperature until collected for transport. The blood samples were then transported in a cooler box with an ice block from the three separate study sites to a centralized storage facility. On the rare occasion that there was an issue with the transportation, samples were frozen at the collection site and collected at the next available time. Average transit time was ≤30 minutes. All samples were frozen in their collection tubes in an upright position at −30°C within a maximum of 24 hours of collection. Miele™ −30°C general freezers were used for sample storage. The freezers' temperatures were monitored with an alarm-based system and backup freezers were available. As part of our risk management strategy, when a freezer failed, the samples were transferred to another freezer before thawing. All the blood samples were frozen in an upright position and thereafter stored on their sides. Although the blood was collected in a 4 mL EDTA tube, not all were filled to capacity; therefore, the volume of the blood sample available for extraction was noted before DNA extraction. Sample information was managed using Microsoft Excel and then incorporated into STATA database.
DNA isolation
Whole blood samples collected between 1997 and 2012 (n = 2758) were extracted. DNA extraction procedures occurred in batches between May 2013 and June 2016. Six different technicians were involved over the 4-year period. The technicians were trained on the extraction protocol, blinded to the storage duration of the blood samples, and each technician extracted samples collected over the whole time period. Total genomic DNA was isolated using the FlexiGene® DNA Kit (Qiagen®). This kit was chosen initially for its ability to handle a diverse range of input blood volume and then used subsequently for consistency. Extractions were undertaken following the manufacturer's protocol, with the following minor modifications: the use of a dry heat incubator instead of a hot water bath, and resuspension of the DNA pellet in 1× Tris-EDTA buffer (Invitrogen™) instead of the supplied FG3 buffer. To ensure no wastage and optimum yield, the entire blood volume in a tube was used for DNA extraction. Two fixed protocols, one for samples with <2 mL of blood and the other for >2 mL, were optimized and used as per the manufacturer's procedures. The most noticeable difference between protocols was the use of 50 mL Nunc tubes for samples with blood volumes of >2 mL, rather than the 15 mL Nunc tubes used for samples with blood volumes of <2 mL. Reagent volumes were adjusted as per the sample volume (as per the manufacturer's protocol). The centrifugation conditions were unchanged. No RNAse digestion was incorporated into the DNA isolation protocol.
DNA quantity and quality
DNA quantity and purity were assessed spectrophotometrically using the NanoDrop™ 1000 (Thermo Scientific™) directly after extraction and before storage at −30°C. DNA concentration was measured and DNA purity was calculated through the standard A260/280 and A260/230 ratios. This is a fast and accurate technique for determining DNA concentration of pure samples. 10 DNA/RNA and proteins have their maximum absorbance at 260 and 280 nm, respectively. An A260/280 ratio of ∼1.8 is generally accepted as a reflection of a pure DNA sample and a ratio of ∼2.0 is generally accepted as pure for RNA. A secondary measurement of the A260/230 ratio is used to determine the purity of DNA against other contaminants. A higher A260/230 is expected for pure DNA (∼2.0–2.2). Low A260/230 ratios indicate the presence of contamination or proteins that absorb light at the 230 nm wavelength. 11
Genomic DNA integrity assessment was done, at a later stage, using gel electrophoresis for 218 samples selected at random (4–19 years storage, mean = 12 years) (Fig. 1). Genomic DNA was resolved on 0.8% agarose gel, stained with GelRed™, at 8 V/cm for 45 minutes against the GeneRuler 1 kb Plus DNA Ladder (Thermo Scientific).

Gel image showing integrity of genomic DNA from 4 to 19 years of blood sample storage. One representative sample was used from each year of storage (4–19 years). Two microliters of genomic DNA was resolved on 1.0% agarose gel with GelRed™ staining. GeneRuler™ 1 kb plus DNA Ladder MM was used for sizing reference. Electrophoresis was done at 8 V/cm for 45 minutes. MM, molecular marker.
DNA quantitation was additionally assessed using a second methodology. Qubit fluorometry was performed using the Qubit™ 3.0 Fluorometer (Thermo Scientific). This method uses the double-stranded DNA (dsDNA) broad range assay to quantify dsDNA, as opposed to single-stranded DNA (ssDNA), present in a sample. Only a subset of samples (n = 200) was quantified using this chemistry owing to cost restraints. The 200 samples were randomly selected for year of collection (2–19 years of storage), with concentrations representative of the overall DNA concentration range. This measures dsDNA concentration only, which provides a more useful reading as contaminants, including degraded DNA and RNA, are not measured. The percentage of dsDNA (%dsDNA) was calculated by dividing the Qubit concentration by the NanoDrop concentration and multiplying by 100.
Analysis
Descriptive statistics were compiled by years of storage. Means and medians were calculated for DNA yields, DNA concentrations, blood volume available per sample, DNA yield per milliliter of blood, A260/280 and A260/230. Both means and medians were compiled given the non-normally distributed nature of the data, which may limit the mean accuracy.
Spearman's ranked correlations were performed to determine whether duration of storage (years) of the samples, blood volume available for extraction, and the age of participants correlated with the total DNA yields. Samples (n = 564) without blood volume data were excluded.
Kruskal–Wallis H tests, with multiple group comparisons, were performed to determine whether DNA yields, A260/280 and A260/230 ratios, differed between the different years of storage duration. Kruskal–Wallis H tests were also used to determine differences in mean DNA yield per milliliter of blood across different storage durations as well as to determine differences in mean total DNA yields measured by Qubit and differences in mean %dsDNA across different storage durations. A nonparametric test for trend was performed to evaluate the relationship between %dsDNAs across the storage duration of the blood samples. Quantile regression estimating the conditional median was performed to model the effect of storage duration of the blood samples, blood volume available for DNA extraction, and age and gender of the participants had on the %dsDNA.
A two-sample t-test with equal variances was performed to assess the difference in mean DNA yield per 1 mL of blood between the two different DNA extraction protocols as well as mean DNA yield per 1 mL of blood between cancer samples and noncancer samples and between HIV-positive and HIV-negative samples.
Results
Total genomic DNA was isolated from a total of 2758 samples collected between 1997 and 2012 for the JCS (Table 1). NanoDrop data were used to calculate DNA yield, DNA concentration, and to determine A260/280 and A260/230 ratios. Blood samples were stored on average for 11.9 years. The longest storage period of samples before DNA extraction was 19 years (n = 125) and the shortest was 2 years (n = 31) (Table 1). Information on the volume of blood collected was available for 80% (n = 2206) of all samples (Table 1). Freezers were monitored closely so that no thawing of samples (resulting from freezer failures) happened during this study.
Mean blood volume per sample.
Mean DNA concentrations and median and mean DNA yields are calculated using NanoDrop™ data.
SD, standard deviation.
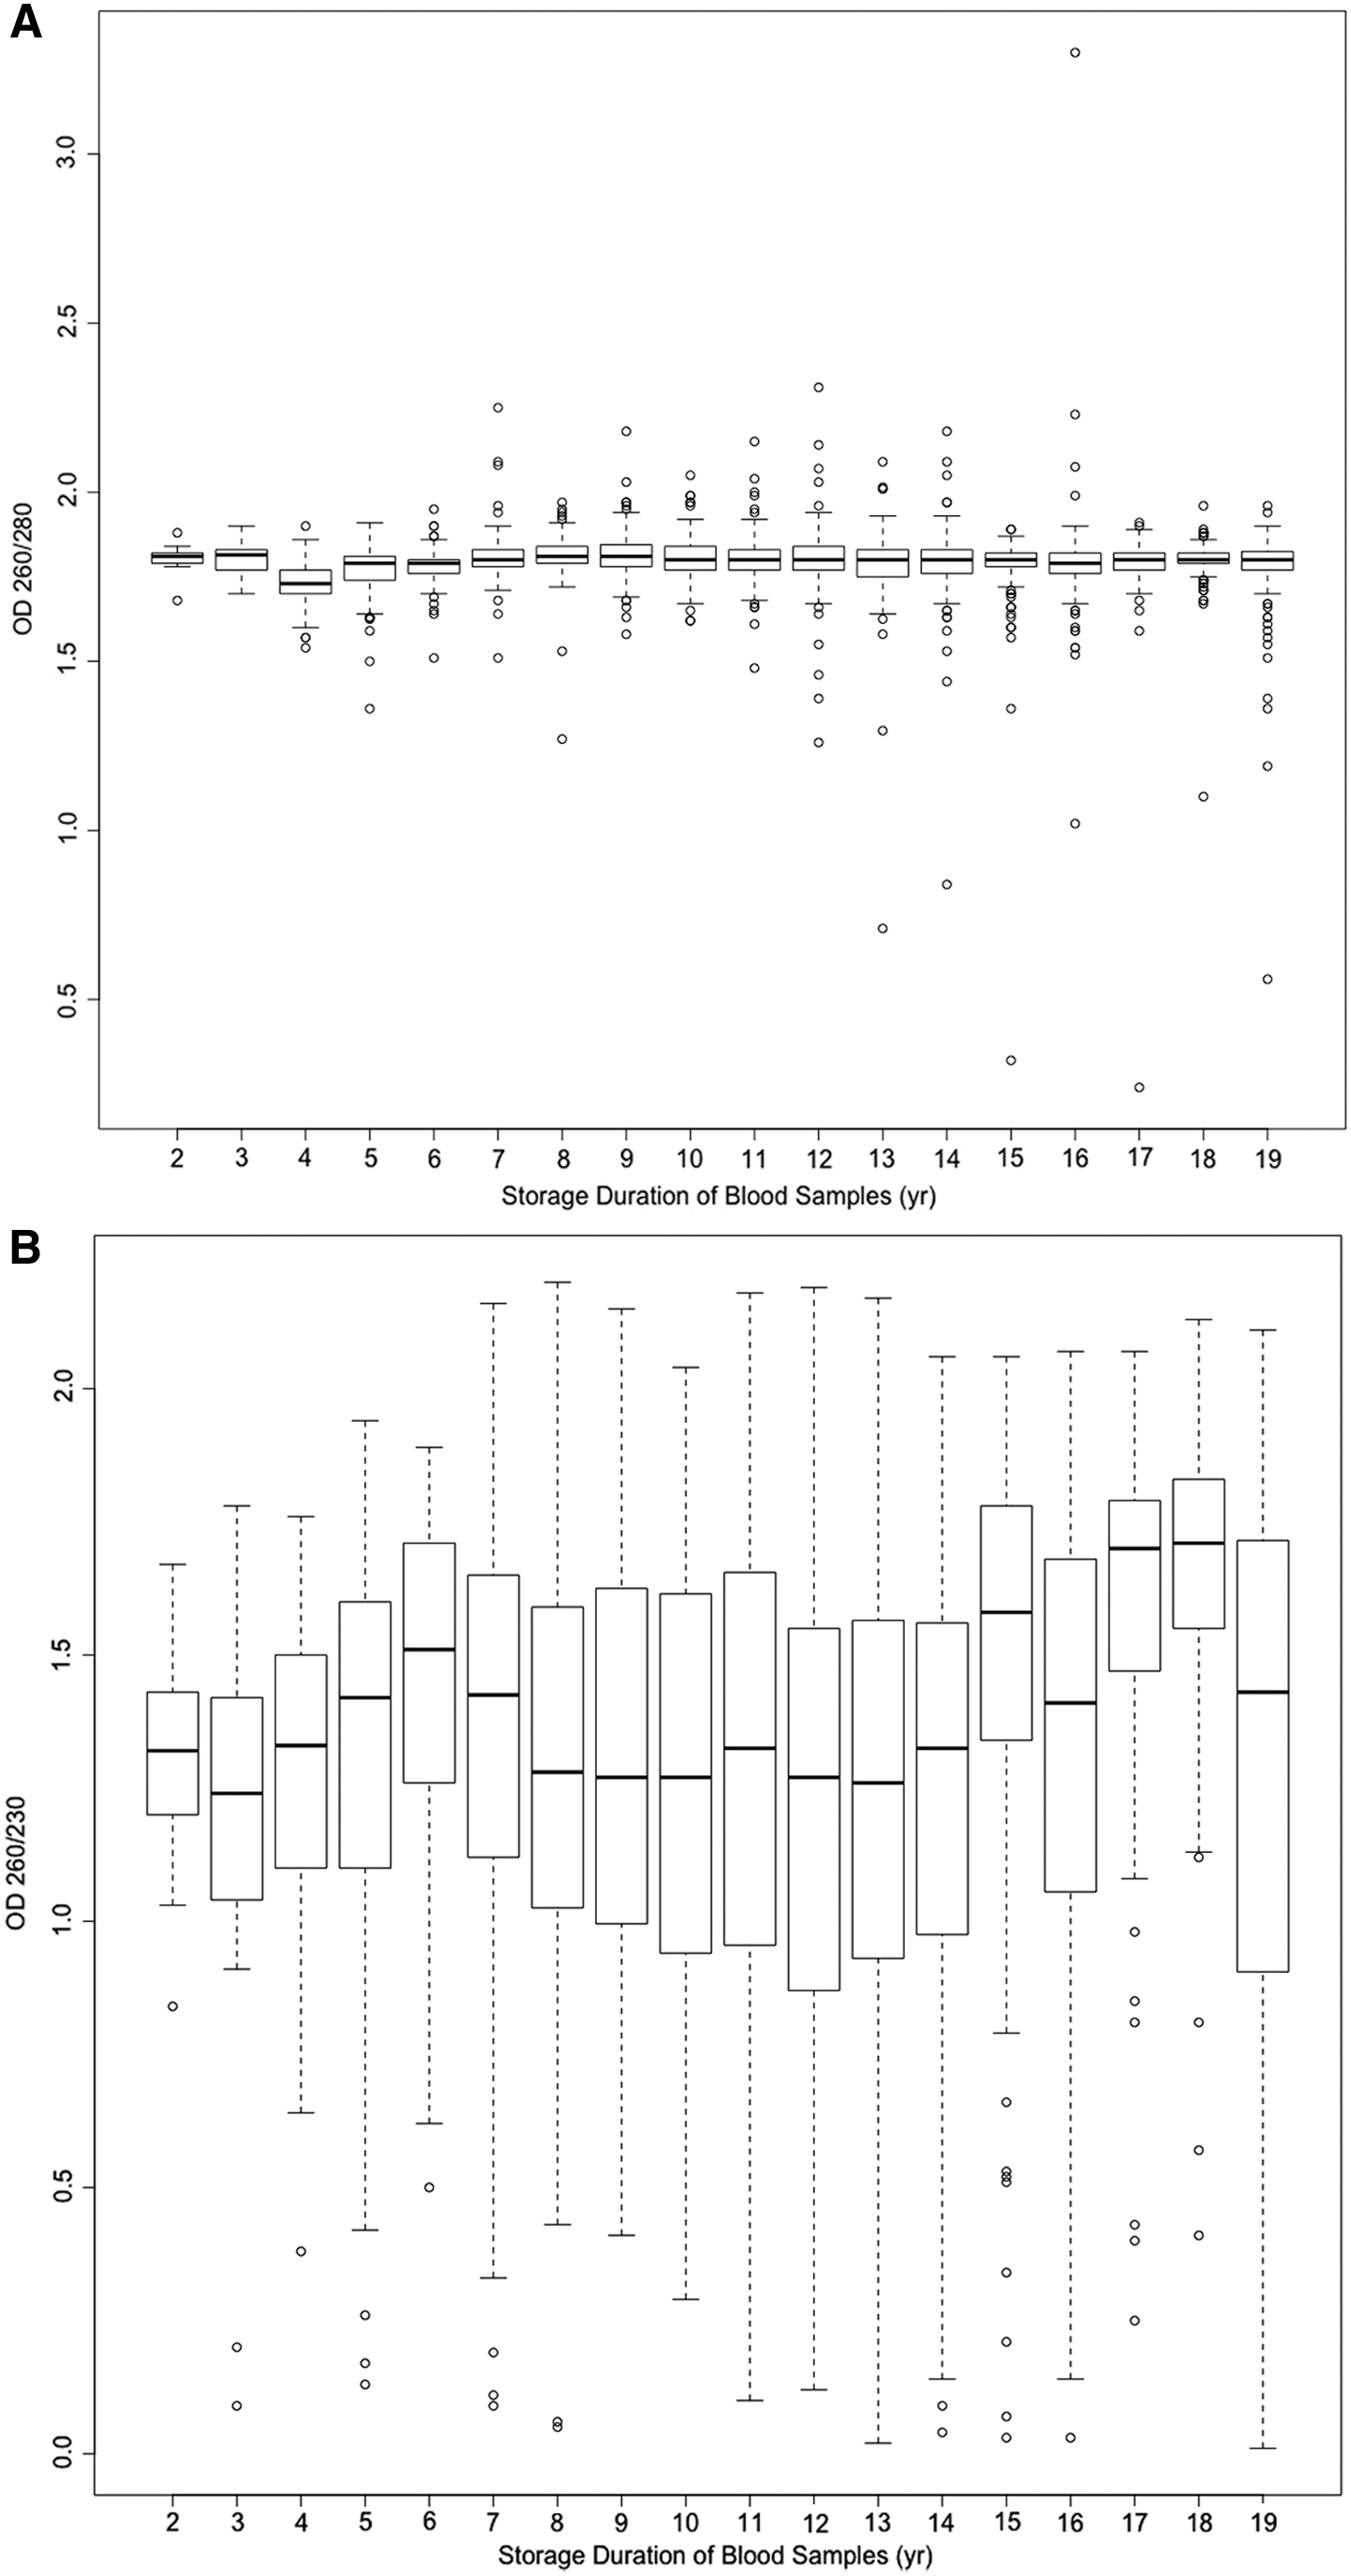
The quality (A260/280 and A260/230 ratios), concentration (ng/μL), and the quantity of isolated DNA (μg), and the mean and median concentration per year of storage for the samples are shown in Table 1. The mean A260/280 ratio across all samples was 1.79 and median A260/280 ratio was 1.8, suggesting that good-quality DNA was isolated. The mean A260/230 ratio across all samples was 1.71 and the median A260/230 ratio was 1.78, <2.0, suggesting the presence of proteins, contaminants, or RNA residues that absorb at 230 nm or less.
Genomic DNA from 218 samples was subjected to agarose gel electrophoresis to assess possible degradation. High-molecular-weight staining was observed for all 218 samples. Figure 1 shows a representation of the gel electrophoresis result for a representative subset of samples, which had been stored for different periods of time. A consistent low level of partial degradation (low intensity of smearing from the genomic band down to 3 kb) was noted across most samples analyzed on gel electrophoresis. The consistency of this smearing pattern suggests that this is likely an artifact from the DNA isolation protocol that caused DNA smearing rather than storage-related DNA degradation.
The DNA yields of samples per year of storage clustered tightly together, except for a few outlier samples with very high DNA yields or extremely low DNA yield (Fig. 2). The presence of the outliers illustrates the value of the median as a more informative reporting tool than the mean.

Range and distribution of DNA yields per 1 mL of blood extracted from frozen whole blood stored over 4–19 years. Blood volume data were not available for 2 and 3 years of storage. No statistically significant difference in yield was observed across the duration of blood storage. DNA yields were measured by NanoDrop.™
The average yield for all samples was 108.95 μg as measured by NanoDrop, whereas the average yield for the 200 samples measured by Qubit was 86.19 μg per sample. This indicates that ∼79% of total DNA measured by spectrophotometry was dsDNA, with the remaining proportion presumed to be ssDNA and/or denatured or degraded DNA. A plot of dsDNA percentage against the storage duration is shown in Figure 3.
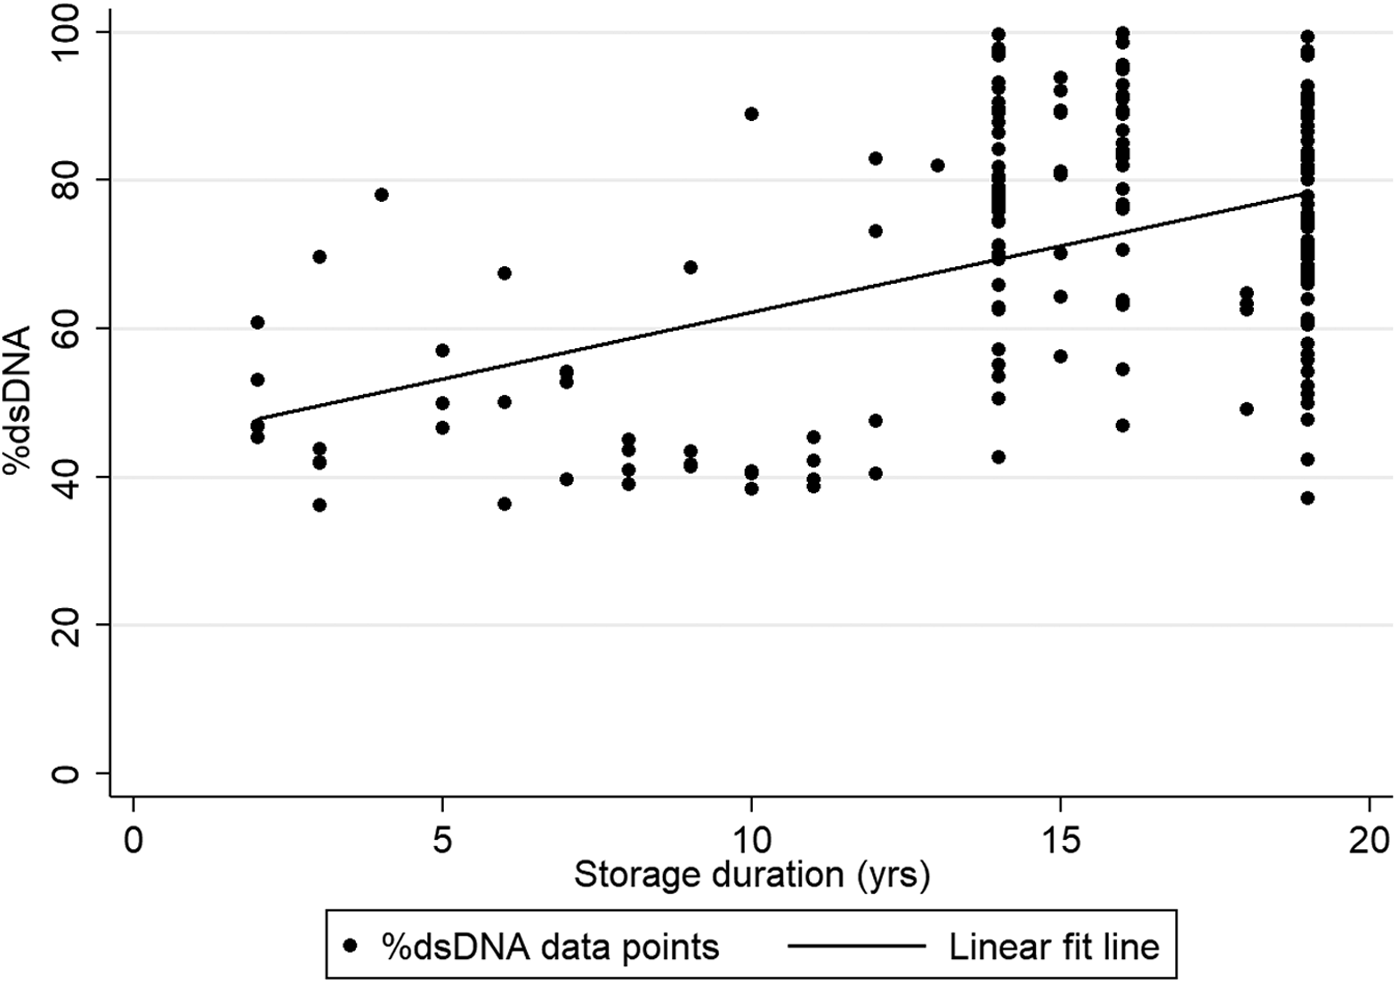
%dsDNA versus storage duration. The linear fit line indicates that a positive trend exists between %dsDNA and the increase of storage duration. %dsDNA, percentage of double-stranded DNA.
A Kruskal–Wallis H test showed that no statistically significant differences exist between the mean total DNA yield by Qubit measurements and the number of years of storage (p = 0.46) and no statistically significant differences exist between the mean %dsDNA and the number of years of storage (p = 0.10). Nonparametric trend analysis for %dsDNA, quantified by Qubit across the storage durations, indicated a positive trend (z = 6.24, p < 0.001), with the %dsDNA increasing with increased storage duration of the blood samples. However, storage duration of the blood samples had a negligible effect on %dsDNA after adjusting for blood volume used for extraction, age, and gender (β = 0.01, p = 0.045).
Spearman's ranked correlation was performed to assess the relationship between total DNA yields, storage duration of blood samples, blood volumes available for extractions, and age of participants at recruitment using 2194 samples. After Bonferroni correction, there was a strong positive correlation observed between the total blood volumes available for extractions and the total DNA yields, which was statistically significant, rs = 0.2258, p < 0.0001. So, the more total volume of blood available the more total DNA yield there was. There was no evidence of correlation between storage duration of blood samples or age of participants at recruitment with total DNA yields. There was no evidence of correlation between total blood volumes with A260/280 or A260/230 ratios.
A Kruskal–Wallis H test, after Bonferroni correction and correcting for technician variability, showed that no statistically significant differences exist between the DNA yields, A260/280 or A260/230 ratios, and the number of years of storage. As expected, total blood volume is a direct indicator of the amount of total DNA available (rs = 0.2258, p < 0.0001). Similarly, no statistically significant differences were observed between the mean DNA yield per milliliter of blood and the storage duration of the blood sample (p = 0.25).
The FlexiGene DNA Kit (Qiagen) gave an expected DNA yield of 37.5 μg per 1 mL of blood assuming a normal white cell count of 7 × 10⁶ cells/mL blood. 12 The JCS sample yield was between 25.83 and 46.54 μg (mean = 37.77 μg) of DNA per 1 mL of blood.
The effect of the optimized protocols for different sample blood volumes was assessed using a two-sample t-test with equal variances. Samples with blood volumes of 2 mL or less (n = 403) yielded more DNA per 1 mL of blood (44.12 μg, 95% CI: 39.73–48.51 μg) when compared to DNA yielded per 1 mL of blood for samples with blood volumes of >2 mL (n = 1792) (36.79 μg, 95% CI: 35.42–38.16 μg) (p = 0.0001). The typical DNA yields of the FlexiGene kit for a 2 mL volume would be 33–45 μg/mL. No difference in mean DNA yield per 1 mL of blood was observed between cancer samples (n = 1482) and noncancer samples (n = 707) (p = 0.50). A difference in mean DNA yield per 1 mL of blood was observed between HIV-positive (n = 1851) and HIV-negative samples (n = 313), with HIV-negative samples (38.70 μg, 95% CI: 37.23–40.17 μg) yielding ∼5 μg DNA more per milliliter than HIV-positive samples (33.36 μg, 95% CI: 29.39–37.32 μg) (p = 0.0076).
Discussion
This study was undertaken to answer questions about the expected quality and quantity of DNA isolated from whole blood samples that have been stored at −30°C between 2 and 19 years. The concern was that long-term storage of whole blood at −30°C may have a negative effect on the quality and/or quantity of the DNA. 7 Genomic DNA was isolated from 2758 blood samples collected between 1997 and 2012 using the Qiagen FlexiGene DNA kit. To our knowledge this is the largest study of its kind assessing the quality and quantity of DNA isolated from frozen blood samples stored for long periods.
The results from our study are unique from previous findings1,7 as we used a different DNA extraction method (kit vs. salting out or phenol/chloroform), stored samples at −30°C temperature (compared to room temperature and 4°C), and used a much larger sample size. The large sample size of our study affords greater statistical power to evaluate the relationship between DNA yields and storage duration of the blood samples. A recent publication looking at various storage conditions on forensic examinations of blood samples and blood stains (n = 6) concluded that to prevent DNA degradation during long-term (20 year) storage, they should be stored at below −20°C, 13 as our samples have been. We have a much larger sample size with varying lengths of storage to assess and have found that the quantity of DNA is not affected, and are fairly confident that the same can be said about the quality.
This study found that long-term storage of whole blood samples at −30°C does not have a negative effect on the quality and quantity of the DNA extracted. The average duration of storage was ∼12 years. The mean A260/280 ratios were found to be ∼1.8 across all the years of collection, suggesting high purity of the DNA regardless of the duration of blood storage (Fig. 4A). The lower than expected A260/230 ratios indicate the presence of other organic residues (Fig. 4B). The source of the organic residues is likely artifacts resulting from the inadequate removal of organic chemicals used in the extraction chemistry.
The DNA yield was expected to decrease for samples stored for longer periods. Alrokayan reported a 30%–40% decrease in total DNA yield for whole blood samples frozen at −20°C. 7 A decrease in DNA yield was not observed in the JCS samples extracted, as no correlation between storage duration and total DNA yields was observed. Assuming the blood samples are stored within the desired temperature range at stable conditions, DNA can be extracted from these samples after prolonged storage. DNA yields of samples per year of collection clustered tightly together for the 2–19 years, except for a few outliers (Fig. 2).
High-quality dsDNA is preferred for downstream applications such as polymerase chain reaction (PCR), microarray analysis, or next-generation sequencing analysis. Qubit is well known to be a more sensitive method to quantify DNA, compared to the NanoDrop.14,15 Qubit readings are lower than NanoDrop readings as they do not measure single-stranded, degraded DNA.14,15 Our results showed that, on average, 79% of total DNA measured by NanoDrop was dsDNA. From the subset of samples analyzed on Qubit, the %dsDNA did not decrease with increased years of storage (p = 0.10); instead, a positive trend was seen with increasing storage duration but the effect size was minimal (β = 0.01, p = 0.045). This supports our hypothesis that storage duration of the blood samples does not influence DNA quality. It is worth noting that although DNA was extracted from these archived blood samples, no assessments were done for RNA, micro-RNA, cell-free circulating DNA, or proteins.
The DNA yields are in line with expected yields cited by the manufacturers. With every additional 1 mL of blood volume available for extraction, the DNA yield would be expected to increase by 20.94 μg (p < 0.01). The DNA yield per milliliter of blood does not increase when more blood was processed. Rather, optimization of the DNA extraction protocol used for different volumes of blood affects the DNA yield per milliliter of blood. Two fixed protocols were used in this study, the protocol for sample volumes of <2 mL of blood yielded ∼7 μg (p = 0.0001) more DNA per milliliter of blood than the protocol used for samples of >2 mL of blood. This is possibly due to the extra time and care given per extraction for the small volumes of these samples because of the limited volume. It is possible that the potential yield could be improved by optimizing the extraction protocol to the exact blood volume available. This would, however, require extra laboratory time and staff.
The patients' age may also influence the number of white cells available.5,16 In older patients there is often a decline in the quantity of DNA due to a reduction in the number of leukocytes and lymphocytes with age progression. 17 However, this correlation was not observed in this study. As anticipated, samples from individuals who were HIV positive at the time of sampling had a lower DNA yield as a likely consequence of fewer peripheral blood mononuclear cells due to infection. However, no difference in mean yield was observed between cancer samples and noncancer samples.
One limitation of this study was that gel electrophoresis and fluorometry were not done for all 2758 samples to assess the integrity of the extracted DNA at the beginning of DNA storage. Hence the data lack robustness to definitively conclude that long-term storage of blood samples does not negatively affect DNA integrity. However, from the representative subset of samples (n = 200) that were assessed by gel electrophoresis, the authors are confident that the DNA integrity of DNA extracted from long-term stored blood samples is sound. A comprehensive analysis would include doing a quantitative PCR or a long-range PCR and we have applied for funding to do this. We have used these samples in other genotyping studies and they have produced adequate genotyping call rates (unpublished).
From the results of this large study, the authors are confident that long-term storage (average 11.9 years) of whole blood samples stored in 4 mL EDTA vacutainers at a stable −30°C does not have a negative effect on the quality and quantity of the DNA. The authors are also confident that the DNA integrity assessment done on a representative sample is sufficient to represent the larger cohort. Despite the limitations of this study, we found no evidence that DNA integrity worsened over a prolonged period of blood sample storage. Archived whole blood samples can still be utilized in genetic epidemiology studies provided the blood samples are stored correctly with constant temperature monitoring to prevent freeze/thaw episodes.
Footnotes
Acknowledgments
The authors acknowledge Sisters Gloria Mokwatle, Patricia Rapoho, and Pheladi Kale who carried out the interviews and collected blood specimens from the patients included in this analysis, Mrs. Lettie Bester who prepared the specimens for testing and storage, and Mrs. Margaret Urban and Mr. Tonicah Maphanga for maintaining the JCS database. They thank Dr. Mazvita Sengayi for statistical analysis support and Ms. Cassandra Soo and Ms. Natalie Smyth for fluorescent DNA quantification. They also thank the oncology clinicians and the administration at Charlotte Maxeke Johannesburg Academic Hospital (formerly Johannesburg General Hospital) for assistance and for access to patients in their care, and the patients who gave freely of their time. Research reported in this publication and ongoing extraction of DNA from JCS blood samples are supported by the Grants, Innovation and Product Development (GIPD) Unit of the South African Medical Research Council with funds received from the South African National Department of Health and the U.K. Medical Research Council from the U.K. Government's Newton Fund. The authors thank the DST/NRF internship program for supporting B.N., A.S., S.T.D., and L.J. while interns at CERG. They thank the DAAD/NRF in country scholarship for a fellowship to W.C.C., and the Cancer Association of South Africa (CANSA) for research cost support to C.G.M. The contents are solely the responsibility of the authors and do not necessarily reflect the views of the funding bodies.
Authors' Contributions
W.C.C.: substantial contributions to conception and design, acquisition of data (DNA extraction), analysis and interpretation of data, and final approval of the version to be published. R.K.: interpretation of data, revising the article critically for important intellectual content, and final approval of the version to be published. A.M.: analysis and interpretation of data, revising the article critically for important intellectual content, and final approval of the version to be published. B.N., A.S., S.T.D., and L.J.: acquisition of data (DNA extraction), maintenance of the database and summary report (base of manuscript), and final approval of the version to be published. C.G.M.: interpretation of data, revising the article critically for important intellectual content, and final approval of the version to be published. C.B.d.V. conceived the project, substantial contributions to conception and design, interpretation of data, revising the article critically for important intellectual content, and final approval of the version to be published.
Author Disclosure Statement
No conflicting financial interests exist.