
Abstract
Cryopreservation of viable cells and cell materials is being developed for biological and biopharmaceutical applications. The inhibition of ice formation during the cooling and warming phase of vitrified living biological samples is important for their survival. The tendency to form glasses (glass transition temperature, Tg) upon cooling in the vitrification solution and the stability of the amorphous state upon warming to determine the critical cooling rate (Vccr) and critical warming rates (Vcwr) are evaluated. The study of thermal properties of ethylene glycol (EG) and 1,2-propanediol (PD) solutions were performed to improve vitrification through better understanding of their molecular mobility and viscosity. Two sets of aqueous solutions were tested. In group A, 35% EG (w/w) was added to different PD concentrations (5%, 10%, and 15%). In group B, 20% PD (w/w) was combined with varying concentrations of EG (20%, 24%, 27%, and 30%). Using the semiempirical model of Boutron, the values of Vccr and Vcwr for group A were 10, 8, <2.5°C/min, and 1.65 × 10⁵, 678, 32°C/min, respectively. For group B, the values were 24, 10, <2.5, <2.5°C/min, and 9.5 × 10³, 144, 48, 7°C/min, respectively. While the values of Vccr and Vcwr for 40% EG were 123 and 8.84 × 10⁵°C/min, respectively. The methyl group in PD enhanced the vitreous state, lowering the melting point. Adding a small concentration of PD (3%) to VM3 vitrification solution improved and increased the Tg and enhanced their thermal stability. Analyzing the thermal properties of cryoprotectant is useful when designing the cryopreservation protocols.
Introduction
C
As found in prior studies, liquid water contains a large number of broken hydrogen bonds, and most molecules in liquid water have two hydrogen-bonded configurations, one strong donor and one strong acceptor. 23 In the presence of antifreeze substances called CPAs, the vitreous state is obtained by rapid cooling to cryogenic temperature. 6 Cryoprotective agents take part in the tetrahedral hydrogen bond network of water, preventing the water from crystallizing into ice.20,21,24 Ice formation begins with the formation of a nucleus (nucleation) and then the growth of an ice crystal from the nucleus. This ice formation process is influenced by the type and concentration of additive cryoprotectants. 25 CPAs suppress ice nucleation and reduce crystal growth rates, hence reducing the cooling rates required for successful vitrification.26,27 The greater depression of the water freezing point due to the CPAs formula, and hence the attendant increase in the viscosity near the freezing point is the reason for the sluggish crystallization in these solutions. 28 It should be noted that there is a critical threshold value of CPA concentrations (or a minimum CPA mixing ratio) that permits glass formation without an occurrence of crystallization during cooling at a given rate. However, a higher concentration is required to prevent devitrification during warming. 29 The required concentration of any solute to vitrify during cooling, or remain vitreous during warming, depends on the chemical structure of the solute to prevent the ice structure.
The presence of methyl groups (CH3) in typical CPAs enhances vitrification properties. 3 The chemical structure differs between EG and PD by only one methyl group in the latter. Furthermore, cryoprotective agents, which can act as moderately strong bases are more potent CPAs, and the presence of methyl groups on hydroxyl carbons enhances further their cryoprotective properties by increasing the electron density around the neighboring oxygen atom. 30 The strong hydrogen bonding interactions between water and solutes suppress the rapid nucleation of ice and decrease the molecular mobility such that the nucleation probability is decreased and glass formation occurs at low temperatures. Thus, the increased glass-forming tendency of CPAs essentially results from the electronegative groups and the hydrogen bonds they form with water molecules. Ethylene glycol (EG) is often proposed as the main cryoprotectant in different mixtures because it exhibits low toxicity and penetrates cells more easily than 1,2-propanediol (PD) does.3,14,21,24,26,31 On the other hand, PD, also known as propylene glycol, displays a high glass-forming tendency and provide high stability of the amorphous state.11–16,18,32 Propanediol contains two polar groups that interact strongly with water and it is among the most penetrating CPAs and helps prevent ice formation when used in vitrification mixtures.
Interestingly, although many studies have focused on the physical properties of solutions containing mixtures of CPAs,5–22,28 surprisingly few studies have dealt with the thermal properties of the ternary aqueous solution of water–EG–PD. In an attempt to optimize the cryopreservation of arthropods, we studied the thermal kinetics properties (glass-forming tendency during cooling and stability of the wholly amorphous state on warming) of various aqueous solutions between EG and PD by differential scanning calorimetry (DSC). For studying the effects of both EG and PD by decreasing the freezing point in vitrification solution, we investigated the critical cooling rate (Vccr: above which the solutions are fully vitrified), and the critical warming rate (Vcwr), which is the lowest rate necessary to avoid devitrification on warming.
Materials and Methods
EG and propanediol (propylene glycol) obtained had a purity of 99% (Sigma-Aldrich, St. Louis, MO). Aqueous solutions were prepared with ultrapure water (ROMIL-Sps Ltd., United Kingdom) and concentrations given in weight percent (w/w). Cooling and warming thermogram analysis of the EG and PD solutions obtained using a differential scanning calorimeter (DSC8000; PerkinElmer), at sample weights of 9.52 ± 0.7 mg, placed in sealed aluminium pans. An empty sample pan was placed in the reference oven of the DSC to balance the instrument. Each aqueous solution was tested at least two to three times. Liquid droplets were deposited on the side of the pan to ensure the largest contact area possible and to avoid separation into smaller droplets during operation. The oven temperature of the DSC was calibrated by measuring the onset of heptane melting at −90.56°C, whereas heat flow was calibrated by measuring the melting heat of indium (Tm = 156.6°C, ΔH = 28.45 J/g). All aqueous CPA solutions were studied during cooling and warming between −150°C (below the vitreous transitions of the solutions) and +10°C, at a rate of 2.5, 5, 10, 20, 40, and 80°C/min.
33
Warming thermograms were obtained after quenching the samples at 130°C/min. The area of the exothermic peak of the crystallization curve was obtained from the DSC thermograms to determine the heat of ice solidification for each tested cooling rate. The heat of solidification was converted to a dimensionless quantity (q), defined as the percent ratio of heat released during freezing versus the heat that would be released if a mass of water equal to the entire solution mass were frozen. The values of q obtained, which measure the amount of ice formed during cooling, were plotted as a function of the cooling rate for each solution. The critical cooling rate, determined as the rate, where less than 0.2% of the solution was crystallized, was calculated according to the fourth model of Boutron7,8:
In this equation, x is the ratio of the total quantity of ice crystallized on cooling versus the maximum crystallizable ice formed during very slow cooling, qmax [i.e., x = q/qmax (0 ≤ x ≤ 1)], and ν is the cooling rate. The terms k4 and qmax are initially unknown constants that are adjusted by curve fitting software (Microsoft Excel) to give the best least squares fit to the measured values of q. Theoretical Vccr values [representing the cooling rate at which the quantity of ice formed on cooling becomes negligible (i.e., at q = 0.2; corresponding to approximately 0.2% of the frozen solution mass)], were then calculated from the values of k4 and qmax using the following equation5,8:
The constant k4 can be considered as characteristic of the glass-forming tendency since as k4 gets smaller the glass-forming tendency increases. 7 The vitreous transition temperature Tg can be identified at the inflexion point of the rapid increase curve of the specific heat that corresponds to the glass transition. The exothermic devitrification peak of ice, which grows during rewarming, is termed Td. Td rises as the warming rate increases. 4 The temperature of the end of ice melting (Tm) is the temperature at the top of the melting peak.8,9,15,16 The critical warming rate is reached when Td approaches Tm and recrystallization is avoided. Warming thermograms were analyzed to obtain Tg, Td, and Tm. We chose to plot Tm–Td (ice melting temperature–ice devitrification temperature) as a function of the logarithm of the warming rate for easy comparison with previously published data. The critical warming rate (Vcwr; the minimal rewarming rate necessary to avoid devitrification) is then calculated from the measurement of Td at two different warming rates. The Vcwr values were calculated according to the model of Boutron, 18 and computed using the method of Wowk et al. 33 To determine stability of the vitreous state, thermograms were obtained during rewarming of vitrified samples as rates stated above. Two warming thermograms at a given warming rate were performed for each solute concentration, although one is enough because the variability of the warming data was very small as stated before. 33 The critical warming rate was defined to be equal to the experimental warming rate, for which the quantity of melted ice drops below 0.5%. 18
To determine the thermal properties of the aqueous solutions at different concentrations of EG or PD, we conducted the experiments using two series of samples, where either the EG or PD concentration was kept constant and that of the other CPA was varied. Group A samples involved an aqueous solution of 35% EG with PD concentrations of 0% (control), 5% (A1), 7%, 10% (A2), or 15% (A3).
Due to the difficulty in calculating concentration accuracy between 1% and 2%, we deleted the result of 7% +35% EG from Table 1, but it was included in figures for confirming the results' progress. Group B samples included aqueous solutions of 20% PD and EG concentrations of 0% (control), 20% (B1), 24% (B2), 27% (B3), and 30% (B4). We compared those solutions with our main penetrating cryoprotectant, 40% EG, which was added to results of both groups A and B. The DSC scanning results were confirmed by visual observation of the ice nucleation status (Figs. 5 and 6). Visual observations recorded using a high-quality camera (Nikon D700, Japan) with a SIGMA 180 mm objective. The visual analysis protocol was similar to the method described by Wowk et al. 34 In this study, each sample of 1.0 mL was taken from the solutions and placed in 10-mL glass scintillation vials. The vial samples were cooled to approximately −130°C by suspending them over liquid nitrogen for 16 min. The vials were removed, dipped in methanol (to prevent frost formation), and allowed to warm to room temperature in air. The mean of warming rate (up to Tm) was ∼8°C/min. Using this procedure and showing the effect of adding PD in cryoprotective mixture, 3% PD was added to a vitrification solution called VM3, a low-toxicity and stable formula against ice formation composed of 16.84% w/v EG, 12.86% w/v formamide, 22.3% w/v dimethyl sulfoxide, 7% w/v PVP K12 (polyvinylpyrrolidone of Mr 5000 Da), and 1% w/v final concentrations of commercially available supercool X-1000 and supercool Z-1000 ice blockers in PBF (phosphate-buffered medium plus 5% fetal bovine serum), (21st Century Medicine, CA). 35 The aim of adding 3% PD to VM3 for DSC analysis was testing the thermal effects of a small concentration of PD on another vitrification solution such as VM3 that already has EG.
Group A samples involved an aqueous solution of 35% EG with PD concentrations of 0% (control), 5% (A1), 7%, 10% (A2), or 15% (A3). Group B samples included aqueous solutions of 20% PD and EG concentrations of 0% (control), 20% (B1), 24% (B2), 27% (B3), and 30% (B4). qmax = crystallization constant; Vccr = critical cooling rate; Vcwr = critical warming rate. Tm and q are given as mean value ± SE. Transition temperatures (°C) and q were measured during warming at 2.5°C/min, whereas qmax and k4 were calculated using the procedure of Wowk et al. (33). Vccr and Vcwr were computed according to Boutron (8), and Boutron and Mehl (18), respectively.
CPA, cryoprotectant; EG, ethylene glycol; PD, 1,2-propanediol.
Results
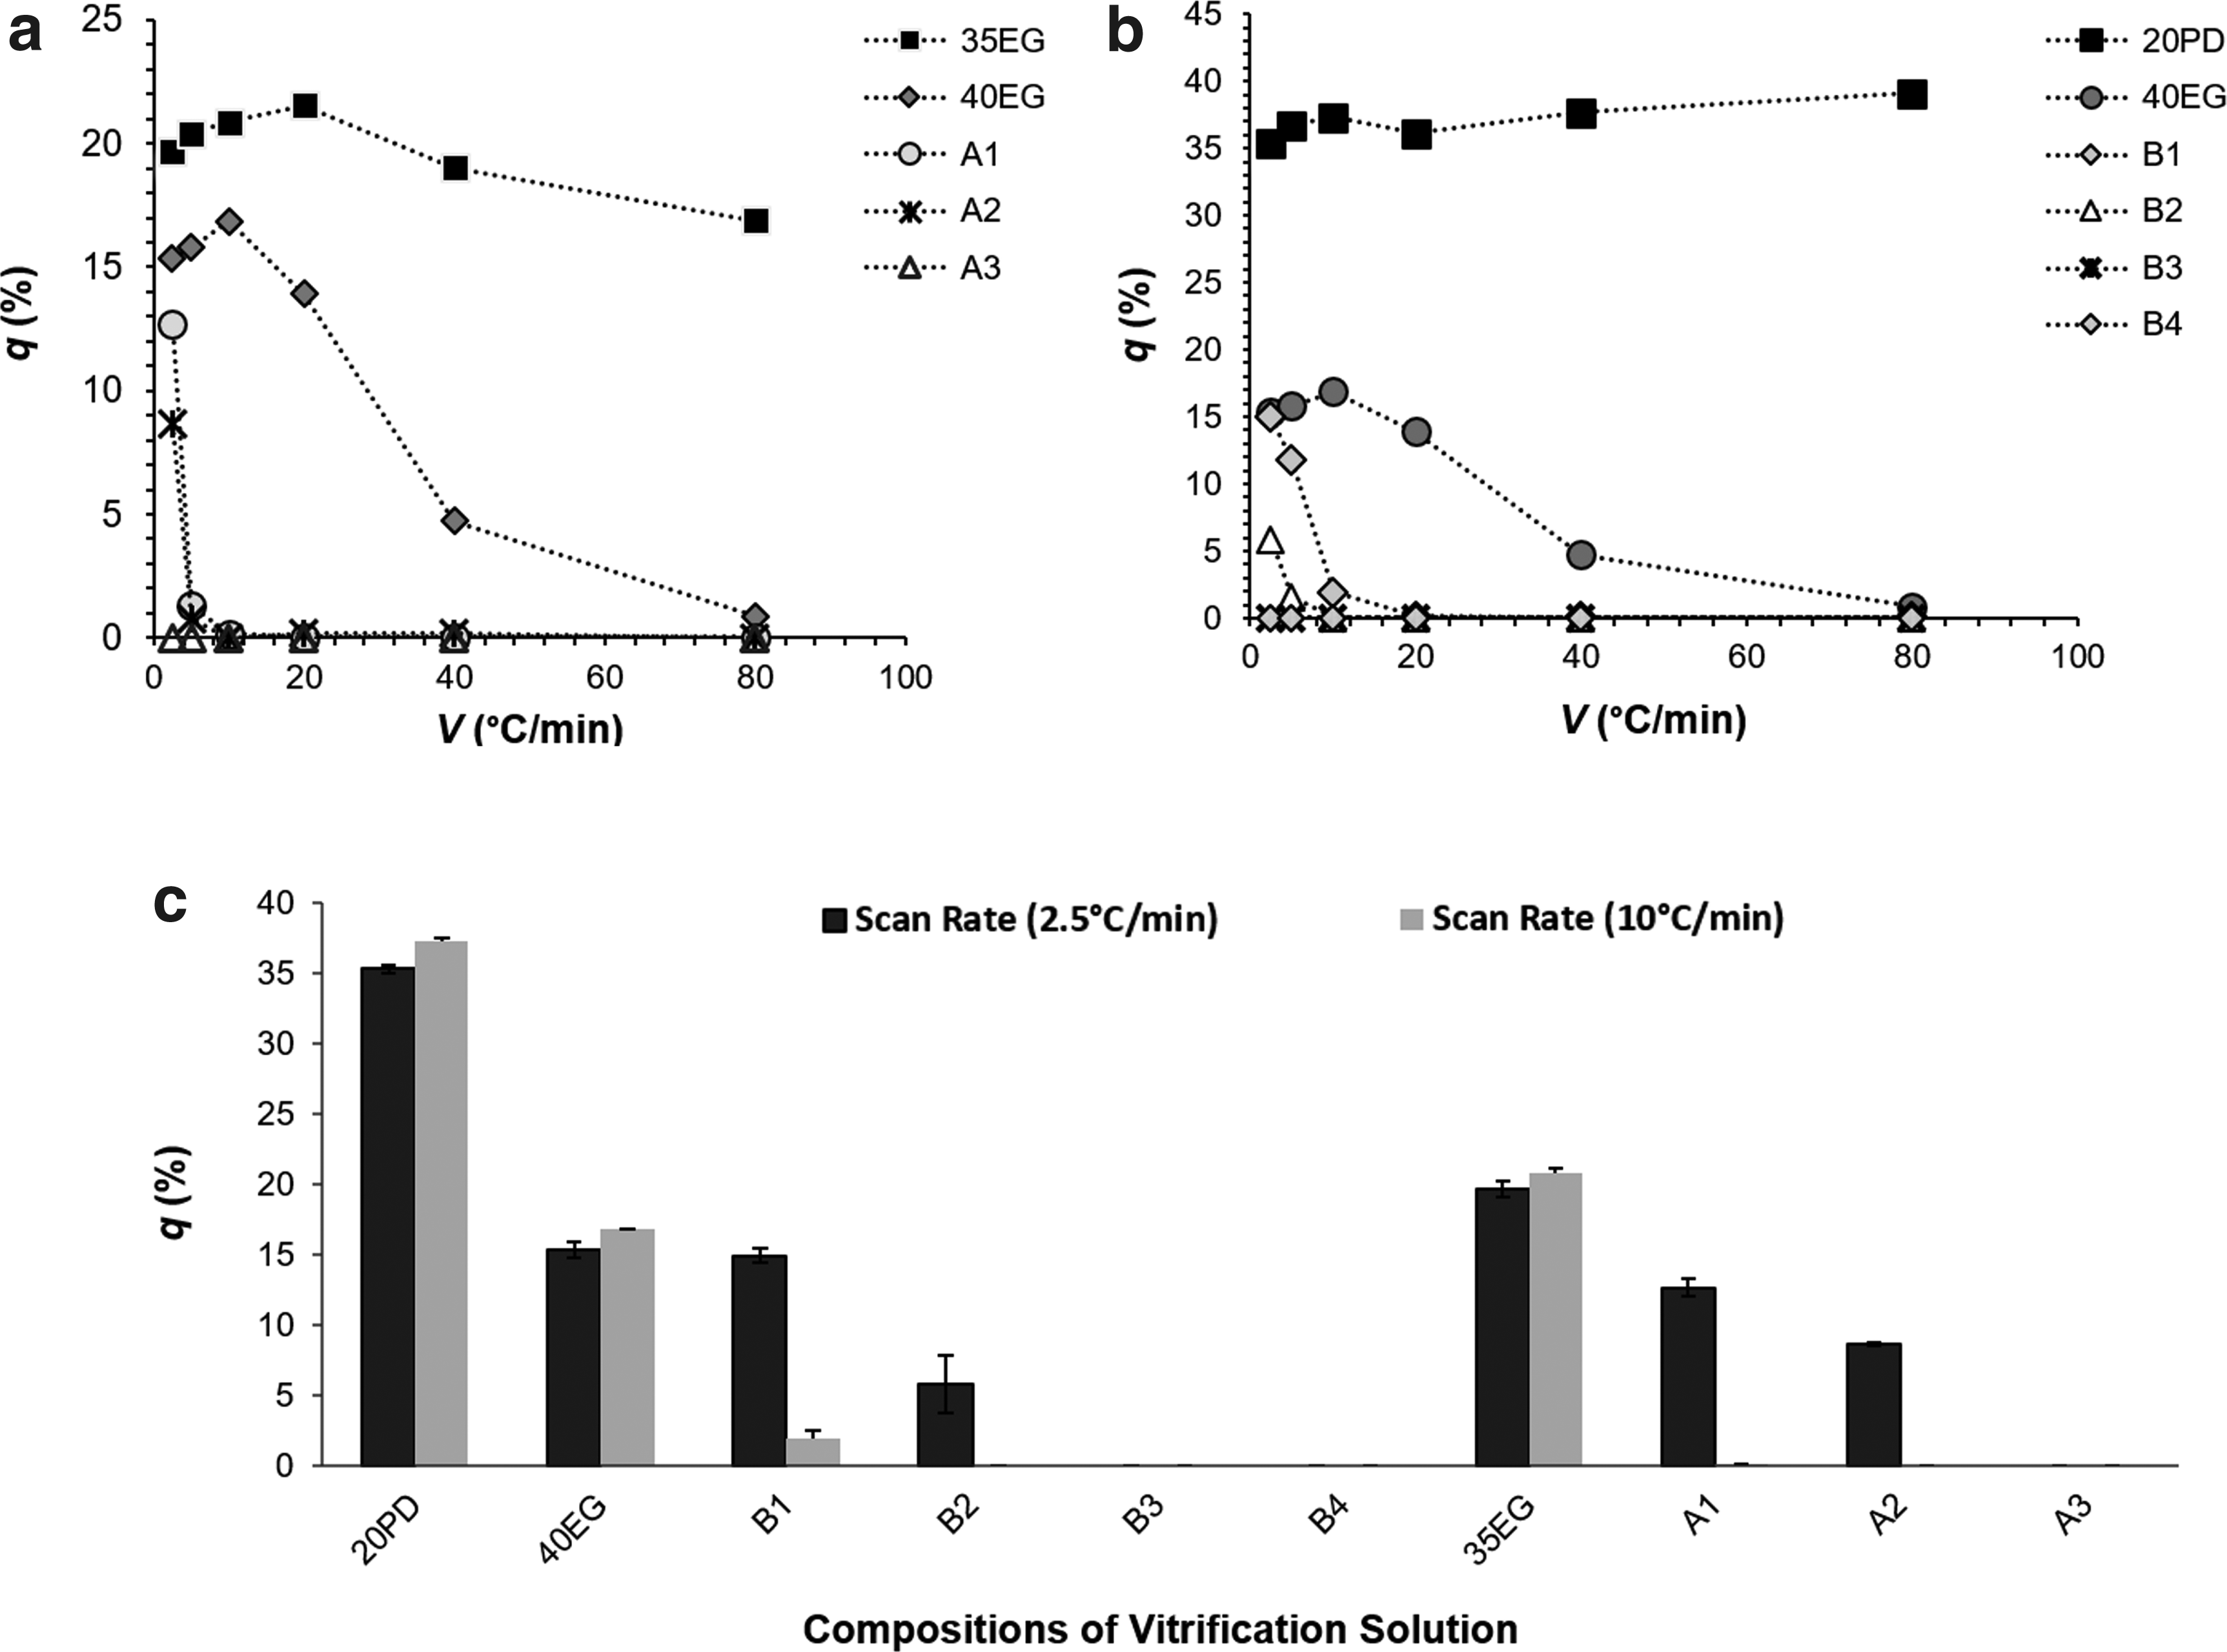
In group A, adding the PD to EG solutions reduced cooling rates required for avoiding ice crystallization. The solution of 35% EG showed the freezing state at all measured cooling rates (even when using the cooling rate of 130°C/min), thus preventing measurement of the critical warming rate. The ratio of formed ice (q) in 40% EG solution decreased rapidly when the cooling rate increased as a function of PD concentration and reached a near zero at a cooling rate of 80°C/min. A1 and A2 solutions did not show ice formation at cooling rates ≥20°C/min and ≥10°C/min, respectively. Freezing was avoided for all cooling rates studied in the A3 solution (50% water) (Fig. 1a).
The percentage of crystallized ice (q) on cooling aqueous solutions of group A 35% EG with different amounts of PD
To study the stability of the amorphous state during the warming of the vitrified samples, rewarming thermograms at a lower heating rate (2.5°C/min) were produced for the samples in group A (Fig. 2). The calculated critical warming rates were defined as the rate at which the Td and Tm peaks disappear due to overlap (shown in Table 1). 36
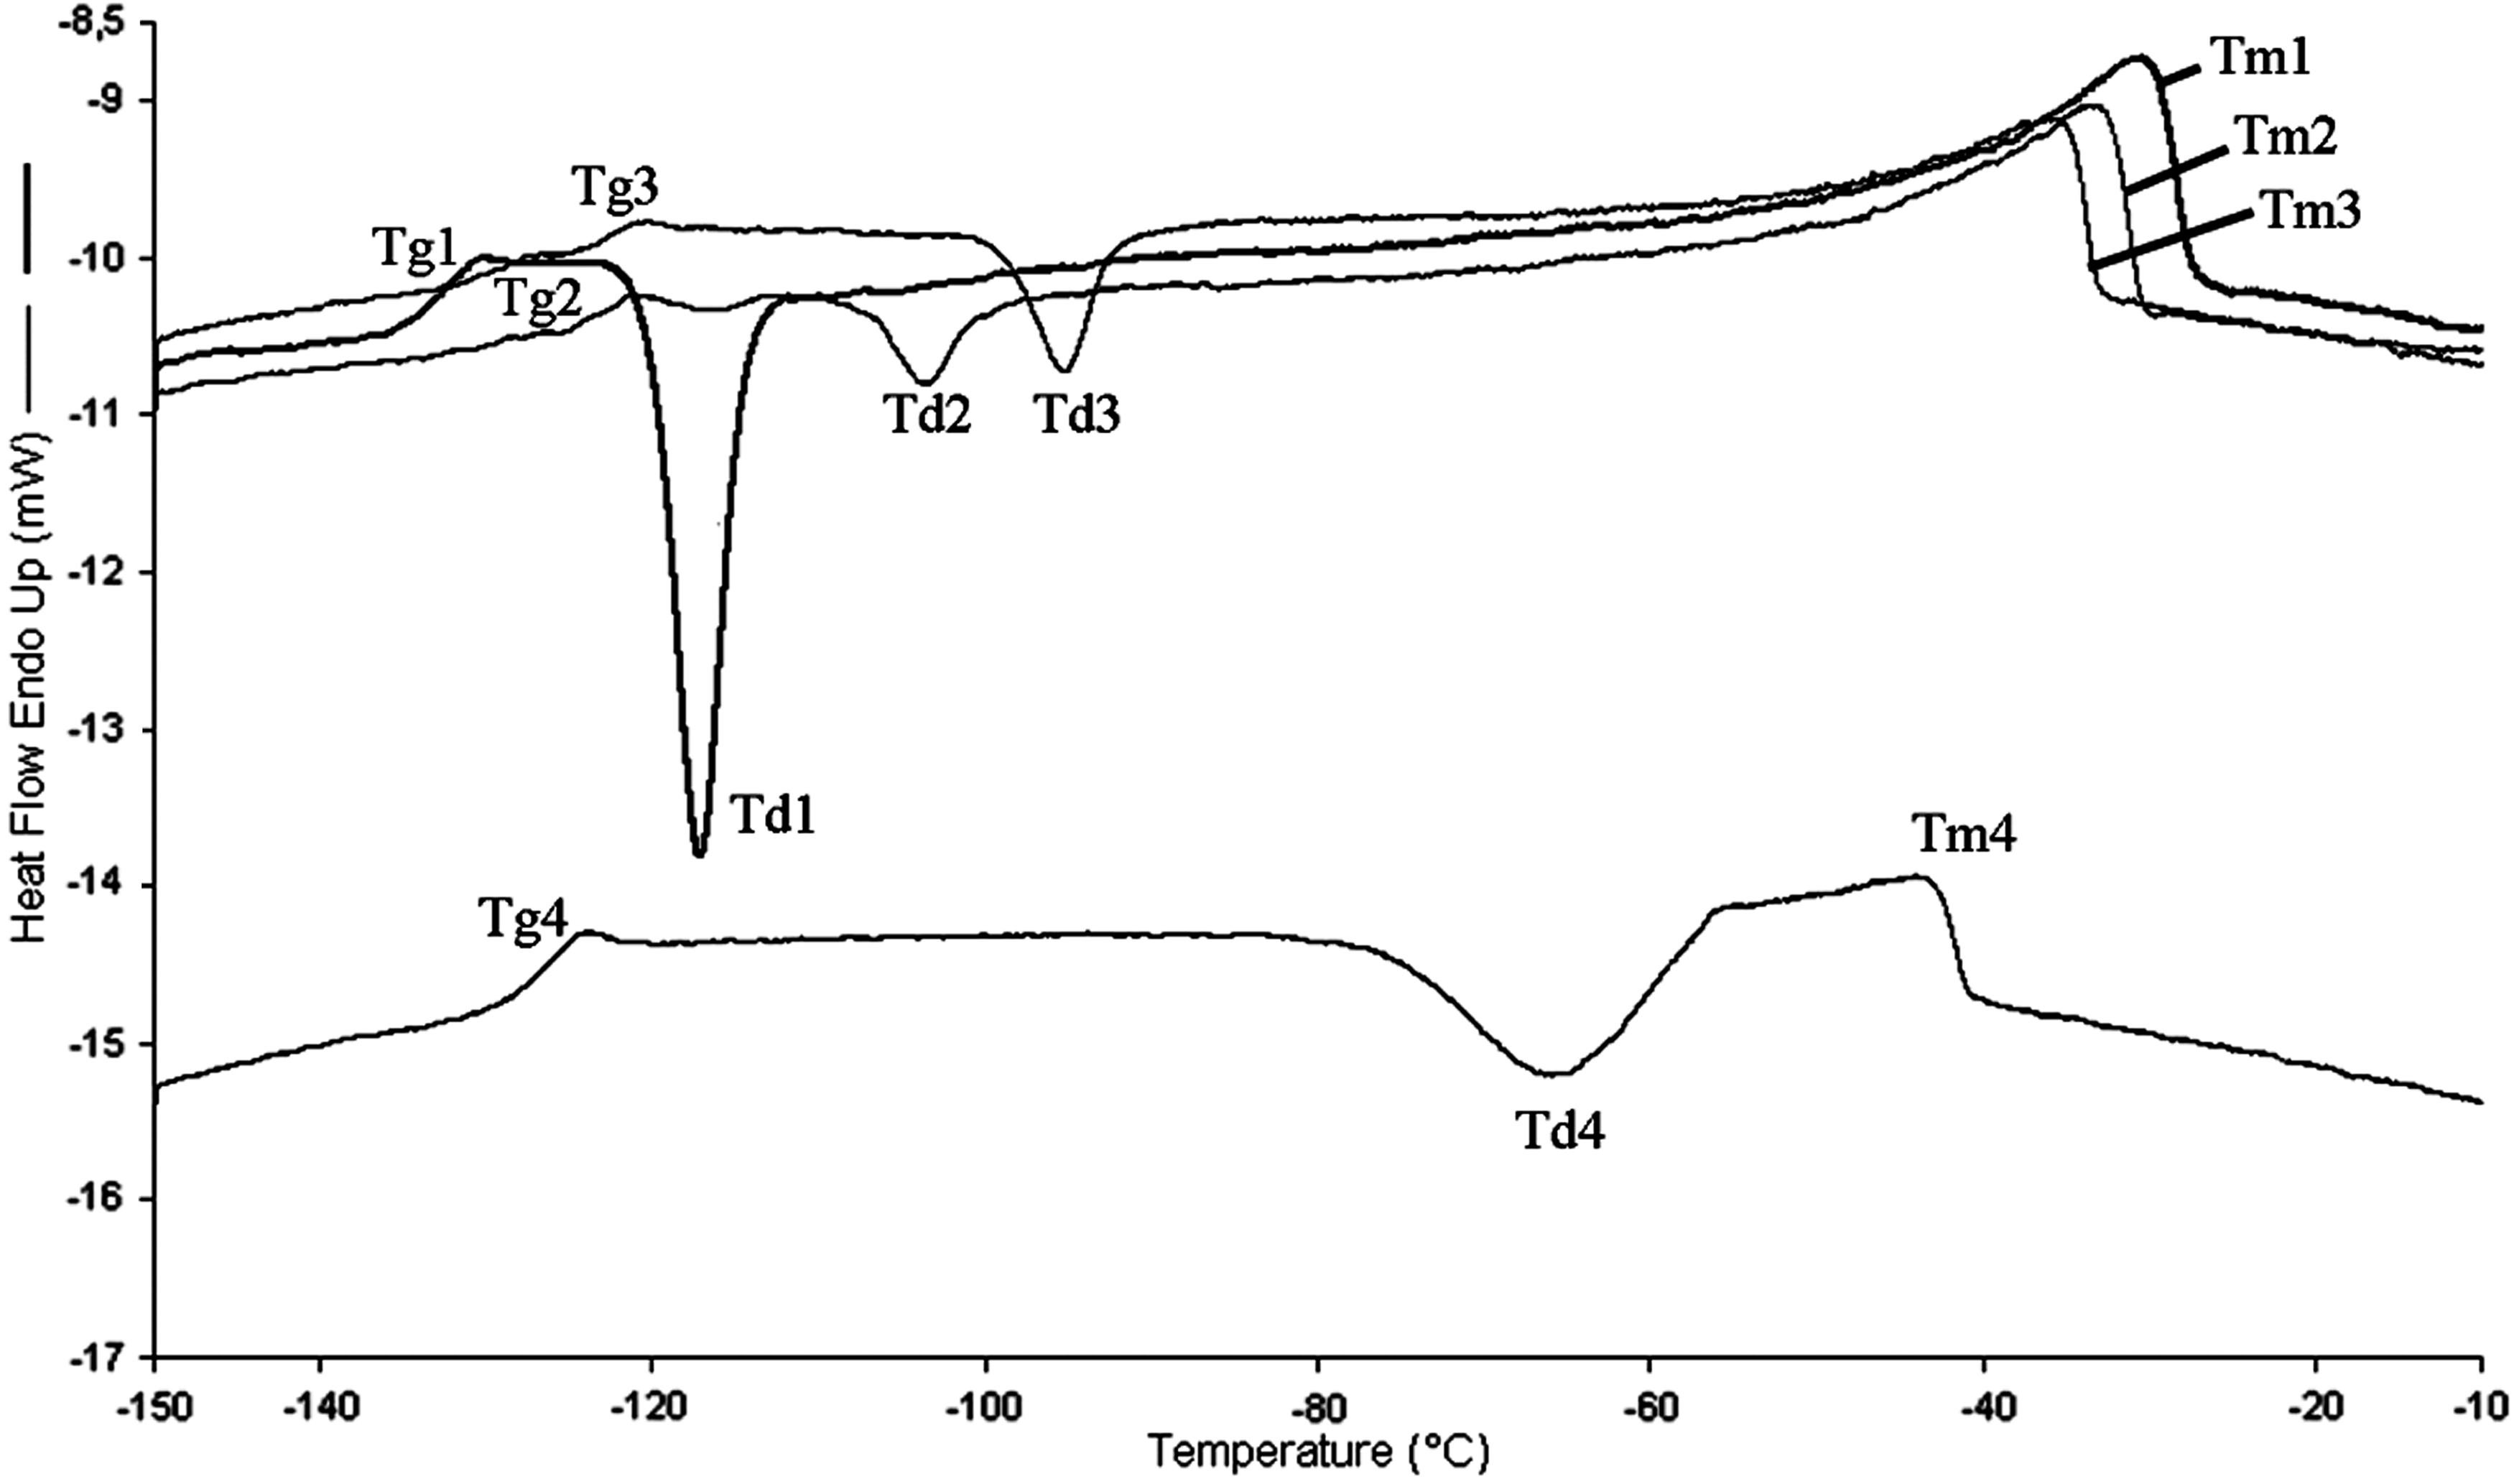
Warming thermograms of the group A series of samples (35% EG) at low warming rate (2.5°C/min, after quenching at a cooling rate of 130°C/min). The thermal properties indicating points (Tg, Td, and Tm) are shown for 40% EG, A1, A2, and A3 as 1, 2, 3, and 4, respectively.
As the function of the warming rate, the mean values of Tm–Td is the measure of stability of the amorphous state (a low value indicating a higher stability), and they showed a common variation for all tested concentrations (Fig. 3a). The A3 solution exhibited a better amorphous stable state upon rewarming in group A. Alternatively, the stability of the amorphous state can be adequately defined using the critical warming rate (Vcwr), and the devitrification time should be near zero in the time scale of the warming amorphous solution (a small Vcwr implying larger stability of the amorphous state).

Observed changes in Tm–Td versus warming rate as a function of warming rate (upon rewarming from −150°C to 10°C)
33
for solution samples in groups A
In group B, the control solution (20% PD) froze in all cooling rates studied. In the B1 solution (60% water), no ice formation was observed when the cooling rate was ≥5°C/min. Ice formation was suppressed in B3 (53% water) and B4 (50% water) solutions at all cooling rates studied (Fig. 1b). The rewarming thermograms of group B are shown in Figure 4, and its mean of the Tm–Td values is plotted in Figure 3b. The B1 solution (20% PD +20% EG) was more stable against recrystallization in rewarming than 40% EG, and displayed the enhanced effect of replacing 20% EG with 20% PD. However, both samples were less stable than B3 and B4 solutions upon warming. DSC runs were performed for all samples in groups A and B. The calculated rates of critical cooling, warming, and related parameters are listed in Table 1. It is shown that the maximum amount of heat of ice crystallization (qmax) tended to decrease if the EG concentration increased from 35% to 40%. Group A showed a significant decrease in qmax values with increasing PD content, reaching a zero value with A3 (50% water). The same effect was observed in B3 and B4 solutions in the group B, where qmax reached zero.

Warming thermograms at lower scanning rate (2.5°C/min, following quenching) of solutions in group B. Thermal properties (Tg, Td, and Tm) of 40% EG, B1, B2, B3,and B4 solutions are represented as 1, 2, 3, 4, and 5, respectively.
To investigate these results in further detail, the quantity of ice formed during cooling was measured at two different cooling rates (2.5 and 10°C/min). This experiment showed a big effect from changing the cooling rate (Fig. 1c). For instance, ice formation in 40% EG and B1 solutions did not differ largely from cooling rate at 2.5°C/min, whereas there was a clear difference found at cooling rate of 10°C/min.
In addition, the A1 solution showed a surprisingly strong decrease in ice formation at 2.5°C/min scanning rates as compared with 40% EG and B1, whereas ice formation disappeared completely for A1 solutions at scanning rates over 10°C/min. This confirmed the unique behavior of A1 compared with other solutions with samples that have higher PD concentration such as B1.
Increasing the warming rate will decrease the value of Tm–Td and indicates that ice formation on warming at any given rate is reduced under the small value of Td and Tm. The stability of the amorphous state varies with CPA type and quantity as follows (from high stability to low stability): B4 > A3 > B3 > B2 > A2 > B1 > 7% PD +35% EG > A1 > 40% EG. The stability of a solution was increased by replacing the same quantity of EG with PD in the warming step as we see in A3 and B4 with 50% water.
Additional evaluation by visual observations of the extent of ice nucleation in the tested solutions is included (Figs. 5 and 6). The different timings of the snapshots show the role of CPA concentration, type, and distinct nucleation types, as well as the positions of the onset of ice fractures in the sample. Immediately after cooling to near Tg, the A3 and B4 solutions partially inhibited the ice nucleation at the vial sides or in the center of the solution. During warming, all studied solutions showed the appearance of ice crystals growing on the sides, although some of them had clearly less ice and melted faster (Fig. 5). The effect of adding 5% (A1), 7%, 10% (A2), and 15% (A3) PD to the 35% EG solution is presented in the devitrification during warming process (Fig. 6). The addition of 5%, 7%, and 10% PD showed less ice inhibition effect compared with 15% PD. While the effect of adding 20%, 24%, 27%, and 30% EG to 20% PD solutions inhibited the devitrification only with 30% EG solution (50% water).

Visual observation of group A and B series of samples after 16 min exposure to liquid nitrogen vapor (2–3 cm from liquid surface), followed by rewarming for 4 min. The presence of ice is characterized by a change in transparency of the solutions.
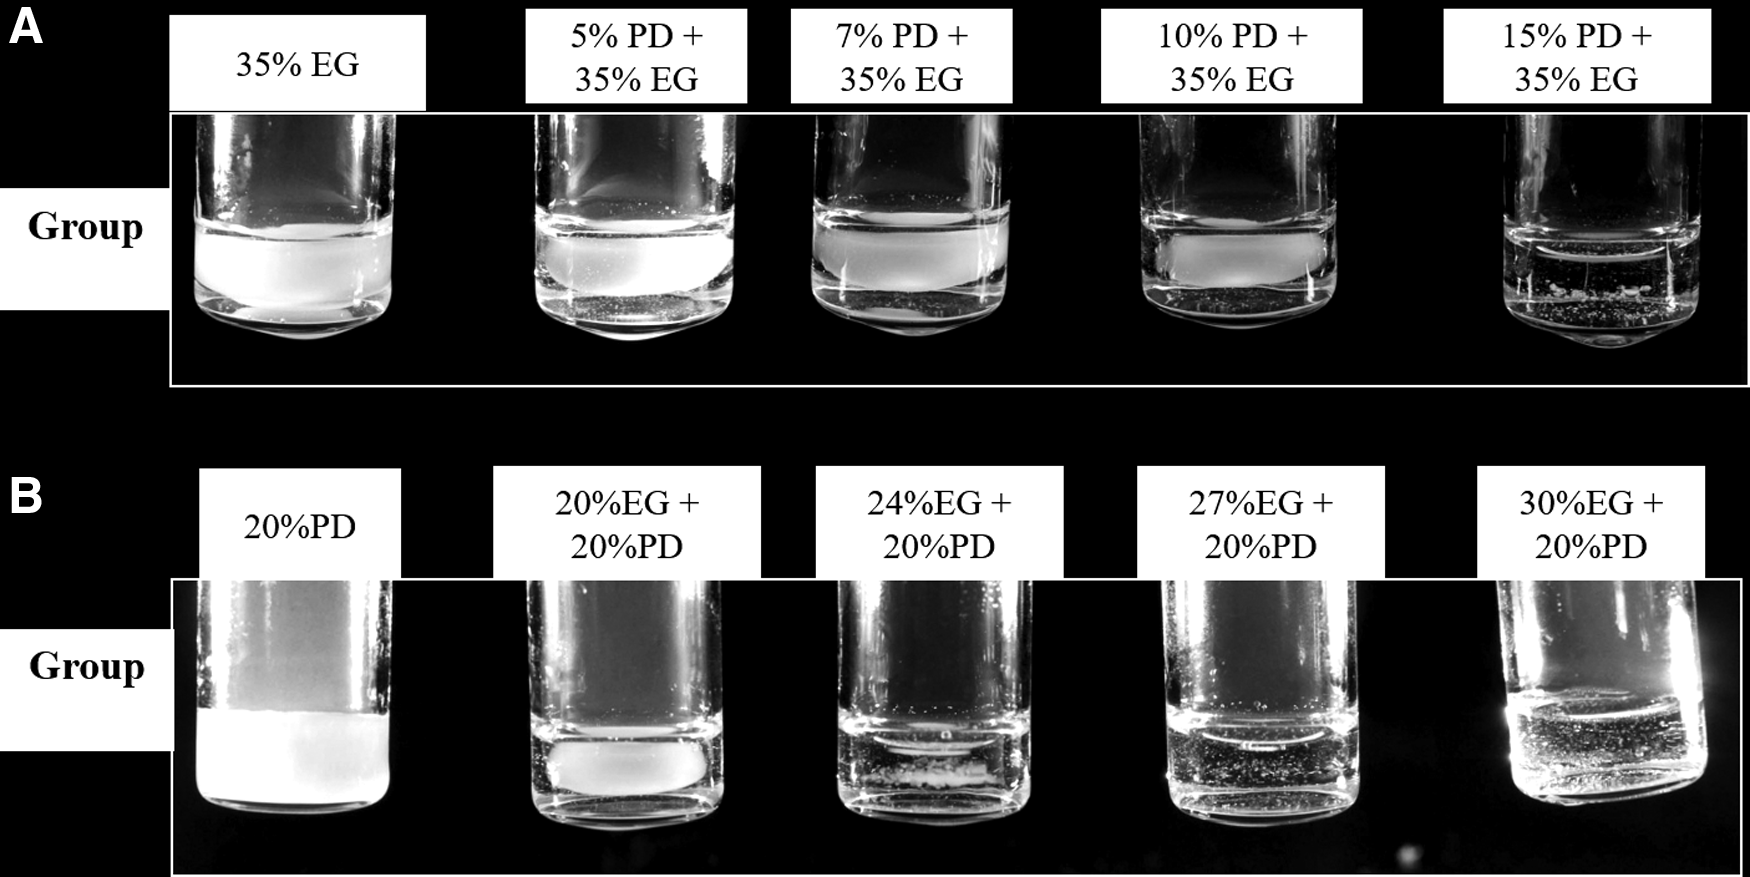
Visual observation of group A and B series of solutions after 15–20 s exposure to liquid nitrogen vapor (suspended 2–3 cm from the liquid surface), followed by quenching in liquid nitrogen for 1 min and warming for 6 min. Ice formation was delayed because of the effect of CPA concentration on the glass transition in the amorphous state. CPA, cryoprotectant.
Ice formation occurs much more readily on warming indicating that the critical warming rate of a given solution is more significant than critical cooling rate. 26 The visual evidence showed that adding 3% PD to the VM3 solution was insufficient to prevent ice formation during cooling in LN vapor, but there was less recrystallization density during warming process (Fig. 7). On the other side, DSC data showed a reduced Tg value after addition of 3% PD (Fig. 8). In the thermal analysis data, we did not observe any peak of crystallization temperature in both solutions, but there was an increase in glass-transition temperature (Tg). The Tg temperature in VM3 + 3% PD solution was very close to the Tg temperature of the B4 solution (20% PD +30% EG).

Visual observation of VM3 (65.11%) (A1) and 3%PD + A1 (A2) after cooling in liquid nitrogen vapor for 10 min, then directly warming at room temperature (after dipping in Ethanol) for 5 min.
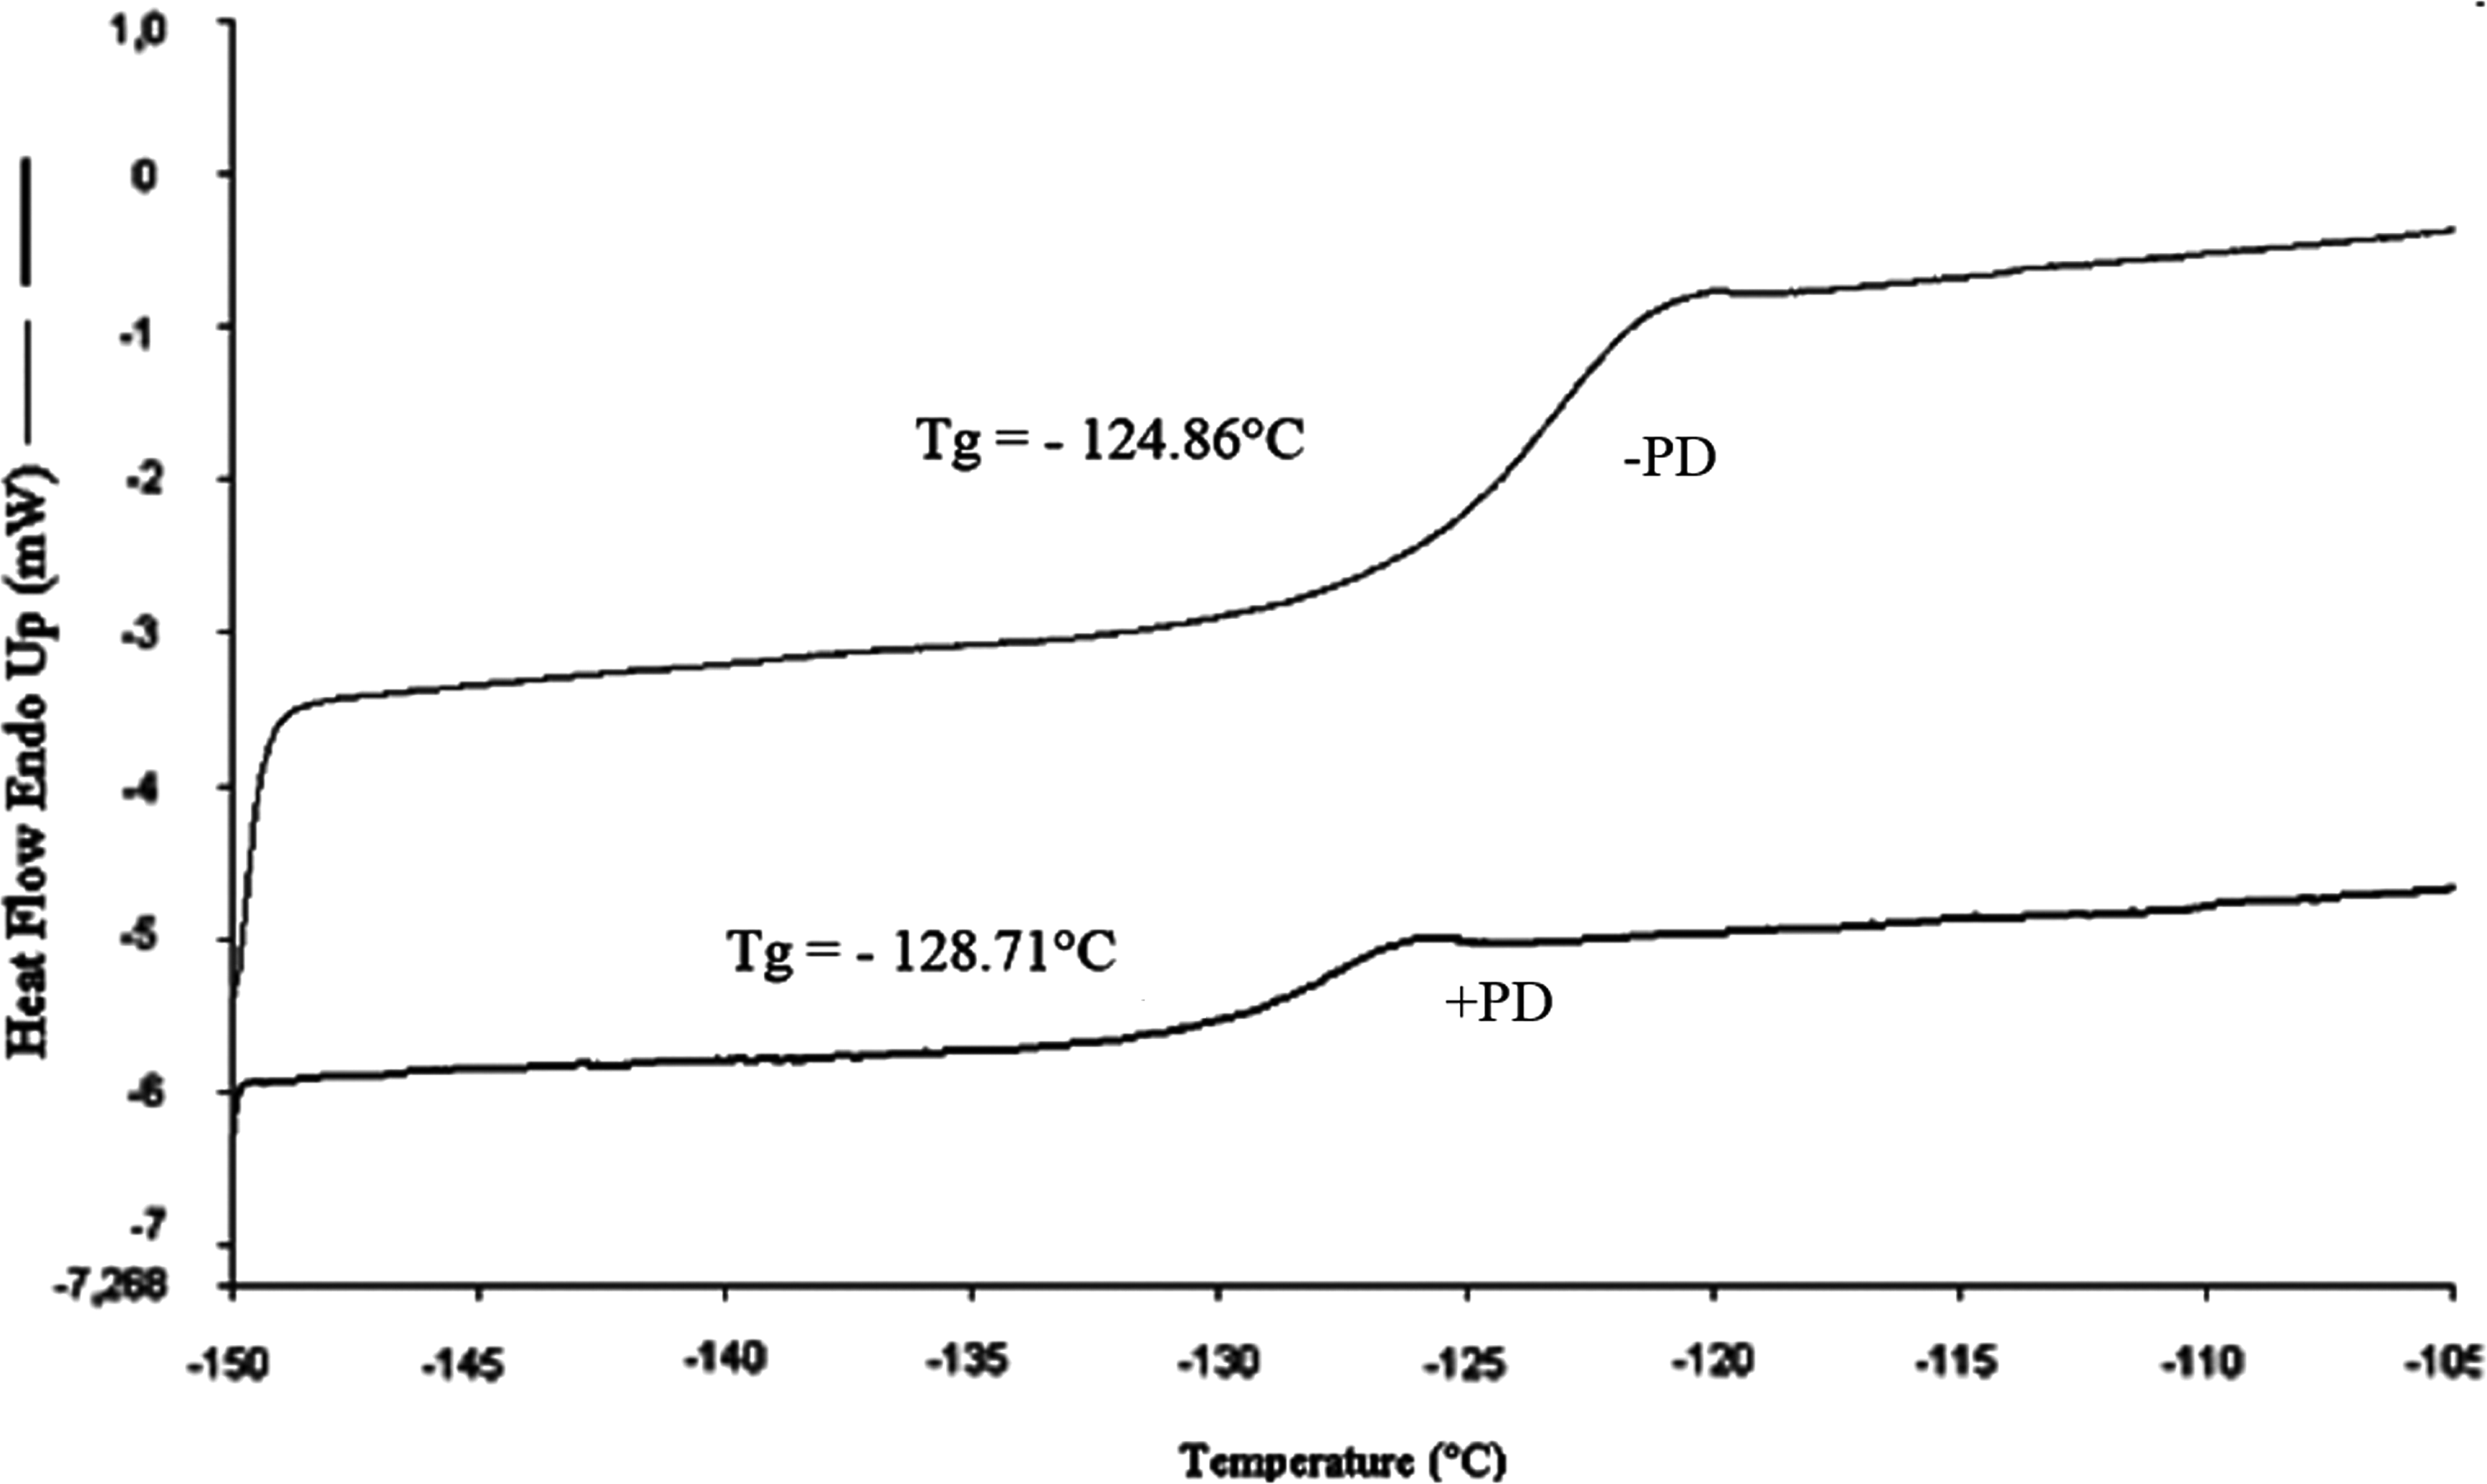
Cooling thermograms of VM3 vitrification solution with 3% PD (PD+) or without (PD−) showing Tg changes during analysis by DSC (using the cooling to −150°C and warming to +10°C at a rate of 8°C/min). The results showed that adding 3% PD to VM3 has increased the Tg from −128.71°C ± 0.63°C (n = 2) to −124.86°C ± 0.95°C (n = 3). DSC, differential scanning calorimetry.
Results obtained from different concentrations of CPAs compared with the single agent in the same concentration highlighted the critical rates needed to avoid ice formation or glass fractures in future research. Forty percent EG was compared with other mixed CPA solutions and demonstrates the effects of each solution. As shown in Table 2, results from the current study were compared with previous literature using the same concentration of CPA to clarify laboratory differences between researchers. The small difference between the observed effect in 40% EG solution in Table 1 and its results from the literature references in Table 2 might have occurred due to the difference in experimental conditions. The difference in Vccr and Vcwr values of the 40% EG solutions presented in both tables may be due to the different detection method deployed or changes in experimental conditions. In this study, both group solutions were prepared from ion-free water, so that ultrapure water was employed (18.02 MW), whereas previous studies employed deionized water (20.14 MW).4,33 A second difference was the type of sample pan used for DSC. In this study, we used PerkinElmer aluminium pans BO14-3017, whereas others have used the PerkinElmer sample pan 0219-0062.
From references 8 and 18.
From references 15 and 18.
From reference 33.
From reference 4.
Discussion
DSC analysis with a multistep temperature treatment protocol was used to achieve measurable ice content, and to isolate effects of nucleation vs. growth in concentrated vitrification solutions. 1 The penetrating agents EG and PD form strong and numerous hydrogen bonds and enhance colligative properties at higher concentrations. During the CPA loading and dehydration of insect embryos, we noticed the importance of the type and concentration of each cryoprotective agent, which reflects their roles during protocols. The present thermal analysis supplied the data to understand the effects of their thermodynamic conditions in the vitrification step and their cooling/warming rates. The total amount of heat formed during ice crystallization (qmax) tends to decrease when PD concentration increased (Table 1). The critical warming rates for all cryoprotectant mixtures examined in Table 1 are higher than the critical cooling rates for the same concentration, which is in accordance with Hopkin's results. 26
In some cases, the chemical and thermal properties showed a limited dependence on CPA concentration. In red blood cells, up to a concentration of 30% EG and 20% PD, the vitrification solution has a similar degree of hemolysis and similar survival curves after freeze thawing. 11 The additional methyl group in PD compared with EG assists in reducing the critical cooling and warming rates during cooling and rewarming processes, respectively. 33 Therefore, the significant structural differences between PD and EG molecules are seen in a methyl function of PD attached to the carbon atom that also carries a hydroxyl group. This shifts the electron density from the methyl group to the hydroxyl oxygen, making the oxygen a stronger base. 30 The critical rates are used to compare the effect of molecular structure and ability of CPAs to prevent ice crystallization, and indicates that carbon chain length can be seen as a molecular key feature for mixing PD (long chain, flexible molecule) with EG (short chain, strong interaction with water).
PD has a stronger glass-forming tendency than EG, and for this reason the aqueous solutions of 40%–55% PD will vitrify. 10 At low scanning rates (2.5°C/min), it was not surprising that the thermal characteristics of B1 mixture (Tg = −129°C, Tm–27°C, Td = −101°C) resulted in stronger glass-forming properties with a higher resistance of devitrification during warming, than 40% EG (Tg = −133°C, Tm–31°C, Td = −117°C). Thermodynamic analysis during warming curves showed a regular movement that shapes with endothermic peaks (Tg, Td, Tm). At lower heating rates (2.5°C/min), a heat capacity overshoot (refers to how quickly a substance will heat up or cool down), is observed at the end of the glass transition temperature for A3 only. A similar phenomenon was observed at concentrations of 43% EG or higher. 4
The visual observations confirmed that ice formation is affected by concentration and type of each cryoprotectant, which in turn determines influence of cooling and warming rates. In addition, it also showed how the PD slows down water molecule dynamics during the warming more than during the cooling (Figs. 5 and 6). The inhibition of ice formation in both groups was observed at maximum concentrations of CPAs in A3 and B4 solutions that showed a high stability of the amorphous state at a critical warming rate at which no devitrification occurs, as well as inhibition of crystal formation on cooling. These results are in agreement with those obtained by Wowk and Fahy, 37 and show that vitrification solutions with high concentrations of solutes exhibit substantially separate ice nuclei and ice growth temperature zones near the glass transition temperature and melting temperature, respectively.
Considering the kinetics of heterogeneous and homogenous nucleation of ice in aqueous systems, there is a linear relationship between freezing point depression and reduction of nucleation temperatures and the addition of CPAs. 22 These results imply that in practice it is suppression of heterogeneous nucleation, rather than homogenous nucleation, which determines the minimum concentration needed for vitrification. 34 The decreased value of the critical warming rate suggests that the effectiveness of preventing devitrification by increasing the CPA concentration may be the result of nucleation inhibition rather than ice growth inhibition. Significant intracellular ice nucleation and growth are usually lethal to cells and may occur during cooling and warming, possibly as a result of the presence of small ice fractions in the nominally vitrified samples. 26 Critical warming rates are strongly dependent on cooling rates, and thus can be decreased by adding smaller CPA concentrations to the vitrification sample, such as PD. This will suppress ice nucleation and reduce growth rates, and consequently reduce cooling rates required to reduce also the warming rates.
DSC measurements on cooling showed that the quantity of formed ice depends on the CPA concentration, as did the previous biological toxicity of CPA, where the EG displays a lower toxicity than PD. In addition to the results obtained on the critical cooling and warming rates (Table 1), we conclude that the group of series of solution A is more prone to meet the vitrification requirements than solution B. This means that based on the thermal properties, EG as the main compound in the vitrification solution is better than PD, and moreover EG is known to show a lower toxicity. 38 The results also recommend adding smaller concentrations of PD to EG that will improve the thermal characteristics of vitrification as can be done with VM3. The smaller concentration of PD will be decided in toxicity tests with biological samples. The exothermic and endothermic results in this study provide a more quantitative basis for logical selection of vitrification CPAs for cryopreservation.
Footnotes
Acknowledgments
This work was funded by the Italian Ministry of Agricultural and Forestry Policy (MIPAAF), National Research Project (DM 256/7303/2007) “PINITALY–The resort of Pine Nut production in Italy by new pest control strategies.” The authors thank Dr. Brian Wowk (21st Century Medicine, Inc., California) for his important technical advice and provision for calculating critical cooling and warming rates. A special thanks to Dr. David Eisenberg (TDA Research, Inc.) for his valuable comments and revision. Fabrizio Pennacchio (CRA-ABP, Florence, Italy) is also gratefully acknowledged for his help in photo acquisition of the solutions.
Author Disclosure Statement
No conflicting financial interests exist.