
Abstract
One of the main problems in the cryopreservation of biological samples is the formation of ice and the consequent mechanical damage to cells and tissues, due to the crystalline structure of ice and its associated mechanical damage. It is necessary to detect this deleterious formation of ice, especially in tissues and organs, because of their large volume and the complexity of their vascular system in the case of bulky organs. In this work, we propose the use of X-ray Computed Tomography (CT) to detect this ice formation inside tissues and organs. To achieve this aim, rabbit kidneys were loaded with cryoprotectant solutions containing Me2SO at low temperatures (below −140°C). Drops of water with a volume between 2 and 8 μL were then introduced inside the organs. Finally, the rabbit kidneys were cooled to −196°C. Volumes of ice of up to 1 μL were detected in our CT device, with a resolution of up to 50 μm, validating the proposed technology. On the contrary, we analyzed bovine ovarian tissues cryopreserved with a controlled-rate slow-cooling protocol. CT images showed the different structure on the extracellular ice formation according to the procedure, and even the intracellular ice that can be formed in the tissues. These positive results have a straightforward application in the control of the formation of ice, of significant importance for the creation of biobanks.
Introduction
Intracellular ice formation (IIF) is known to be one of the main causes of damage to cells during the cryopreservation procedures. The mechanisms of IIF and its consequential cell injuries, mainly due to the mechanical effects of the crystalline structure, have been thoroughly studied.1–3 On the contrary, the propagation of ice between cells and the ice growth through membrane pores have also been investigated.4,5 In 2010, Pegg 6 compared the consequences of ice formation on tissues: smooth muscle, articular cartilage, and organs (kidneys) and reported that there is a direct relationship between the formation of ice, extra- or intracellular, and structural and functional damage in tissue and organs. Furthermore, ice tends to form preferably in intravascular spaces, so it can result in the rupture of blood vessels in vascularized tissues and organs. 7
Some mathematical models have been developed to predict IIF in isolated cells3,8–10 and even to study the ice growth into macroscopic crystals.11,12 In the case of tissues and organs, developing mathematical models is much more complex since freezing damage is due to more variables, where mass and heat transport limitations are involved because of the macroscopic dimensions.
Different experimental techniques have been used to measure IIF. Differential scanning calorimetry has been commonly used to detect the temperature when the IIF occurs in cells, such as in human lymphocytes,13,14 human fibroblasts, 15 Drosophila melanogaster embryos, 16 or frog oocytes. 17 Another method based on impedance differences has also been used to determine the temperature of IIF. 18 However, these techniques do not provide information about the location and distribution of ice in more complex samples, and therefore, the evaluation of the damage associated to ice formation is not be possible.
Cryomicroscopy is used as a visualization method for ice formation. The main advantage of cryomicroscopy is that it provides continuous visual information at controlled cooling rates from a very wide range of temperatures. It has been used to study ice formation in various types of cells: oocytes,10,19 granulocytes, 20 or endothelial cells, 21 among others. However, this method has its limitations in tissues and organs, since samples are required to be thin and translucent enough to be observed under the microscope. 22
In the case of tissues and organs, some techniques have been used to assess the formation of ice crystals by indirect observation: the ice in samples is previously dissolved while tissues are fixated for microscopy evaluation. Ice formation and its distribution within tissues can be evaluated by observing the spaces occupied by ice in the samples. Some examples of tissues or organs assessed with these techniques are smooth muscle, 23 cartilage, 24 or kidneys.25,26 The methods most commonly used are freeze-substitution and isothermal freeze-fixation.22,27
Even though both techniques provide information about the amount of ice and its distribution inside the tissues, they present some disadvantages: these techniques are invasive for tissues, they may be difficult to perform, and there is some risk of additional freezing and loss pattern during the fixation steps, which would provide misrepresentation of the frozen structure. Therefore, there is still the need to develop new technologies to detect ice formation in the case of bulky biological samples.
In 2006, Bischof et al. applied X-ray tomography to map crystalline and amorphous phases in frozen biomaterials. 28 They studied glycerol solutions at three different temperatures: −196°C, −78.5°C, and 20°C. The high X-ray voltage used, 420 kV, makes the attenuation dependent mainly on the material density for his study. This way, the attenuation curves at −196°C and −78.5°C showed a change of the slope when a phase change occurred at a determined concentration.
In this work, we propose the use of X-ray Computed Tomography (CT) as a method of ice detection in cryopreserved tissues and organs. The difference with the work of Bischof et al. is based on the use of a NanoCT device, which allows the performance of image acquisitions at low X-ray voltage, 75 kV, making the attenuation mainly dependent on the atomic number of the samples. In our approach, 29 we used Me2SO as the cryoprotective agent (CPA), since the sulfur atom of this molecule favor that the X-ray attenuation is proportional to the CPA concentration. Thanks to this fact, through the difference on the attenuation between water, and therefore ice, and the CPA, we will be able to detect the ice that has been formed within the samples and its location, with a spatial resolution up to 50 μm.
To this end, preliminary images of different volumes of water (liquid and solid) in Me2SO solutions were taken, to determine the ability of water/ice differentiation from solutions. Furthermore, CT measurements were performed in vitrified rabbit kidneys to assess the capacity of the CT technology to detect ice crystals inside tissues, in volumes of up to 2 μL, which would imply an excellent tool to develop accurate procedures of tissue and organ cryopreservation.
Methods
The experiments performed consisted of the CT image acquisition of different systems of samples. Each vial was placed along the bed of the NanoCT device and CT imaged. For samples with interest of being imaged at the vitreous state, we used a cooling system, which allows the temperature to be maintained below −140°C, as described later in this section. For the CT image acquisition, we first chose the acquisition parameters, performed a topogram, and then selected the preferred area for imaging. After the acquisition, the image was reconstructed with the required spatial resolution, depending on the sample, and analyzed.
Solutions
The aqueous solutions used in the experiments were prepared with deionized water. The CPA solutions were prepared in phosphate-buffered saline (PBS) according to the following composition: NaCl 8 g/L, KCl 0.2 g/L, Na2HPO4 1.44 g/L, and KH2PO4 0.24 g/L and adjusted to pH = 7.4. Me2SO was used as the only CPA in different concentrations up to 55% v/v. The reagents were purchased either from Sigma-Aldrich or Panreac (Spain).
Biological samples
Rabbit kidneys and bovine ovarian tissues used in experiments were all obtained from a local slaughterhouse. The kidneys and ovarian tissues were prepared for the experiments immediately after the sacrifice of the animal. The average size of the kidneys was ∼35 mm of length, 25 mm of width, and 20 mm of height. The preparation of the bovine ovarian tissues consisted, first, of sectioning them in half, removing the medulla, and then cutting the slices of cortical tissues in dimensions of 5 × 5 × 1–2 mm3.
CT imaging
The CT device used is a NanoCT, model NanoSPECT/CT® (Bioscan, USA; currently Mediso, Hungary). It is located at the Centro Nacional de Aceleradores (CNA, Spain). This CT device uses low X-rays acceleration voltage, 75 kV, compared with standard medical CTs, which use voltages of about 120 kV. This particular low energy makes this technology capable of differentiating the CPA from water in the case of Me2SO, thanks to the sulfur atom of the molecule. This way, the X-ray attenuation is proportional to the Me2SO concentration, allowing the CPA concentration quantification, as described in our previous work. 29 Another important characteristic of this CT device is the small dimensions, with a CT bed diameter of 60 mm, since it is designed for small animal imaging.
The acquisition parameters were the same for all the experiments: 360 projections per rotation, a voltage of 75 kV, and an exposition time of 1500 ms per projection. These parameters meant that each image required a total time between 9 and 15 minutes for acquisition, subject to the size of the sample. The spatial resolution for the image reconstruction was 200 or 100 μm, depending on the samples being analyzed.
Image processing
Three different software programs were used for each of the three different steps in image processing: Nucline software (Mediso) for acquisition; IVS Image Processing software (Invicro) for reconstruction; and PMOD 3.3 software (PMOD Technologies LLC, Switzerland) for analysis.
Cooling system
For the experiments made at cryogenic temperatures, we developed a system that kept the samples below −140°C during the image acquisition, which was described elsewhere. 29 This system consisted of nitrogen gas precooled with liquid nitrogen which passes through some tubes into an insulating container made of polystyrene where the samples were located. 29 The temperature is measured by a type-K thermocouple and registered by the TC-08 Temperature Data Logger (Pico Technology Limited, United Kingdom).
Groups of CT measurements
We have classified the CT measurements in three different groups, according to the volume of water/ice to detect, and the samples in which they were introduced, as described in the following:
Detection of ice/water in Me2SO solutions
To determine whether ice could be differentiated from the Me2SO solution, a cube of ice of dimensions of 1 × 1.5 × 1.5 cm3 was immersed in a 20 mL polypropylene (PP) vial with a 55% v/v Me2SO solution, at −20°C, and CT imaged right after. Another sample of this group was a 200 μm diameter capillary with water was immersed in a 55% v/v Me2SO solution at 20°C. The aim of this measurement was to prove the capability of detecting small volumes of water in a concentrated Me2SO solution. For that purpose, a 40 mm length of a polycarbonate capillary of 200 μm outer diameter and 16.5 μm thicknesses was filled with deionized water. Both sides of the capillary were heat-sealed immediately afterward. Then the capillary was introduced into a 2 mL PP cryovial with a 55% v/v Me2SO solution and CT imaged at 20°C.
Detection of water in a kidney previously loaded with Me2SO solution
A 200 μm diameter capillary filled with water was inserted in a kidney loaded with a 55% v/v Me2SO solution at 20°C. This way, the detection of small volumes of water inside an organ would be possible. To this end, a kidney was introduced in a 20 mL PP vial with a 55% v/v Me2SO solution and left to equilibrate. A polycarbonate capillary of 200 μm outer diameter, 16.5 μm thicknesses, and 30 mm length was filled with deionized water and heat-sealed at the two ends. The capillary was then introduced in the kidney and placed in the 20 mL vial. The vial was then CT imaged at 20°C.
Detection of ice crystals in kidneys previously loaded with Me2SO solutions
Finally, we wanted to verify if ice crystals could be detected inside cryopreserved organs. Three different rabbit kidneys were equilibrated with a 55% v/v Me2SO solution in several steps in the following intermediate solutions to avoid severe dehydration of the kidneys: 10 hours in 10% v/v Me2SO at 4°C, 15 hours in 25% v/v Me2SO at 4°C, 24 hours in 40% v/v Me2SO at 4°C, and 24 hours in 55% v/v Me2SO at 4°C. The kidneys were then cooled to −20°C in a 50 mL polyethylene vial with 55% v/v Me2SO solution and kept there for 24 hours.
Afterward, a 100 μL Hamilton syringe (BD Microlance) of 2 μL of precision and a 21G 1/2″ needle was used to insert several drops of deionized water into the kidneys. The volumes of drops were between 2 and 8 μL, and they were introduced in a line along the kidney. The kidneys were then introduced into the 50 mL vial with a 55% v/v Me2SO solution and then cooled to −196°C in liquid nitrogen during a 30 minute period. Then, the vial with the kidney was introduced inside the insulating container of the CT cooling system, previously cooled below −140°C, and the image was taken immediately afterward.
Different numbers and volumes of drops of water were introduced in each kidney according to their sizes. Kidney a, with a length of 44 mm, was injected with eight drops which volumes were in the same order as they were introduced: 2, 2, 4, 6, 8, 6, 4, and 2 μL; Kidney b, with a length of 27 mm, was injected with four drops with the following volumes: 4, 2, 2, and 6 μL; and finally, Kidney c, with a length of 36 mm, was injected with six drops with volumes: 6, 4, 2, 4, 6, and 8 μL.
Detection of extra/intracellular ice in ovarian tissues cryopreserved by a controlled-rate slow-cooling protocol
Ovarian tissue cryopreservation was performed by an adaptation of the conventional protocol of Dolmans et al. 30 Each ovarian tissue sample was introduced into a 2 mL cryovial containing 0.8 mL of 10% v/v Me2SO in PBS. Samples were then placed inside a controlled-rate cooling device and cooled to −8°C, the temperature of seeding, at 2°C/min. The seeding was done by touching the wall of the upper part of the cryovial with forceps, previously immersed in liquid nitrogen, until a small ice crystal was observed in the solution. Then the sample was cooled slowly, at 0.3°C/min, down to −40°C. Afterward, the cryovials were cooled quickly in liquid nitrogen vapor to −150°C and finally stored in liquid nitrogen.
This procedure was repeated five times to assess the consistency of the ice patterns detected by our CT. A variation of this freezing protocol was also tested by increasing the seeding temperature up to −5.5°C. Also, five repetitions were performed.
Results
Most of the CT images are shown in a color scale from the PMOD software (cold scale) for a better visualization, which goes from a dark blue for the lowest attenuation to an intense red for the highest attenuation, and therefore the highest Me2SO concentration. Intermediate attenuations, which correspond to intermediate Me2SO concentrations, pass through green, yellow, and orange colors in increasing order. One of the images is shown in grayscale, since it is the conventional practice used for quantification in computing. This scale goes from white for the lowest attenuation to black for the highest values of attenuation, containing many shades of gray in between.
The PMOD software also permits us to obtain the average X-ray attenuation and other statistical data within a certain volume of interest (VOI), where the volume and location are selected by the user. The attenuation is expressed in CT values, which are arbitrary units proportional to the X-ray absorption coefficients of the samples.
Detection of ice/water in Me2SO solutions
Figure 1A shows the CT image of a piece of ice of 1 × 1.5 × 1.5 cm 3 immersed in a 55% v/v Me2SO solution, at −20°C, in a 20 mL vial. The X-ray attenuation goes from 0.0 to 1.3 CT values. The spatial resolution is 200 μm. In the image, the piece of ice is perfectly differentiated from the Me2SO solution, showing a green color versus the red color of the solution.
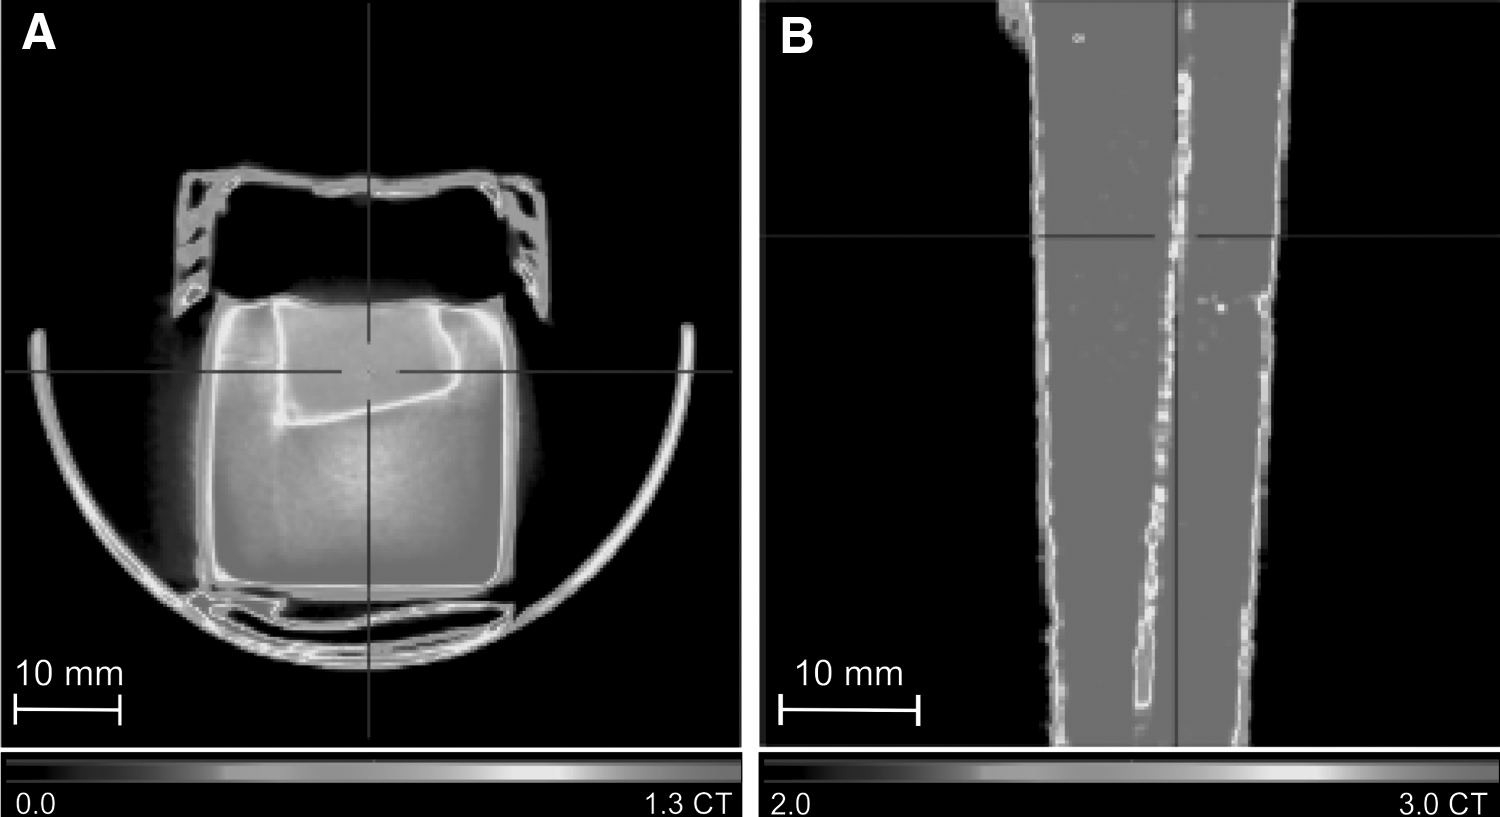
Figure 1B shows the capability of the CT technology to detect small volumes of water inside a concentrated Me2SO solution at 20°C. The CT image shows one of the views of a 40 mm length polycarbonate capillary of 200 μm diameter filled with water immersed in a 55% v/v Me2SO solution in PBS. The attenuation range goes from 2.0 to 3.0 CT values, and the image was reconstructed to a spatial resolution of 100 μm. The capillary can be easily detected with a green-yellow color, which shows a lower attenuation from the red color of the surrounding solution, of higher attenuation.
Detection of water in a kidney previously loaded with Me2SO solution
Figure 2 illustrates the ability to detect small volumes of water inside an organ. A 30 mm length of a closed capillary of 200 diameter filled with water was inserted into a kidney previously equilibrated with 55% v/v Me2SO at 20°C. The left panel shows the picture of the introduction of the capillary into the kidney. The right panel shows the CT image using the cold scale, from 0.7 to 1.5 CT values and a spatial resolution of 50 μm. The capillary is perfectly differentiated in yellow color, showing a lower attenuation than that of the kidney, in a red color, which corresponds to the high Me2SO concentration.
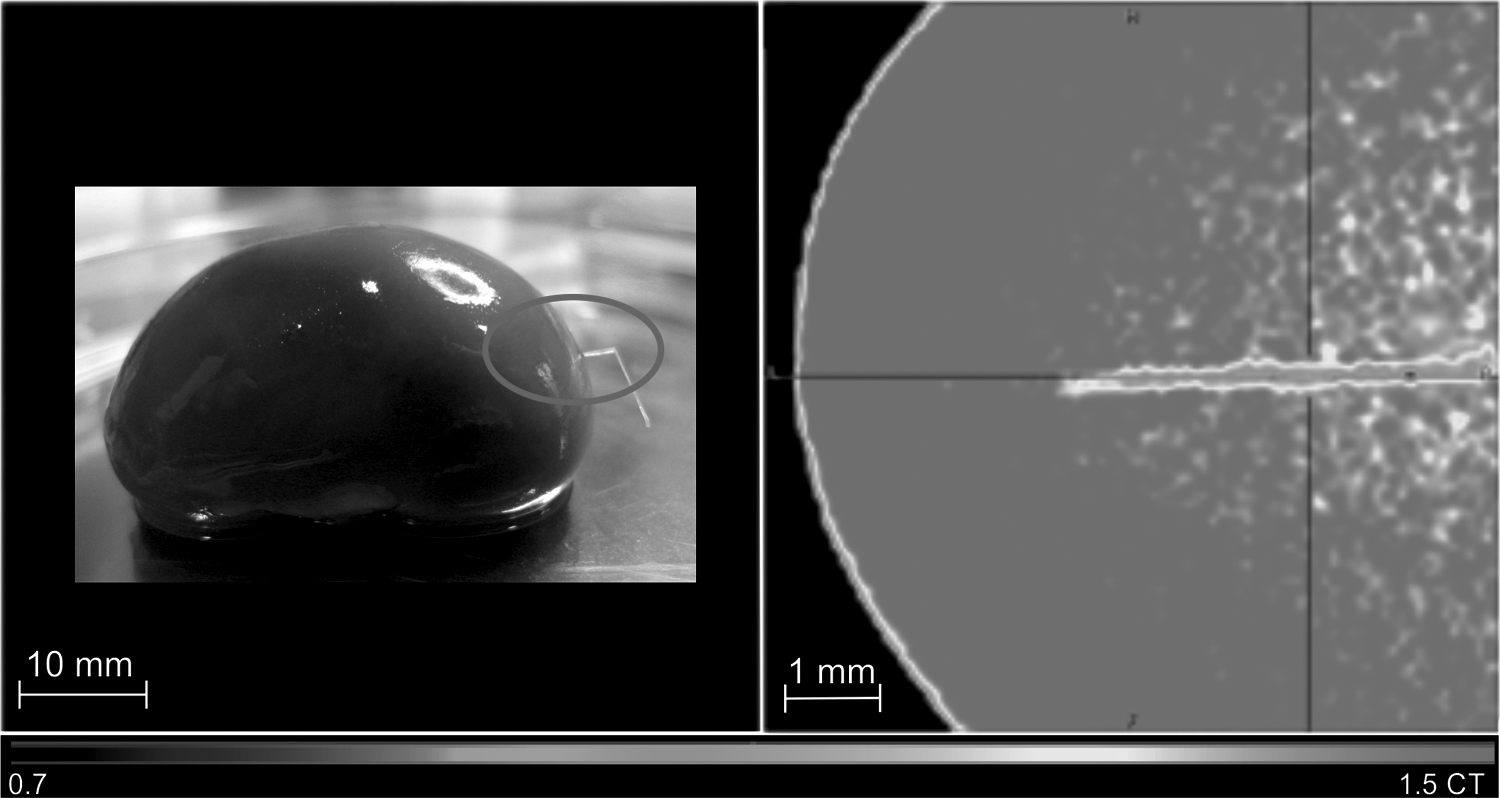
CT image of a closed capillary filled with water inserted inside a rabbit kidney loaded with Me2SO solution. Left panel displays the picture of a rabbit kidney loaded at 55% v/v Me2SO solution with a closed 200 μm diameter capillary of 30 mm length filled with water introduced inside it. In right panel, the CT image of the kidney and the capillary acquired at 20°C. The capillary can be clearly distinguished from the organ. Spatial resolution of 50 μm.
Detection of ice crystals in kidneys previously loaded with Me2SO solutions
With this group of measurements, we have evaluated the capability of this approach to detect ice crystals of volumes up to 1 μL inside vitrified kidneys. Figures 3–5 show the CT images of the three kidneys acquired at −140°C and reconstructed to a spatial resolution of 100 μm. Figure 3 shows the three orthogonal views and the image of the Kidney a loaded to 55% v/v Me2SO in grayscale, in a range from 0.5 to 1.2 CT values. In the top left image, six VOIs are observed in the following colors: blue, green, light blue, purple, pink, and red. This way, we selected the areas with an attenuation corresponding to ice, much lower than the one of the solution. Therefore, the colored VOIs observed show the location of the ice crystals. In the top right image, the light blue VOI is visualized.
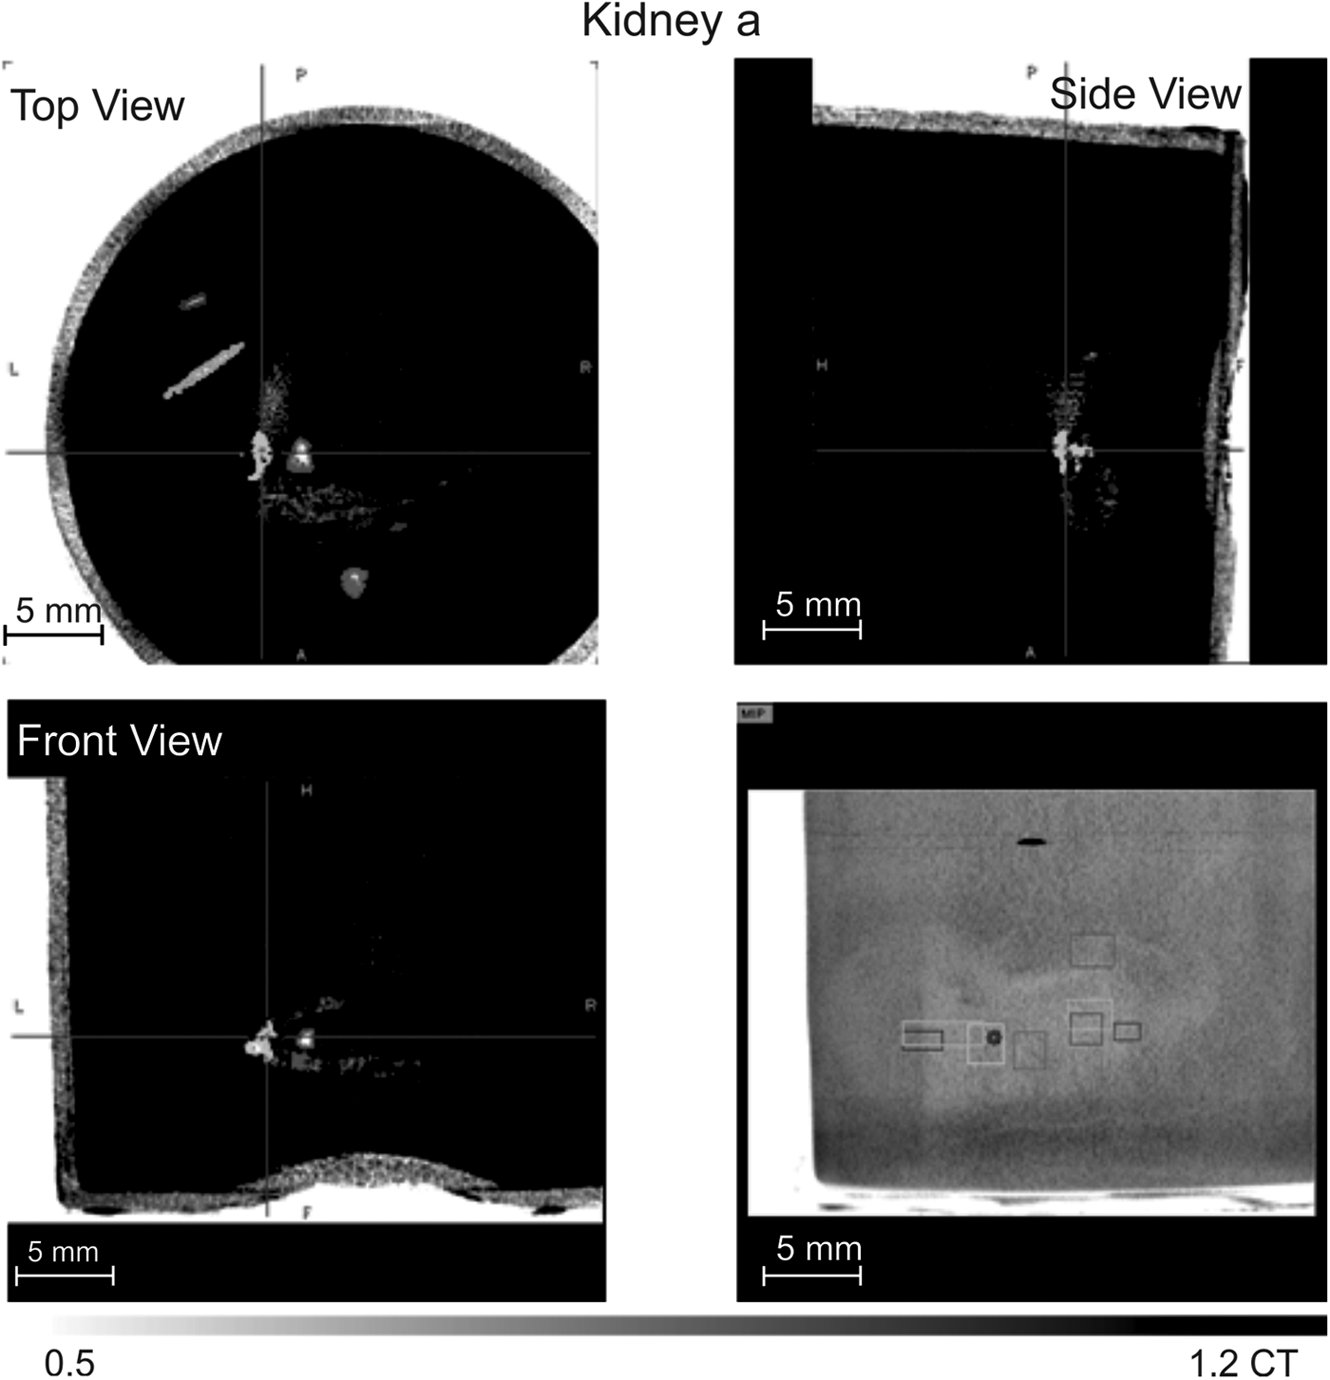
CT image of the three orthogonal views of the Kidney a, loaded to 55% v/v Me2SO, in which eight drops of water have been injected and then cooled to −196°C. Spatial resolution of 100 μm.
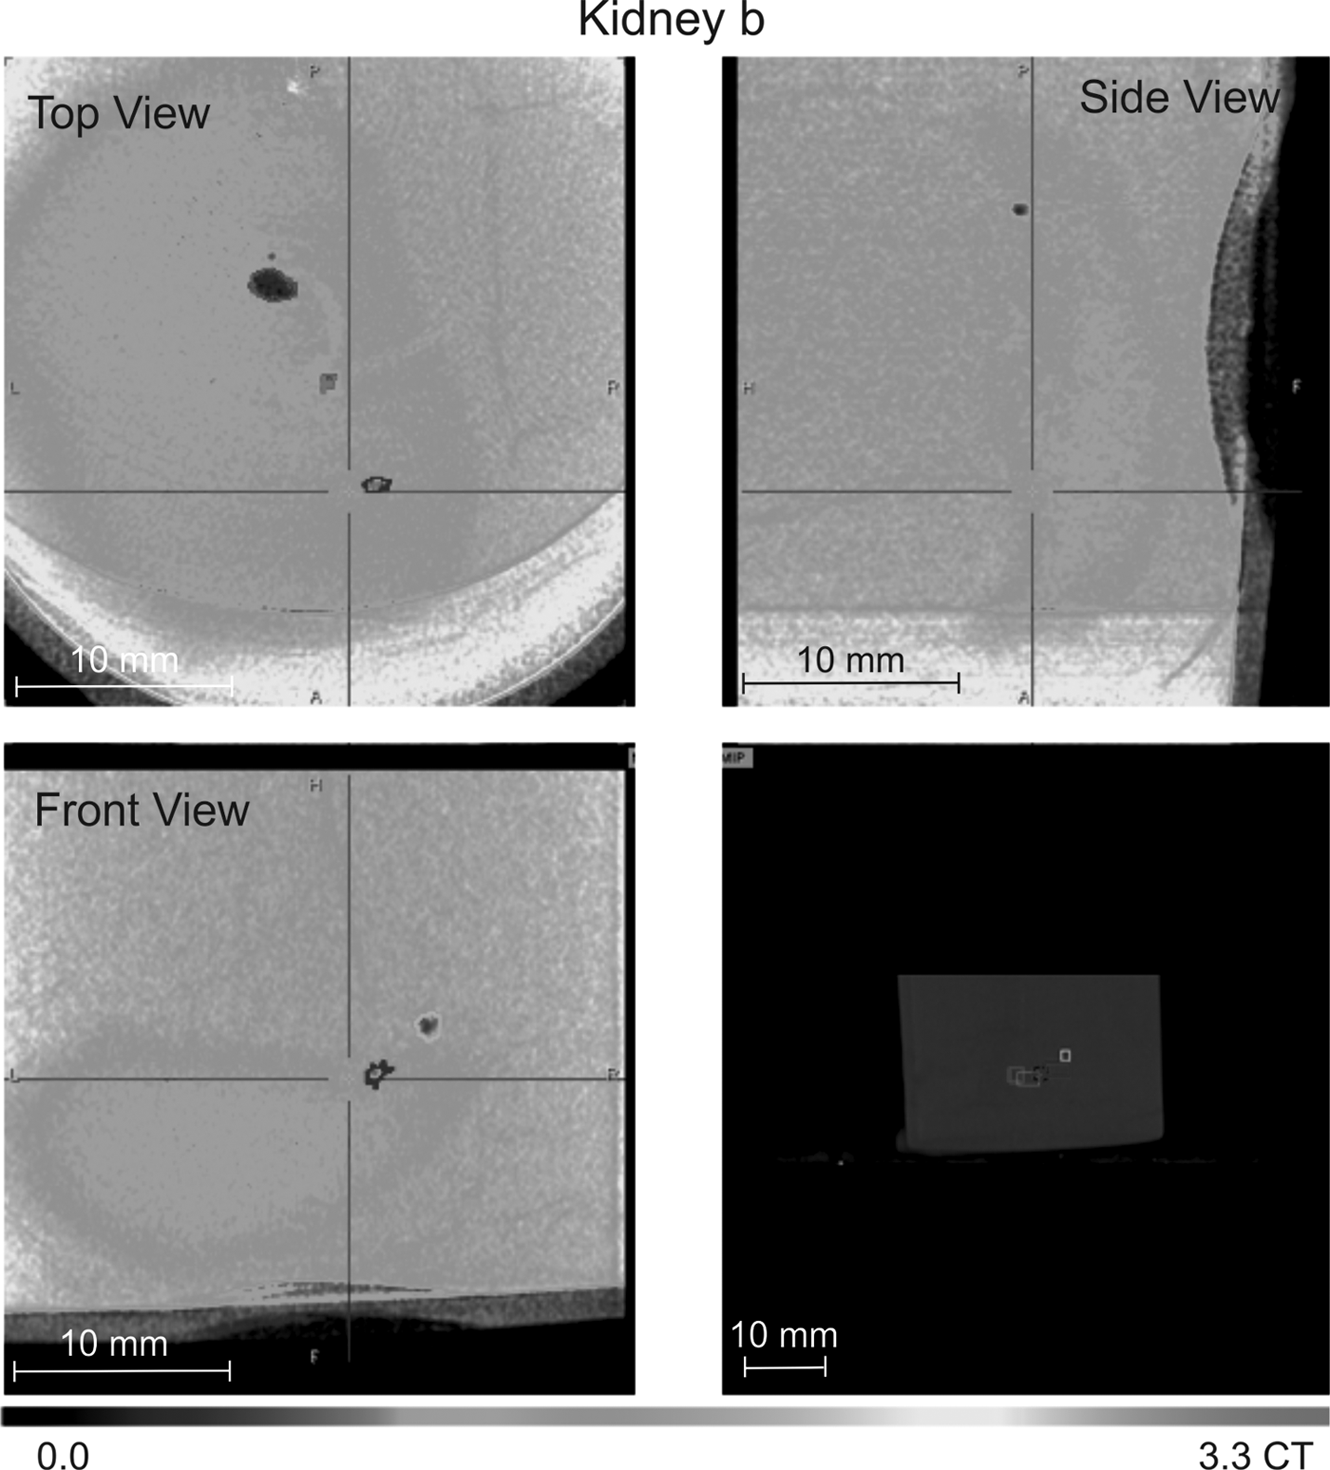
CT image of the three orthogonal views of the Kidney b, loaded to 55% v/v Me2SO, in which four drops of water have been injected and then cooled to −196°C. Spatial resolution of 100 μm.
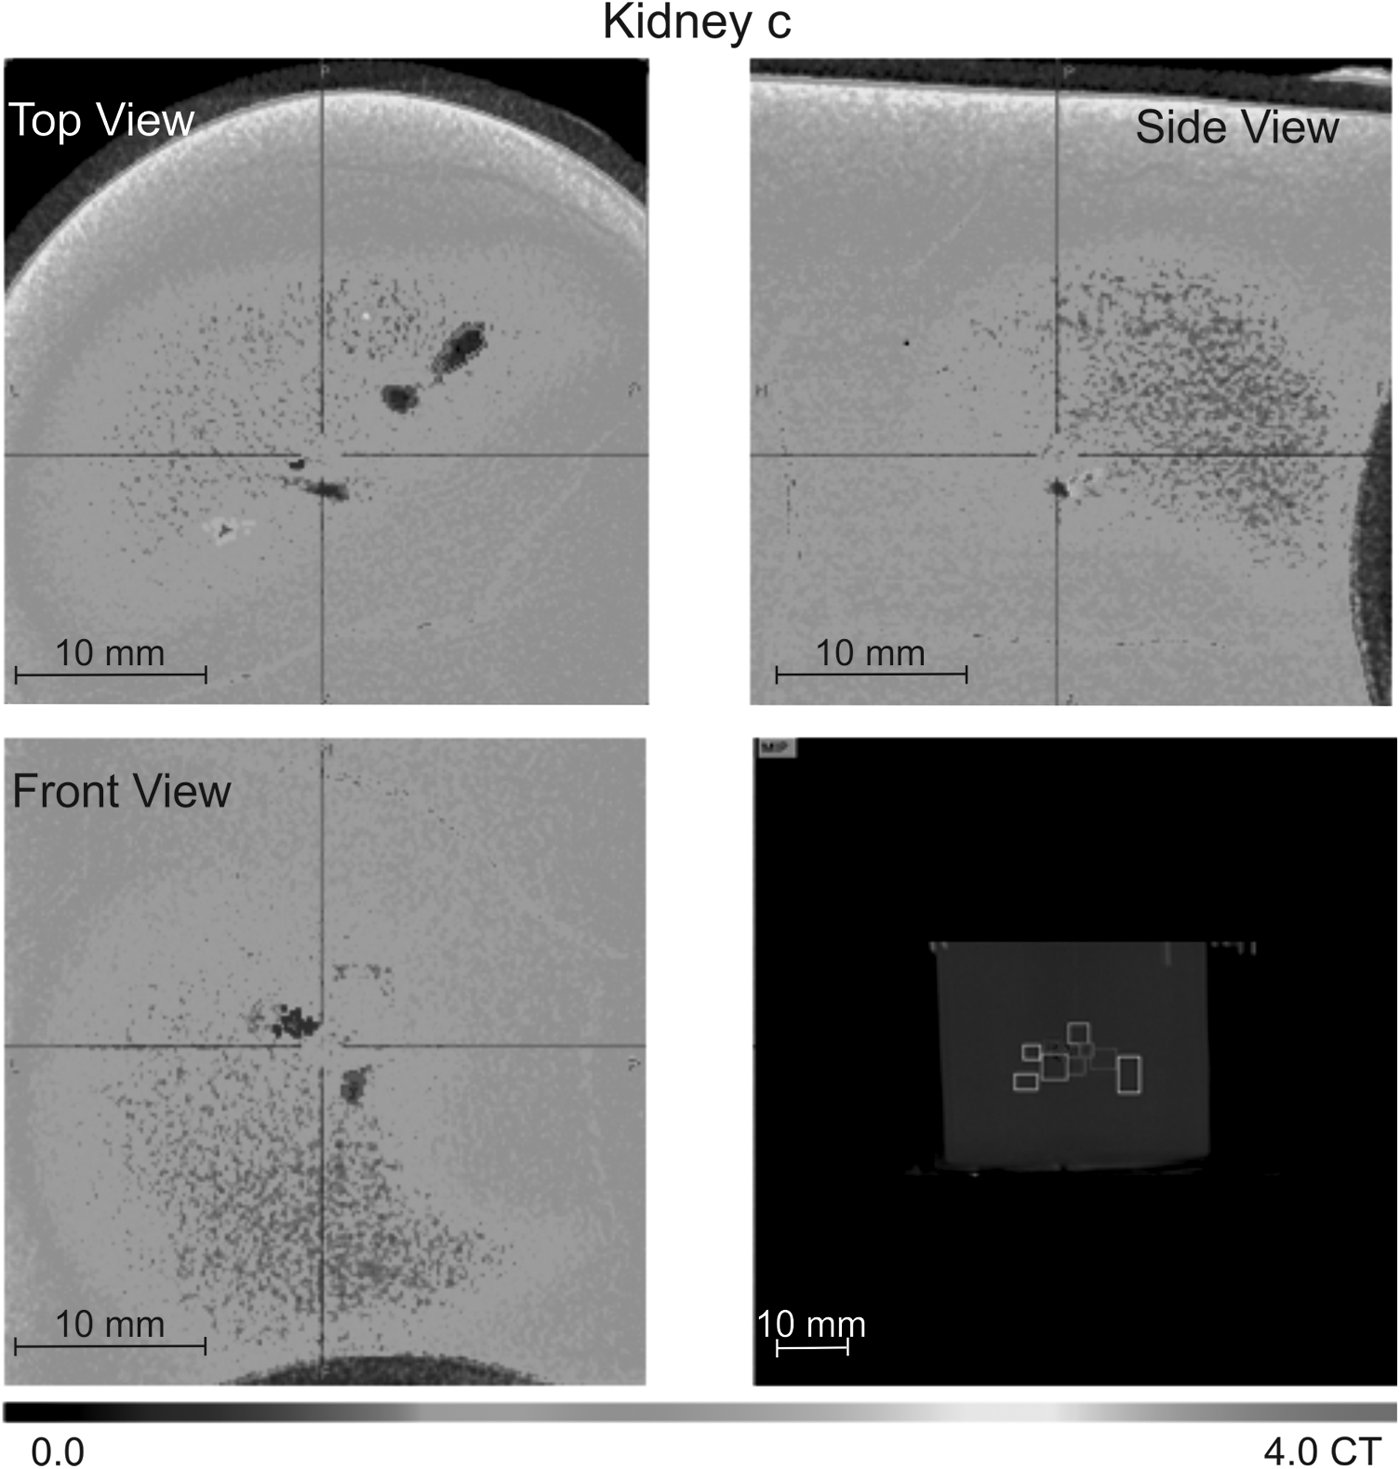
CT image of the three orthogonal views of the Kidney c, loaded to 55% v/v Me2SO, in which six drops of water have been injected and then cooled to −196°C. Spatial resolution of 100 μm.
The bottom left image shows another lateral view of the kidney, where light blue and purple VOIs are observed. In the bottom right image, the kidney is observed in Maximum Intensity Projection (MIP) with the eight VOIs' bounding boxes in different colors, which correspond to each drop of water injected. Most of the VOIs are shown in line, in the same way as the drops were inserted. However, the red VOI is farther from that line. This could be due to the diffusion of part of the water inside the canal that the needle made during the injection.
Figure 4 shows the CT image of the three orthogonal views of the Kidney b. The kidney was loaded with a 55% v/v Me2SO solution, and four drops were inserted in it before cooling them to −196°C. For the image visualization, we used the cold scale from 0.0 to 3.3 CT values. The border of the kidney is barely appreciable in a blue color in all the views.
In the top left image, three of the four VOIs are observed in colors pink, red, and blue. VOIs show the location of the ice crystals. In the top right image, the blue VOI appears at the top. The bottom left image shows another view of the kidney, where two VOIs are observed (light blue and blue). The bottom right image shows the MIP view of the container with the four VOIs in line: pink, red, blue, and light blue. The capability to detect ice crystals is also proved with the CT image of Kidney c. Six drops of water were inserted in the kidney, loaded with 55% v/v of Me2SO solution, before cooling it to −196°C. However, according to the CT values calculated by the VOI tool, we found nine possible ice crystals.
Figure 5 shows the three orthogonal views of the Kidney c and the VOIs found. The image uses the cold scale from 0.0 to 4.0 CT values. The kidney is barely seen in all the views in blue color. In the top left image, four of the VOIs are observed in colors: light blue, blue, purple, and red. The top right image shows the side view of the kidney where the brown VOI is detected. In the bottom left image, the VOIs blue and purple can be observed. The bottom right image shows the MIP view, where the container can be seen with all the VOIs in line, from left to right: green, light blue, brown, blue, pink, orange, purple, red, and yellow. All these nine VOIs have CT values in the range of ice CT values, so it was difficult to assign which VOIs corresponded to the water drops injected.
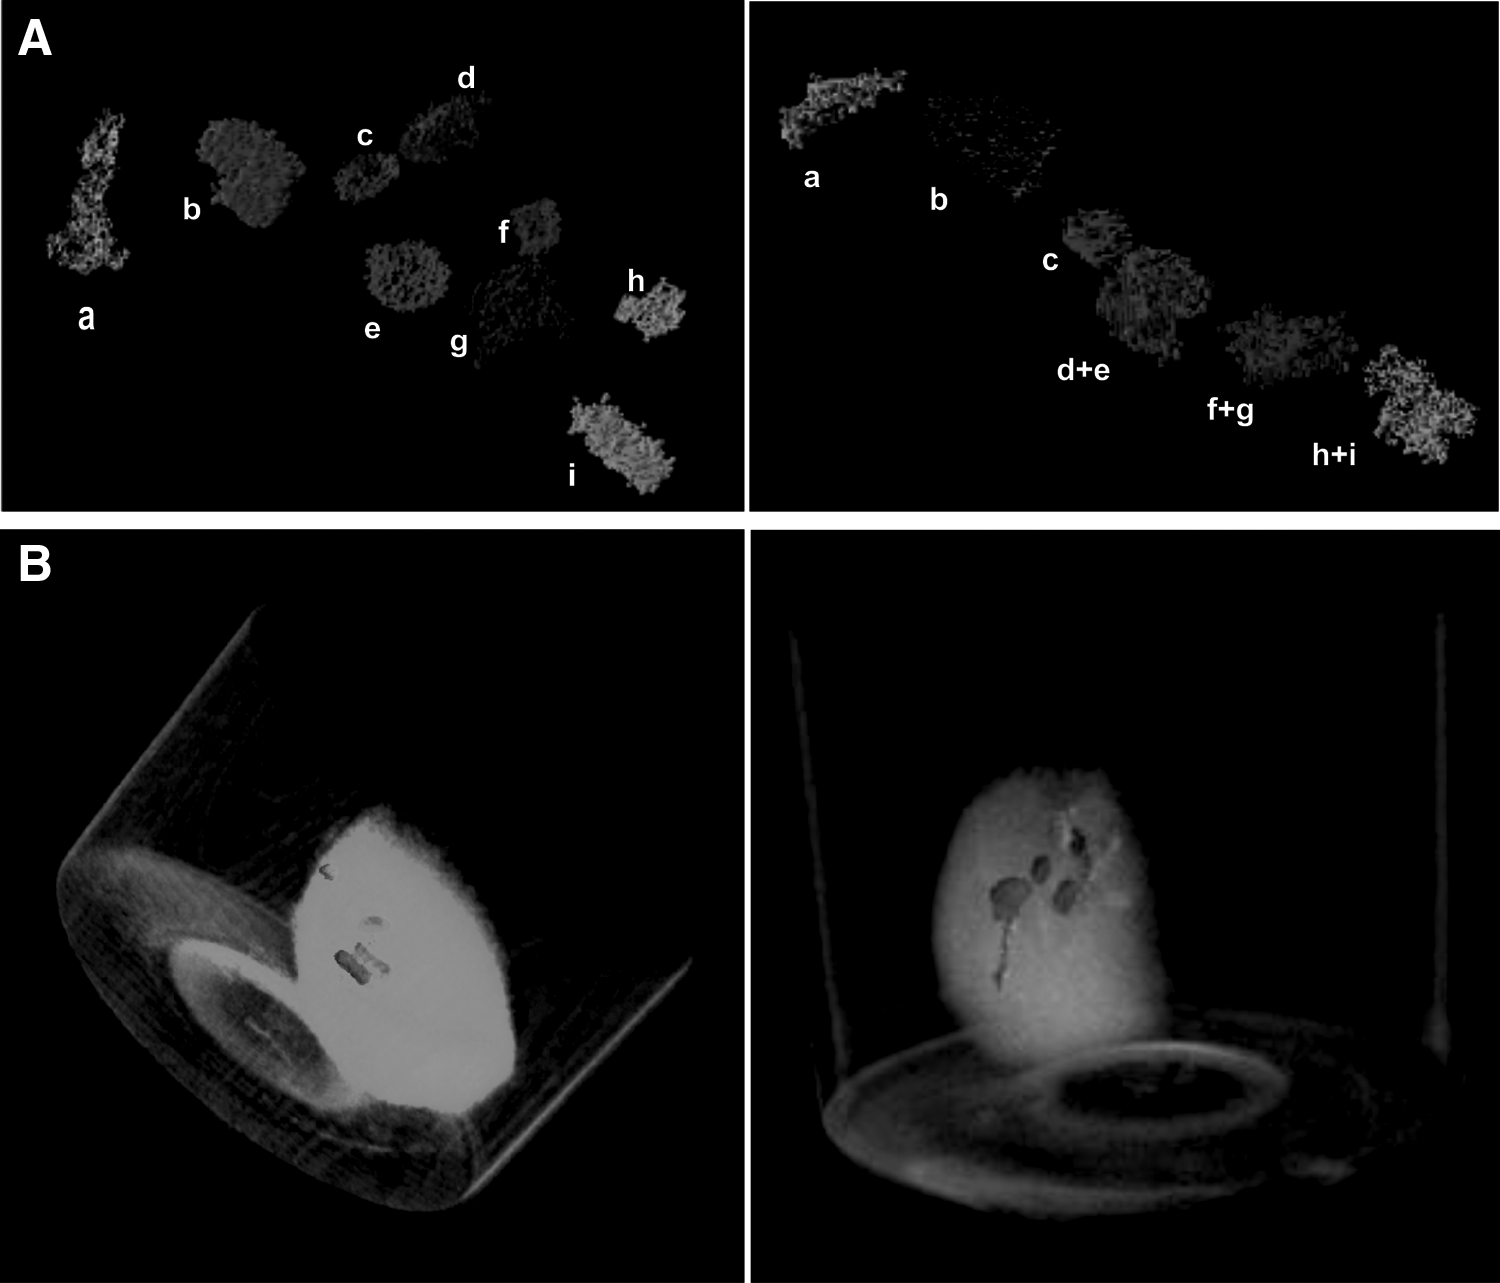
One explanation could be that some water drops have diffused before being crystallized, and as a result, they have been divided into two drops. According to the proximity of some of the drops and the volume detected in them, we have grouped some of the drops together. The result can be seen in Figure 6A. In the left panel, the nine VOIs found in a line are shown, corresponding to yellow (a), red (b), purple (c), orange (d), pink (e), blue (f), brown (g), light blue (g), and green (h). We have grouped together in one VOI the VOIs (d+e); the VOIs (f+g), and the VOIs (h+i), having as a result six VOIs, as observed in the right panel of Figure 6A. The corresponding detected volumes of those joined VOIs are shown in Table 1. The VOIs have been assigned to the injected drops according to the detected volume and their position.
Data Showing the Drops of Water Inserted in Kidney a, b, and c, Calculated from the Volume of Interests
The table shows the average CT attenuation (CT values), the injected volume of the drops (μL), the volume detected through the VOIs (μL), the percentage of detection, (%) and the color for each injected drop for the three Kidneys a, b, and c.
The letter corresponds to the VOIs indicated in Figure 6A for Kidney c.
CT, computed tomography; VOI, volume of interest.
Figure 6B shows a three-dimensional (3D) rendered image of Kidney b, in the left panel, and Kidney c, in the right panel, where all the VOIs are visualized. The 3D images are created showing only the voxels, which has a higher attenuation than a certain CT value, in which the threshold is chosen by the user. The VOIs indicate the location of the ice crystals. This way it results a very precise tool to determine the distribution of the ice crystals inside the cryopreserved tissues or organs.
Table 1 shows the X-ray attenuation (CT values) of each drop of water for each kidney at −140°C. The values go from 0.65 to 0.90 CT values for Kidney a; from 0.56 to 0.95 CT values for Kidney b, and from 0.63 to 1.02 CT values in the case of Kidney c. According to our previous experiments, X-ray attenuation of ice is 0.80 ± 0.20 CT values. All VOIs show CT values within this range, indicating the region where ice crystals are localized. Table 1 also shows the data about the volumes of water drops inserted in each kidney.
There is a comparison of the volume inserted in the drop and the volume calculated inside the VOI by the PMOD software. Although the expansion of water when it becomes ice is not considered, the proportion between volumes maintains constant for each drop and it gives a qualitative idea of the water diffusion inside the kidney. In the case of Kidney c, the detected volume has been calculated according to the joined VOIs shown in Figure 6A, right panel. It shows how most of the water has diffused inside the tissues for all the kidneys before they were frozen. For the Kidney a, the highest percentage of volume detection according to the injected volume was 46%. For the Kidney b, this maximum percentage was higher, 69%. The maximum percentage of volume detection was found in the case of the Kidney c, with 70%.
Detection of extra/intracellular ice in ovarian tissues cryopreserved by a controlled-rate slow-cooling protocol
Figure 7 shows the relevance of the temperature of the seeding in the conventional freezing protocols known as slow freezing. Figure 7A shows a cryopreserved ovarian tissue by this protocol, in which the seeding was performed at −8°C as the original protocol. 30 The image shows a very short range of colors with a very tiny ice nucleus along the whole solution, including the tissue. The colors show a low attenuation in general, from a dark blue color, in the case of ice, to a clear green color as maximum.
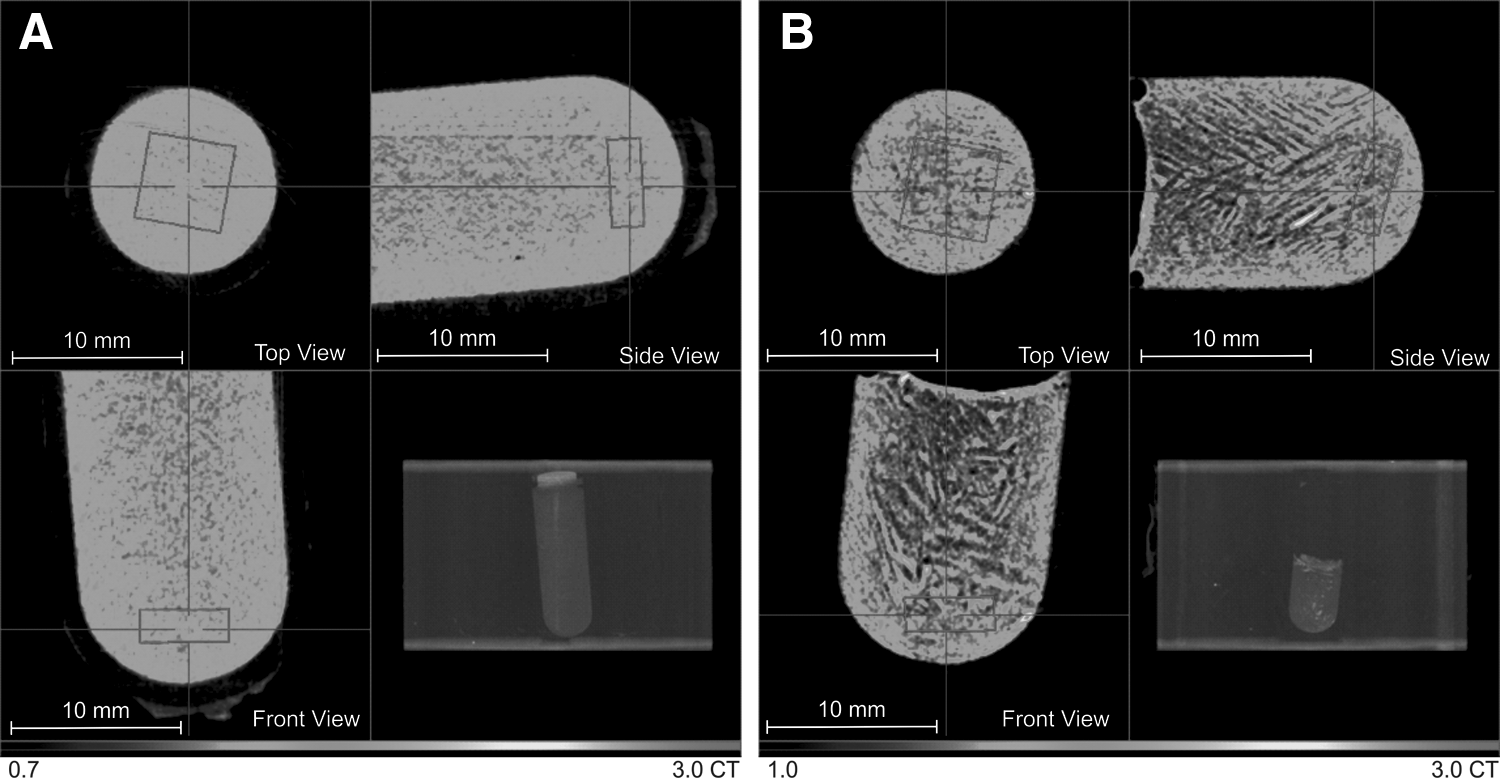
CT images of the three orthogonal views of a cryovial with a ovarian tissue of 5 × 5 × 1 mm3 cryopreserved by a controlled-rate slow-cooling protocol. A pink cubic VOI of 4 × 4 × 1.5 mm3 is placed in the area of the tissues. In
Figure 7B shows the case of the ovarian tissue cryopreserved by the protocol with the seeding temperature at −5.5°C. A very different image is observed. Ice dendrites of extracellular ice are observed in a dark blue color and striped shape, while small islands of high Me2SO concentrations are shown from green to yellow and red colors. In the area of the tissue, the presence of ice is also observed, although ice crystals are of a smaller size than those that appear in the rest of the solution. Nevertheless, there are also many areas of the tissues visible with a high attenuation, in green-yellow color, indicating a high concentration of Me2SO, and therefore, a better protection of IIF in those parts of the tissues.
These results agree with data of Table 2, which show a higher average attenuation, 1.58 ± 0.13 CT values, in the case of the highest seeding temperature (−5.5°C) versus 1.45 ± 0.07 CT values for the tissues in which the seeding was performed at −8°C. Furthermore, the maximum attenuation value is much higher when the seeding temperature was increased to −5.5°C (2.57 vs. 1.78), indicating that a smaller proportion of the tissue is able to form ice.
Computed Tomography Attenuation Data of Cryopreserved Ovarian Tissue Calculated from a 4 × 4 × 1.5 mm3 Volume of Interest
The table shows the average, minimum, and maximum CT attenuation (CT values) within the tissues cryopreserved with a seeding temperature of −8°C and −5.5°C. The error of the average attenuation, in brackets, corresponds to the standard deviation of the attenuation values calculated for all the pixels contained in the VOI.
Discussion
In the cryopreservation of biological samples, it is essential to avoid the formation and growth of ice, due to the mechanical damage caused by its crystalline structure. This problem is especially relevant in bulky organs, because of their large volume and the complexity of their vascular systems.6,7 Several methods have attempted to detect this deleterious formation of ice in large tissues or organs, such as cryomicroscopy,19–21 freeze substitution, 22 or isothermal freeze-fixation, 27 but there are still several problems, such as limitations in the samples to be visualized in microscopy,19–21 an additional risk of recrystallization 22 or invasiveness. 27
In this work, we propose the use of X-ray CT to detect this ice formation inside organs, sorting out the aforementioned problems. Initial tests were carried out to validate the appropriateness of the technology, such as the successful detection of ice and water in Me2SO solutions or the detection of water inserted in a kidney through a capillary.
The final test consisted of the detection of ice in tissues and organs. In the case of organs, we have assessed the detection of crystallized ice from different drops of water inserted into rabbit kidneys. The kidneys were loaded with cryoprotectant solutions containing Me2SO at low temperatures, below −140°C, and several drops of water with a volume between 2 and 8 μL were then introduced inside the organs. X-ray CT was used during the following cooling of the organ to −196°C. The cooling system developed permits the control of the temperature where the sample is placed during the image acquisition, which makes it possible to detect ice crystals in vitrified tissues or organs under the glass transition temperature, with a spatial resolution up to 50 μm, to evaluate the samples after the cryopreservation procedure.
The different VOIs observed indicated the location of the ice crystals for each kidney. The low attenuation values (CT values) shown in Table 1, calculated from the different VOIs, proved that the volume contained in these VOIs correspond to ice, with an average CT attenuation range of 0.56 to 1.02 CT values among all the drops of the three kidneys. The VOIs also allow us to calculate the volume of the ice crystal detected and compare it to the volume of the water drops inserted. We observed that the volume detected was always lower than the volume of the water drops inserted, with a maximum of 70% of volume detected for one of the drops in the case of Kidney c.
An explanation of this phenomenon could be the water diffusion during the injection of the drops into the surrounding tissue, before the crystallization by cooling the samples in liquid nitrogen. An interesting point is what we observed in the case of Kidney c. Nine VOIs could be detected as ice crystals, but only six water drops were inserted. Again, we think that some water drops may have diffused before being crystallized and as a result they divided into two different drops. To resolve this, we joined some of the VOIs according to the detected volume and their position, as shown in Figure 6 and Table 1.
On the contrary, 3D images were created showing only the voxels which had an attenuation higher than a certain CT value. This threshold was chosen to determine the position of the VOIs, and therefore the position of the ice crystals in a 3D image of the kidney, which would help us to assess the damage caused by the ice according to its location. Taking this into account, we were able to determine that for those droplets found in the medulla, the percentage of the detection was higher. We think that in this case, a very low diffusion of the water took place. On the opposite side, for those in the cortex, the percentage of detection was quite low, probably because some leaking throws the channel left by the needle. Finally, in the calix, with an intermediate percentage of detection, the diffusion was higher than in the medulla (less compact tissue) but the leaking effect found in the cortex was not present.
On the contrary, ovarian tissue was also analyzed under the CT device after being cryopreserved by the conventional slow-freezing protocol, 30 with some adaptations to our controlled-rate freezing device. When the protocol was performed with a low seeding temperature, −8°C, ice crystals of very small dimensions were observed in the same proportion along the whole vial, including the area of the location of the tissue. However, when we increased the seeding temperature up to −5.5°C a totally different ice structure was observed, especially in the area of the solution. Dendritic ice crystals were differentiated very clearly in a dark blue color and striped shape. Moreover, small regions with a high Me2SO concentration were formed in the inner part of the solution, as a consequence of the solute rejection during the growth of the extracellular ice.
A similar phenomenon could be also observed in the region of the tissue: some of the areas showed a higher Me2SO concentration, in green-yellow colors. However, ice crystals were also differentiated in a blue color within the tissues, although with a smaller size and different shape of those of the extracellular ice, since the cell packing density of tissues does not allow ice to grow as easily. Data from Table 2, obtained from the VOI containing the tissue, also show a higher maximum value of attenuation for the protocol using the increased seeding temperature, −5.5°C. Higher attenuations (higher Me2SO concentrations) very probably confer a better degree of cryoprotection in this case of slower ice growth (−5.5°C).
With these experiments, we prove that ice and small volumes of water can be differentiated from Me2SO solutions using X-ray CT, due mainly to the low energy used in our CT device and its high spatial resolution. We are able to detect ice crystals of volumes of up to 1 μL inside vitrified kidneys, previously loaded with Me2SO solutions, and evaluate ovarian tissues after cryopreservation with different freezing protocols. Furthermore, the 3D rendering of the samples also allows obtaining a precise distribution of the ice formed inside the tissues or organs, and therefore assessing the possible damage caused during the cryopreservation procedure. On the contrary, the CT imaging can be also applied during the cooling and warming processes of the cryopreservation protocols under study, for assessment of the Me2SO concentration in samples, as we have shown in our previous work. 29
This approach has a straightforward application in organ cryopreservation. This CT technology provides online information of the CPA concentration and ice formation inside biological samples, including its distribution. This information is of utmost importance to adjust the necessary parameters in the control process of new cryopreservation protocols to achieve a successful protocol that avoids the ice formation and the toxicity effects on tissues and organs at any time of the cryopreservation procedure.
Footnotes
Acknowledgments
This work has been partially supported by the Junta de Andalucía, Proyectos de Investigación de Excelencia (P08-CTS-03965) and Siemens Healthcare S.L.U. (0708/2729).
Author Disclosure Statement
No conflicting financial interests exist.