
Abstract
The scientific impact of translational biomedical research largely depends on the availability of high-quality biomaterials. However, evidence-based and robust quality indicators (QIs) covering the most relevant preanalytical variations are still lacking. The aim of this study was to identify and validate a QI suitable for assessing time-to-centrifugation (TTC) delays in human liquid biospecimens originating from both healthy and diseased individuals. Serum and plasma samples with varying TTCs were analyzed by liquid chromatography coupled to tandem mass spectrometry (LC-MS/MS) in a pilot cohort of healthy individuals to identify a suitable QI candidate. Taurine (TAU), as a TTC QI candidate, was validated in healthy individuals and patients with rheumatologic and cardiologic diseases, considering the (1) preanalytical handling temperature, (2) platelet count, and (3) postcentrifugation delay. For discrimination of high TTC (TTC >60 minutes) from low TTC serum specimens, a probability calculation tool was developed (Triple-T-cutoff-model). TTC-dependent changes in healthy individuals were observed for amino acids, particularly TAU. Validation of the TAU levels in an independent cohort of healthy individuals revealed a time-dependent increase in serum, but not in plasma, for a TTC delay of 30–240 minutes. TAU increases were dependent on the handling temperature and platelet count and volume. By contrast, no changes in TAU concentrations were observed for additional postcentrifugation delays. Validation of TAU and the Triple-T-cutoff-model, in rheumatologic/cardiologic patient collectives, allowed the discrimination of samples with TTC ≤60 min/>60 min with estimated AUROC (area under the receiver operating characteristic curve) values of 89% [78%–100%]/86% [71%–100%] and 91% [79%–100%]/84% [68%–100%], respectively. Considering the preanalytical handling temperature and platelet count and volume, TAU and the Triple-T-cutoff-model represent reliable QIs for TTC >60 minutes in serum samples from healthy individuals and selected rheumatologic/cardiologic patients. However, further studies in larger patient collectives with various diseases are needed to assess the robustness and potential of the QIs presented in this article as biobanking quality assurance/quality control tools to support high-quality biomedical research.
Introduction
Biobanks support the collection, processing, storage, and distribution of biomaterials by strictly standardizing workflows and developing appropriate quality assurance (QA) and quality control (QC) concepts. However, many process variations, which are sources of bias, occur outside of the biobank.1,2 Thus, strategies have to be established to ensure a high degree of consistency in the preanalytical or “processing” phase and appropriate tools have to be developed for suitable QA and QC of the preanalytical procedures and hosted biomaterials. 3 The latter can be achieved either by (online) sample tracking for granular documentation of the whole life cycle of a biomaterial using information and communication technologies, such as RFIDs (radio-frequency identification) and/or 2D-barcoded tubes, 4 or by analyzing certain quality biomarkers that are indicative of preanalytical variations that affect the properties of a biospecimen. Both strategies have their pros and cons. Sample tracking allows valid and exact monitoring of each step in the preanalytical workflow, but often requires an extensive and costly infrastructure that might be unavailable, for example, at local study sites of multicenter trials. 4
By contrast, quality indicators (QIs) have several advantages, for example, they allow retrospective analyses and thus qualification of hundreds of thousands of samples already collected and stored in historical biobanks. An optimal QI should meet several requirements: have a ubiquitous presence, maintain its level irrespective of disease status, and be able to be measured with a very precise and cost-efficient measurement method. Despite some reports identifying quality biomarkers by exposing samples from healthy individuals to certain preanalytical conditions, the usefulness of such QIs across all disease entities is still uncertain. The potential influences of certain disease states on the reference ranges of specimen QIs should be addressed before their practical application, particularly in disease-oriented or health care-integrated biobanks.
This article describes the identification and validation of taurine (TAU) as an easy-to-apply QI for clinical biobanking, focusing on the potential time delays between collection and centrifugation in biospecimens from healthy individuals and selected rheumatologic and cardiologic patient collectives.
Materials and Methods
Overall design for internal time-to-centrifugation sample collection
Eighty-four self-reported healthy volunteers (pilot cohort and test cohorts 1, 2, 3, 4, and 5) and 62 patients (validation cohorts 1 and 2) were included into this study. The demographic and clinical data of the study cohorts as well as the materials and centrifugation conditions used are summarized in Tables 1 and 2, respectively. Written informed consent was obtained from all participants. The study was approved by the respective independent Ethics Committees (IBBJ: 3335-01/12, 3921-11/13, and 4893-08/16; IBBL: CNER ##201107/02 and CNER ##20093/0; HUB: 4121; ibdw: 149/11 and 278/17-Z-me). Serum samples of healthy individuals were collected at IBBJ (pilot cohort and test cohort 1, 3, and 4), Integrated BioBank of Luxembourg (test cohort 2), and Hannover Unified Biobank (test cohort 5). Validation cohort 1 includes residual serum samples from rheumatologic patients. Validation cohort 2, kindly provided by the Interdisciplinary Bank of Biomaterials and Data of Würzburg, comprises samples from cardiologic patients. Blood was freshly drawn from each individual and handled according to the conditions listed in Table 2. All relevant time points, for example, time of blood taking, time to centrifugation (TTC), and time to freeze (TTF), were monitored and documented. Collected samples were stored at −80°C until analysis. Figure 1 summarizes the study workflow and the different cohorts analyzed.
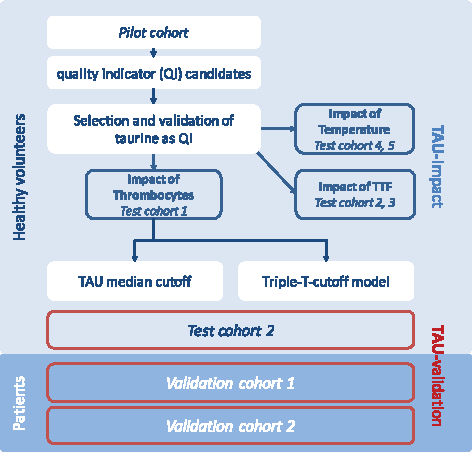
Study workflow. Schematic overview of the QI study describing the pilot cohort (n = 5), test cohort 1 (n = 23), test cohort 2 (n = 5), test cohort 3 (n = 20), test cohort 4 (n = 6), test cohort 5 (n = 25), and validation cohort 1 (n = 30) and validation cohort 2 (n = 32), and analytical issues. QI, quality indicator; TAU, taurine; TTC, time-to-centrifugation; TTF, time to freeze.
Demographic and Clinical Data of Study Cohorts
Mean thrombocyte count in healthy individuals for automated Hematology Analyzer XN-series according to the manufacturer: PLT-I: 265 ± 59 × 109/L, PLT-O: 250 ± 56 × 109/L, Sysmex Europe GmbH.
MPV range in healthy individuals for automated Hematology Analyzer XN-series according to the manufacturer: 10.6 ± 0.7 fL (femtoliter), Sysmex Europe GmbH.
MPV, mean platelet volume.
Materials and Centrifugation Conditions Used in the Individual Study Cohorts
RT, room temperature; TTC, time to centrifugation.
Quantification of metabolites
In the pilot cohort and test cohorts 3 and 4, metabolites from six analyte classes (40 acylcarnitines, 21 amino acids, 21 biogenic amines, 90 glycerophospholipids, 15 sphingolipids, and 1 sugar) were analyzed. Serum/plasma was prepared according to the manufacturer's protocol using an AbsoluteIDQ™ kit p180 (Biocrates Life Science AG, Innsbruck, Austria). Sample analysis was performed on an API4000™ LC-MS/MS System (AB SCIEX, Framingham, MA) equipped with an electrospray ionization source and Analyst Software (1.5.1 and 1.6.2 AB SCIEX). In brief, internal standard (10 μL) and serum/plasma (10 μL) were added to the center of the spots of the kit plate. In a nitrogen evaporator, spots were dried at room temperature (RT) for 30 minutes. Then, a 5% solution of phenyl isothiocyanate (Merck, Darmstadt, Germany) was pipetted onto the spots. After derivatization for 20 minutes at RT, the plate was dried again using an evaporator for 60 minutes. For the extraction of metabolites, 300 μL of a 5 mM ammonium acetate solution in methanol (Merck; Roth, Karlsruhe, Germany) was added, incubated for 30 minutes on a shaker (450 rpm), and centrifuged at 100 × g for 2 minutes. The extract was split for analysis. Amino acids and biogenic amines were analyzed (1:2 in high-performance liquid chromatography [HPLC] water) first by reversed-phase LC-MS/MS and injection of 10 μL sample. Flow injection analysis was used to measure acylcarnitines, lipids, and sugars (1:4 in methanol). Two subsequent 20 μL injections (one for positive and one for negative mode analysis) were directly transferred to the MS. The concentrations of metabolites were calculated using the MetIQ™ software package, and normalization was achieved for test cohort 3 by applying internal QC, which are integral parts of the AbsoluteIDQ kit.
Quantification of amino acids
Amino acids were analyzed by HPLC based on the principle of cation exchange with a Biochrom 30 plus HPLC device (Biochrom Ltd., Cambridge, England) according to the manufacturer's protocol in test cohorts 1, 2, and 5 as well as validation cohorts 1 and 2.
Statistics and data visualization
To summarize the distributions of the indicators, box plots were generated according to standard definitions: bold lines depict median values, boxes mark interquartile ranges (IQRs) between the upper (75th) and lower (25th) quartiles, and whiskers were drawn according to Tukey's recommendations (1.5 × -IQR). To compare multiple measurements for each individual, we applied linear mixed models or paired t-tests, Friedman test. The p-values reported in Figures 2A, 3A, and 4 are Bonferroni corrected. To classify biospecimens into TTC ≤60 minutes versus TTC >60 minutes, we generated receiver operating characteristic curves (ROC) and areas under the ROC (AUROC) and derived cutoff points (for which we report the estimated sensitivity and specificity). Each ROC only includes one measurement for each individual—in the case of multiple measurements for each individual, we applied random sampling of the measurements without replacement and generated a distribution across random draws (Fig. 2B).

TTC-dependent changes of TAU in healthy volunteers (test cohort 1).
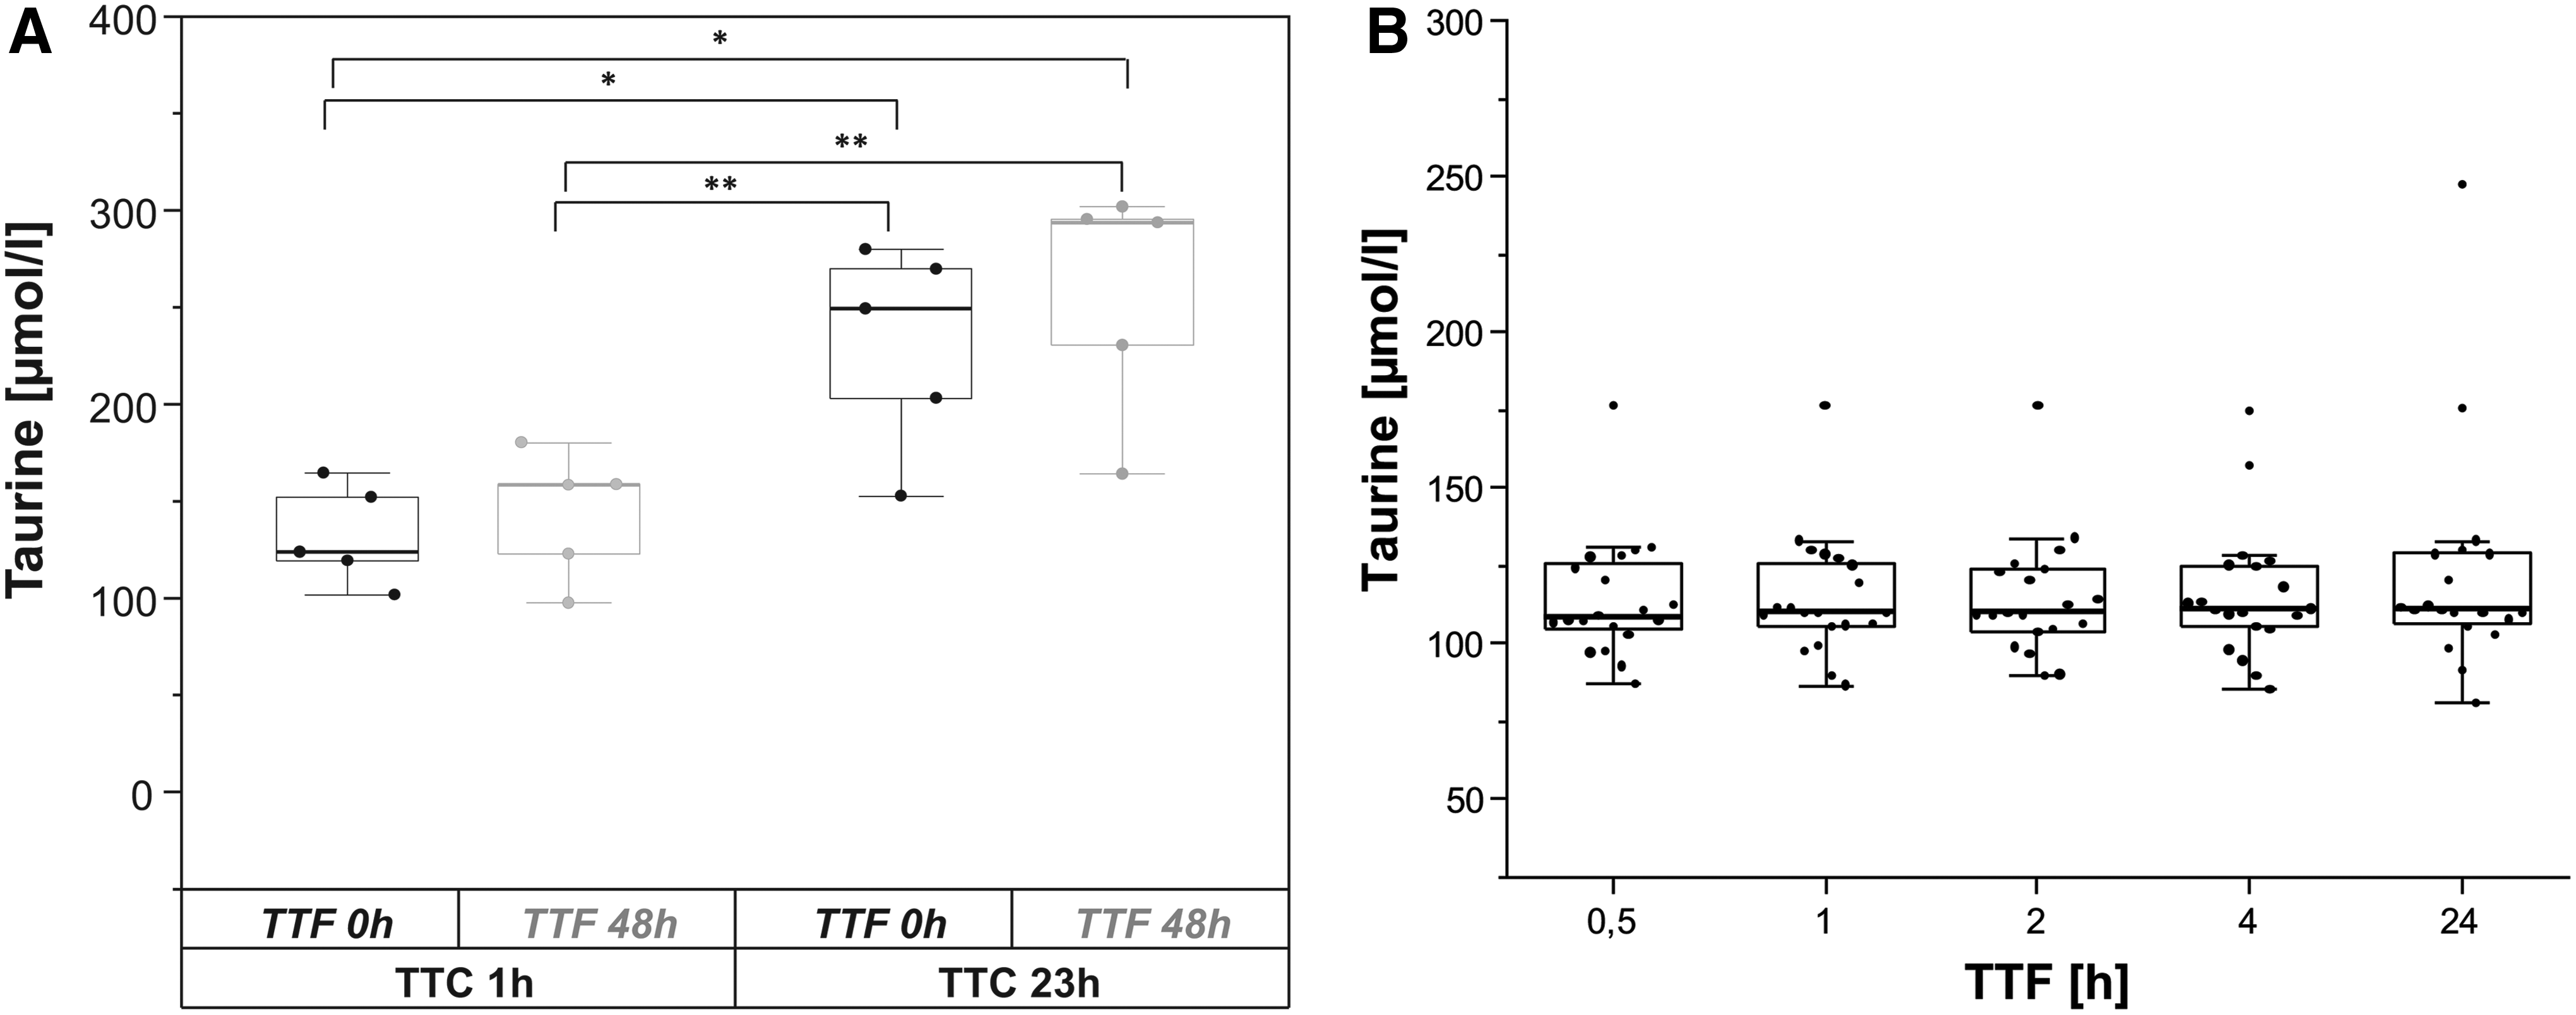
Impact of precentrifugation and postcentrifugation delay on TAU release (test cohorts 2, 3).
Apart from the ROCs derived for the candidate TAU concentration (μmol/L), we developed a model (Fig. 6), including total platelet volume (mean platelet volume [MPV] × platelet count × 103 per μL/100). The so-called Triple-T-cutoff-model generates probabilities for a binary outcome and was trained on data from serum samples of 23 healthy volunteers from test cohort 1. Both predictors entered the logistic regression model as fixed, linear effects without interactions, and we used Generalized Estimating Equations (in the geepack R-package) 5 to address multiple measurements within one individual. The model was tested in validation cohort 1 and validation cohort 2 (Fig. 7). We used SPSS 19 and 25 (IBM, New Armonk, NY,) as well as R 3.54.1 for statistical analyses. In addition, we used Origin 2018 (32 bit) software to generate graphs and Microsoft Office Excel, Version 2010, to generate tables.
Results
Impact of TTC delay on serum and plasma metabolite concentrations
In the first set of experiments, TTC-dependent changes in serum and plasma metabolites were analyzed in a pilot cohort (n = 5) of samples from healthy volunteers using an LC-MS/MS-based targeted metabolomics profiling approach. We observed a TTC-dependent increase or decrease in some of the metabolites analyzed, particularly a time-dependent concentration change for TAU, restricted to serum (data not shown). In serum, TAU mean values of 113.8 μmol/L (95% confidence interval [CI] 101.2–126.0 μmol/L), 146.6 μmol/L (95% CI 131.5–161.7 μmol/L), 160.8 μmol/L (95% CI 153.7–167.9 μmol/L), and 191.8 μmol/L (95% CI 166.9–216.7 μmol/L) were calculated for TTCs of 30, 60, 120, and 240 minutes, resulting in fold changes of 1.3, 1.4, and 1.7, respectively, when TTCs of 60, 120, and 240 minutes were compared with the basal TTC 30-minute time point.
Validation of TAU as a TTC-dependent QI in an independent cohort of healthy individuals
To validate the results from the pilot cohort, TAU concentrations were measured at relevant TTC time points in serum and EDTA-plasma specimens in a second, independent cohort of 23 healthy volunteers (test cohort 1). The results revealed a time-dependent increase in TAU (fold change: 1.7) only in serum, but not in plasma after a TTC delay of 30 minutes compared to 240 minutes, and thus confirmed the results obtained with the pilot cohort (Fig. 2A). By analyzing multiple ROCs and AUROCs (area under the ROC) for only one (randomly) drawn measurement of each volunteer, a median optimal TAU cutoff level in healthy individuals of 160 μmol/L was calculated using the Youden index for discrimination of serum samples with TTC >60 minutes (Fig. 2B).
Evaluation of the impacts of precentrifugation and postcentrifugation delay on TAU increase in healthy individuals (test cohort 2, n = 5; test cohort 3, n = 20)
Next, we analyzed the combination of precentrifugation and postcentrifugation delay on TAU increase in another independent test cohort (test cohort 2) provided by IBBL. Comparison of TAU concentrations after centrifugation delays of 1 and 23 hours (TTC) resulted in a TAU increase with a prolonged handling time (Fig. 3A), which exceeded the TAU values of test cohort 1 measured after a TTC delay of 240 minutes (Fig. 2A). By contrast, no changes in TAU concentrations were observed with additional postcentrifugation delays (TTF) of serum samples for 48 hours compared to TTC delays of only 1 or 23 hours. These results were confirmed in a larger independent cohort of healthy individuals (test cohort 3, n = 20) by comparing TAU concentrations at TTF of 30, 60, 120, and 240 minutes (with TTC constant at 30 minutes; p = 0.166) (Fig. 3B). These results emphasize that TAU is a QI that specifically indicates precentrifugation delays.
Influence of temperature on TAU increases with different precentrifugation time delays in healthy individuals
Evidence from the literature suggests an influence of the handling temperature on metabolite concentrations in human plasma and serum samples.6,7 We intended to identify the robustness of TAU as a QI under varying temperatures, displaying seasonal variations as well as the influence of cooled conditions during sample processing. Therefore, serum samples from six healthy volunteers (test cohort 4) were kept at 4°C, RT, or 30°C throughout the precentrifugation delay. As depicted in Figure 4, no TTC-dependent TAU increases were observed when samples were constantly cooled at 4°C, while incubation of samples at higher temperatures (RT or 30°C) resulted in an increase in TAU levels, as seen in the previous cohorts (Fig. 4 and Supplementary Table S1).
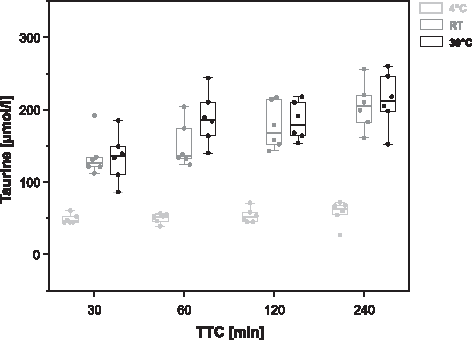
Influence of the sample handling temperature on the TAU concentration in serum samples from healthy volunteers (test cohort 4) at different preanalytical time delays (TTC: 30, 60, 120, and 240 minutes). In a linear mixed model, both the main effects and interaction had p < 0.01; subsequent temperature-stratified analyses indicated monotone linear trends between the TAU concentration and TTC for both RT and 30°C (p < 0.01).
Influence of platelet count and volume on TTC-dependent TAU increases in healthy individuals
Interindividual variations are often substantial confounders during the identification and validation of QIs in human samples. 8 As an association between TAU and platelet aggregation during blood coagulation has already been described in the literature, we plotted individual platelet counts and the MPV from a test cohort that had a broad platelet count/volume distribution (test cohort 1; n = 23) against measured TAU concentrations stratified according to different TTCs. Figure 5 shows that TAU concentrations at different TTCs correlate well with total platelet volume (MPV × platelet count × 103 per μL/100), while higher TTC-dependent increases could be observed for higher total platelet volumes.
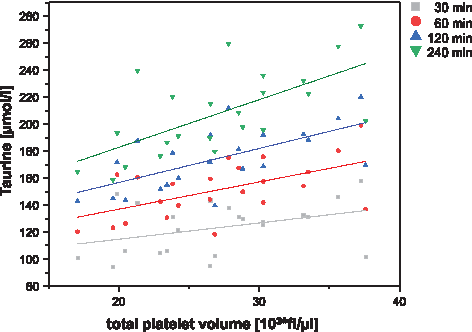
Influence of total platelet volume and precentrifugation delay on the TAU concentration in serum samples from test cohort 1. Scatter plot showing different TTC delays: gray square—30 minutes, red circle—60 minutes, blue triangle—120 minutes, and green triangle—240 minutes and total platelet volume (MPV × platelet count × 103 per μL/100) with the respective regression. MPV, mean platelet volume.
A temperature dependence was also observed (and thus confirmed) in a larger cohort of healthy individuals (n = 25, test cohort 5), including serum samples that, although stressed by various TTCs (28–178 minutes), showed no increases in TAU because the precentrifugation delay was performed under cooled conditions (4°C) (data not shown).
Development of a mathematical model that considers TAU and total platelet volume to assess the quality of serum samples by TTC delay
Based on the data from test cohort 1 (23 healthy individuals), a linear regression model (cutoff model) was developed to classify the sample quality according to a precentrifugation time delay of TTC ≤60 min/>60 min (Fig. 6). In this model, the individual TAU concentration, TTC, and thrombocyte (platelet) count and volume were considered to provide a probability calculation tool to discriminate high TTC (TTC >60 minutes) from low TTC (TTC ≤60 minutes) serum specimens. The model was referred to as the “Triple-T-cutoff-model” (Taurine-TTC-Thrombocytes-cutoff-model; TTT-cutoff-model) and is represented in Figure 6.

Triple-T-model: predicted probability for the binary outcome (>60 minutes time to centrifugation) based on the TAU concentration (μmol/L) and total platelet volume (MPV × platelet count × 103 per μL/100) from individual serum specimens as predictors. The logistic regression model used Generalized Estimating Equations (in the geepack R package) to address multiple measurements in serum samples from healthy volunteers (test cohort 1, n = 23).
Validation of TAU and the Triple-T-cutoff-model as TTC classification tools in healthy individuals
Application of the median optimal TAU cutoff (160 μmol/L) as well as the TTT-cutoff-model (using a calculated probability cutoff of 0.5 to separate serum samples with TTC >60 minutes) in healthy test cohort 2 resulted in excellent sensitivity and specificity values ≥80% (Table 3).
Accuracy of Taurine and the Triple-T-formula for Discrimination of Samples with Time to Centrifugation ≤60 min/>60 min in Different Test and Validation Cohorts
The table displays accuracy of TAU and the Triple-T-formula for discrimination of samples with TTC ≤60 min/> 60 min (gold standard) in the different study cohorts using either a cutoff value of 160 μmol/L, derived from the median optimal cutoff (Youden index value) from test cohort 1a, or an individual cutoff derived from validation cohorts 1or 2b, or 0.5 probability to derive statistics for the Triple-T-formulac, respectively.
, Not derived due to the very small sample size.
AUROC, area under the receiver operating characteristic curve; CI, confidence interval; n+, measurements with a positive test result; n−, measurements with a negative test result; n > 60, measurements with a TTC >60 minutes; n ≤ 60, measurements with a TTC ≤60 minutes; TAU, taurine.
Validation of TAU and the Triple-T-cutoff-model as TTC classifiers in serum samples from diseased collectives—rheumatologic patients (validation cohort 1; n = 30)
To assess the validity of TAU as a potential QI in specific disease entities, we first evaluated the corresponding TTC and TAU levels in inpatient samples collected from a rheumatologic ward (validation cohort 1, Table 1). In these rheumatologic patients, the time-dependent increases in TAU concentrations during precentrifugation delay at RT were comparable to the results obtained for the pilot cohort and test cohort 1 (Table 3). TAU-based classification of serum samples with TTC >60 minutes resulted in an AUROC value of 89% (95% CI 78–100) and high sensitivities (78%) as well as specificities (100%) using a cohort-specific cutoff of 151 μmol taurine/L. The classification was also tested by applying the TTT-cutoff-model (Fig. 6) as well as a median TAU cutoff of 160 μmol/L (both derived from the healthy test cohort 1) to the rheumatologic patient collective (validation cohort 1), which resulted in a similar sensitivity and specificity of 70% and 100% (AUROC values 91% [95% CI 79–100] and 89% [95% CI 78–100]), respectively (Table 3).
Validation of TAU and the Triple-T-cutoff-model as TTC prediction tools in serum samples from cardiologic patients (validation cohort 2; n = 32)
After successful application of the TAU cutoffs and the Triple-T-cutoff-model for the classification of serum samples from rheumatologic patients, we evaluated both classifiers for their ability to discriminate serum samples with TTC >60 minutes from cardiologic patients (validation cohort 2). In the latter, we obtained an AUROC value of 86% (95% CI 71–100) with a sensitivity and specificity of 80% and 94%, respectively, using a cutoff of 146 μmol taurine/L (Table 3 and Fig. 7). The efficiency of the Triple-T-cutoff-model to predict samples with a prolonged TTC (TTC >60 minutes) was confirmed by demonstrating a sensitivity and specificity of 73% and 88% (AUROC 84% [95% CI 68–100]), respectively, when using a probability cutoff of 0.5 (Table 3 and Fig. 7). However, using the median TAU cutoff of 160 μmol/L (derived from the healthy test cohort 1), we observed a slight decrease in sensitivity to 53%, whereas the specificity remained high with 94% (AUROC 86% [95% CI 71–100]).
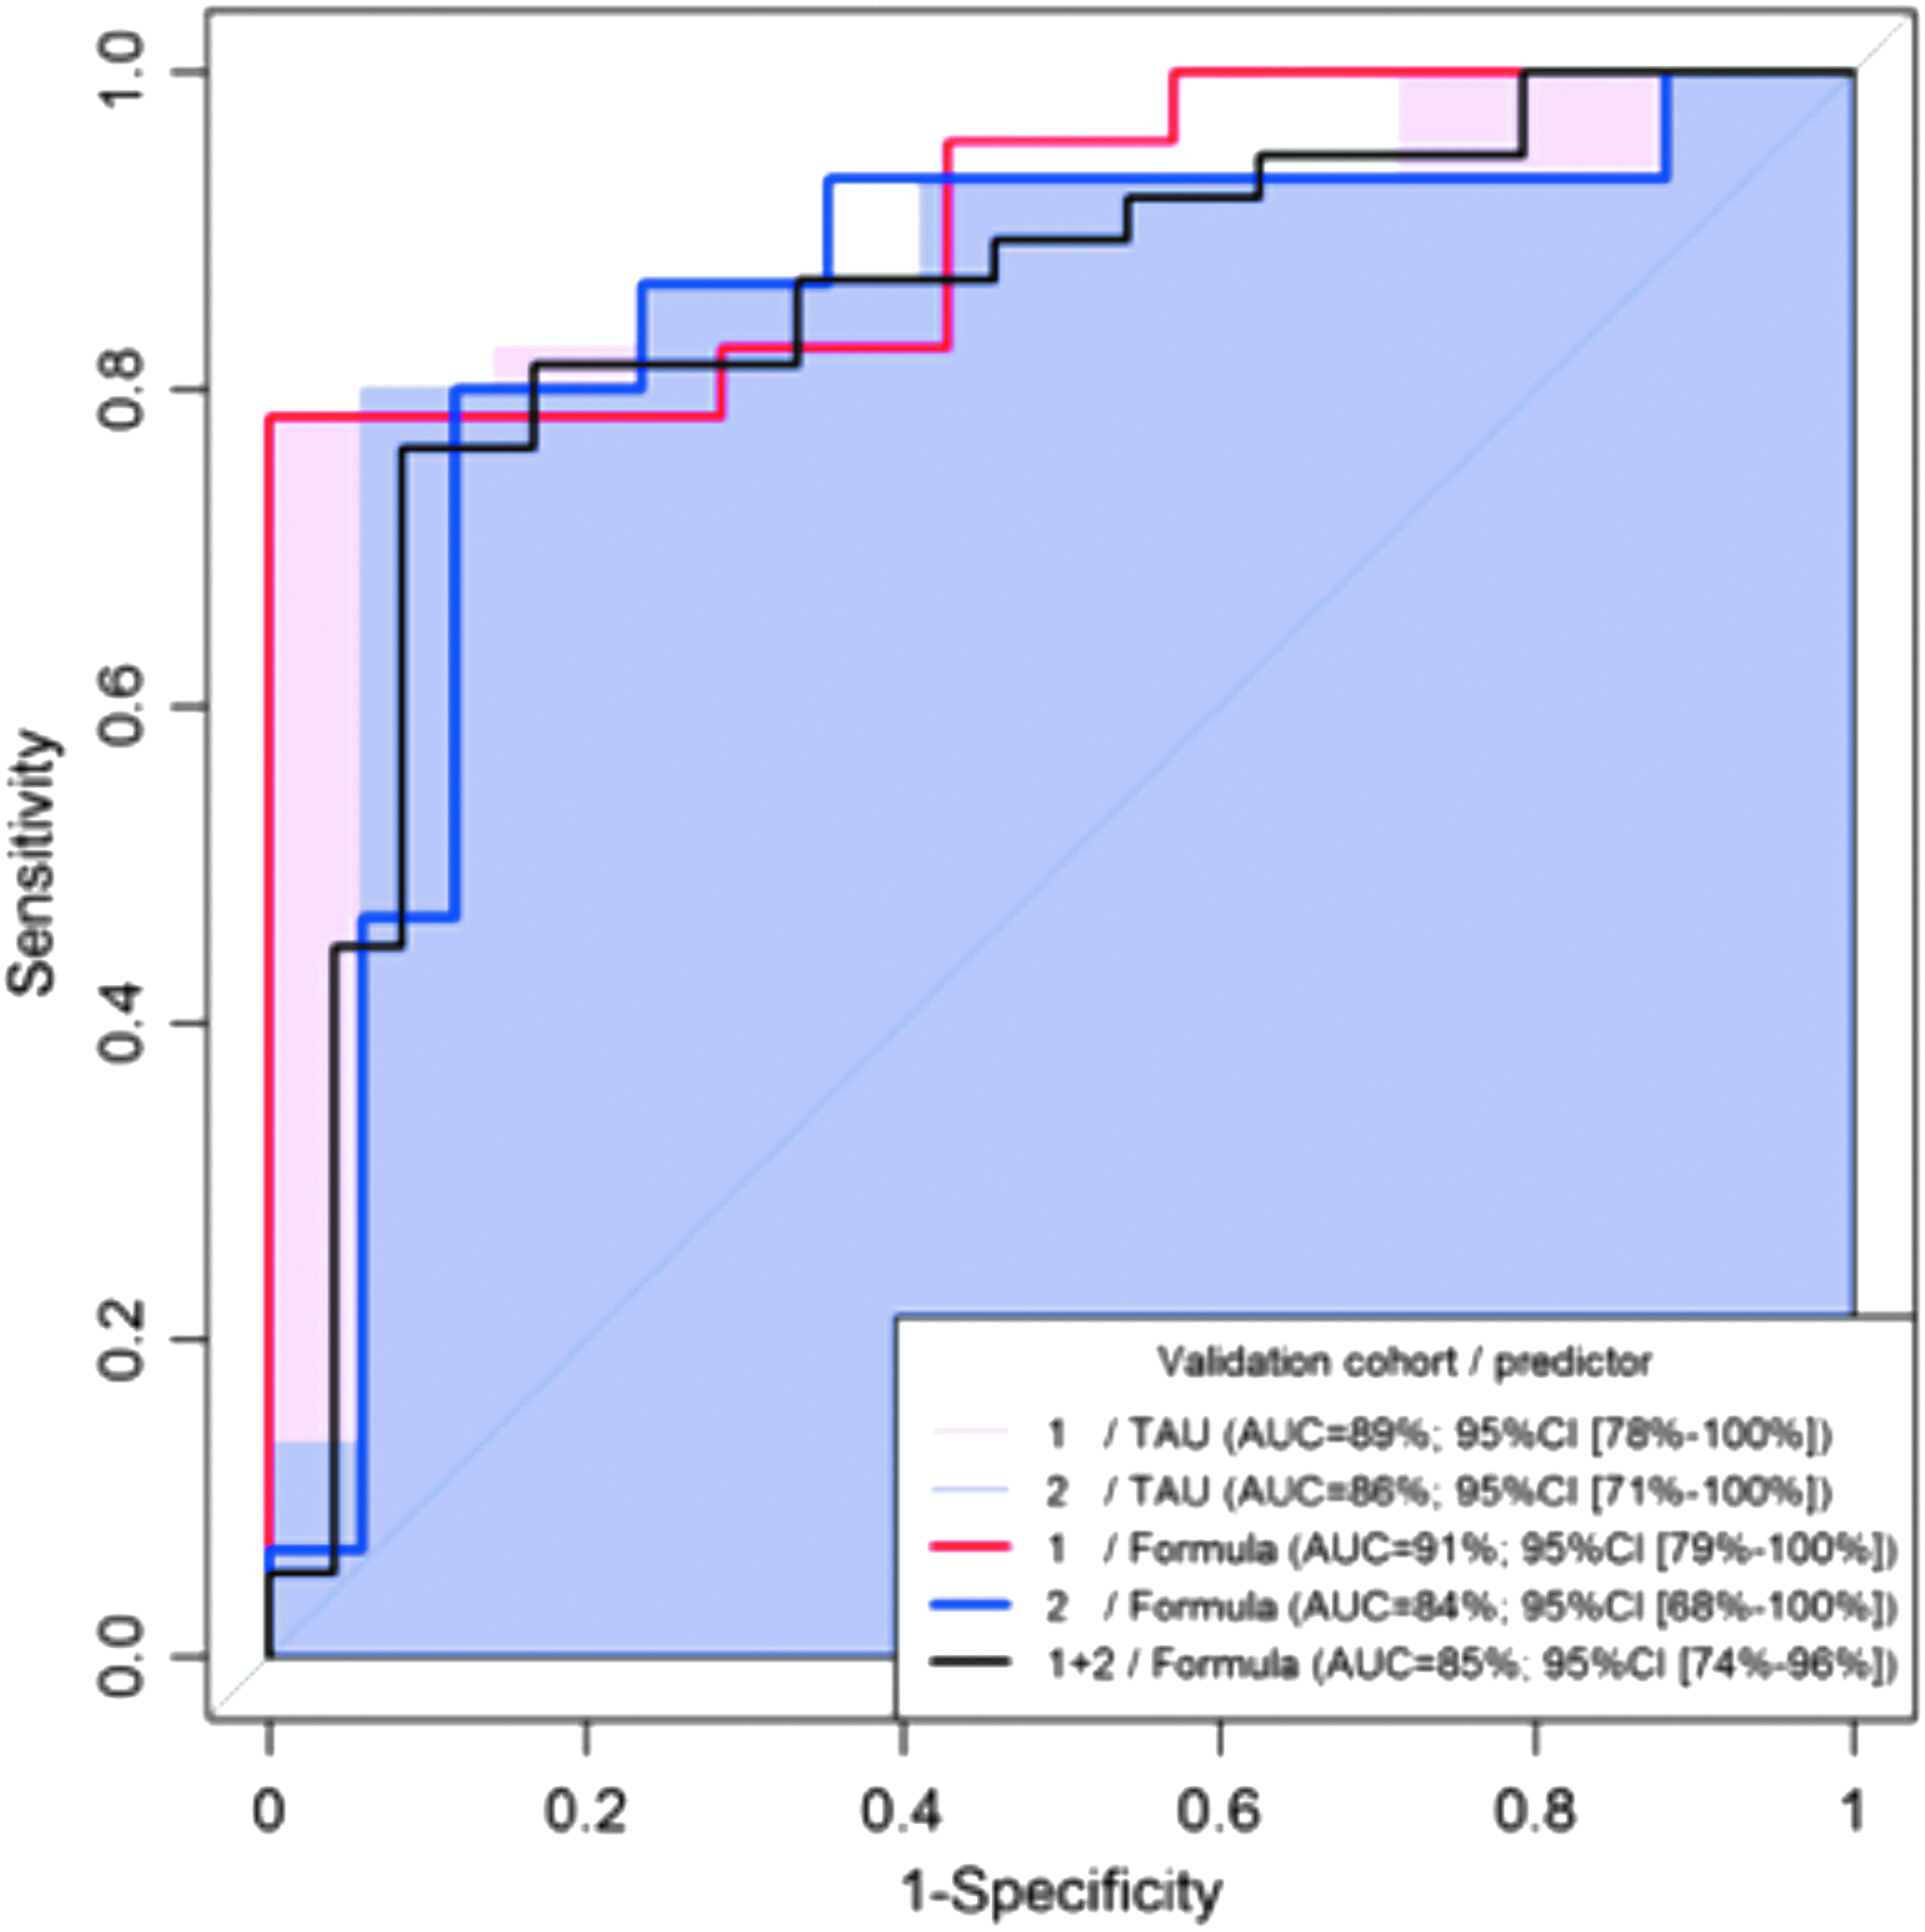
ROC analysis of TAU and the Triple-T-formula as QIs in serum samples from validation cohorts 1 and 2. The graph shows five ROCs for sample quality separation with discrimination of TTC ≤60 min/>60 min (gold standard) as well as the estimated AUROCs (with 95% CI) for TAU alone (areas in light red and light blue), and for the application of the Triple-T-formula from Figure 6 (bold lines: red, blue, and black in the combined sample). CI, confidence interval; QI, quality indicator.
Discussion
The lack of standardized preanalytical workflows and standardized quality measurements to test these workflows has a high impact on the properties of blood derivatives and on clinical and other scientific studies. 9 The identification of reliable quality control indicators (QIs), particularly for the characterization of already available biomaterials, has thus been addressed in several studies.10–17 However, the proposed QIs are still not routinely employed in biobanking workflows, most likely due to their uncertain applicability in different disease areas. In this study, we describe a new metabolite-based QI tool and provide evidence on its applicability both in healthy individuals and diseased patients.
Our results demonstrate that TAU levels increase in serum, but not in plasma samples, with prolongation of the precentrifugation delay. This increase is dependent on time, the preanalytical handling temperature, and the platelet count and volume. Moreover, based on TAU cutoffs and the developed Triple-T-cutoff-model, we can discriminate serum samples with different precentrifugation delays (TTC ≤60 min/>60 min) from healthy individuals as well as selected rheumatologic/cardiologic patient collectives with high sensitivity and specificity.
It is well known that TAU (2-aminoethanesulfonic acid), as a sulfur-containing conditionally essential, nonprotein amino acid, is the most abundant free amino acid in humans 18 and plays a major role in the development of the central nervous, cardiovascular, renal, reproductive, and immune systems. 19 Circulating TAU accumulates in human blood cells, particularly platelets and leukocytes.20,21 The TAU levels in platelets are ∼400 times higher than those in plasma, as a result of (1) high transfer rates, higher than for any other amino acid22,23 and (2) TAU synthesis by platelets themselves, with cysteine as a precursor.23,24
Periayah et al. describe platelet activation and aggregation as central components of the coagulation cascade, in which platelets disintegrate, change their shape into a pseudopodal form, and release their granule content. 25 Since our results indicate TTC-dependent TAU increases in human serum, but not in plasma, it can be assumed that TAU release is mediated by platelet activation during the coagulation process. 25 However, platelet activation, as indicated by an increase in PF4 and TSP-1, has been also observed in EDTA samples that, in contrast to our study, have been exposed to additional mechanical and thermal stresses (second centrifugation step at 10,000 × g and 4°C). 26 It is unclear if these conditions might also lead to TAU release and, thus, we can only speculate whether TAU—beyond serum samples—can also be applied as QI in the preparation of platelet-free plasma.
Our results are in full agreement with recently published data by Kamlage et al. showing an increase in TAU in serum samples with a precentrifugation delay of 6 hours without any effect in EDTA-plasma samples within a TTC range of 4–8 hours. 8
Moreover, further evidence of platelets being the major source of TAU release is underscored by the observation that individuals with low platelet volumes (platelet count and MPV) have lower TAU concentrations during precentrifugation delays compared to individuals with high platelet volumes. Total platelet volume was therefore considered in the Triple-T-cutoff-model. However, including total platelet volume requires simultaneous monitoring of hematological data in parallel to the collection of biomaterial, which is a drawback for most historical biospecimen in which these data are not readily available.
To address the TTC-thrombocyte-TAU concentration interdependency, a mathematical model (TTT-cutoff-model) was developed to provide a probability calculation tool for the discrimination of high TTC (TTC >60 minutes) from low TTC serum specimens. Application of this model with a median cutoff (160 μmol taurine/L), established in healthy volunteers (test cohort 1; n = 23), confirmed the validity of TAU as a TTC classifier in a further healthy cohort (test cohort 2; n = 5), and in two independent patient collectives (validation cohorts 1 and 2; i.e., in n = 30 rheumatologic and n = 32 cardiologic patients). In cardiologic patients, application of the median TAU cutoff derived from healthy individuals was particularly useful for the discrimination of low TTC samples (TTC ≤60 minutes). This result might be explained by the overall slightly lower TAU level in these patients compared to the other cohorts investigated. According to Aquilani et al., TAU levels are reduced in patients with chronic heart failure. This reduction might originate from increased amino acid consumption, altered remodeling processes, and/or inadequate protein energy intake. 27 In addition, attenuation of oxidative stress in relevant tissues might lead to decreased TAU levels in serum. 28
The specificity of TAU as an indicator of the precentrifugation time delay in cardiologic patients was not affected when using a disease-specific TAU cutoff level instead of the median TAU cutoff derived from healthy individuals. These results indicate that both QIs (median TAU cutoff and TTT-cutoff-model) are applicable as classifiers for samples with different precentrifugation delays (TTC ≤60 min/>60 min), with a high sensitivity and specificity in healthy as well as diseased individuals. However, individual characteristics of different disease entities, particularly cardiologic diseases, should be taken into account in future studies, aiming at the identification of cohort-/disease-specific TAU cutoff levels.
The TTC is the most critical preanalytical variable due to metabolic activities and the compounds released from cellular components. 29 In agreement with this assumption, we only observed a slight increase in TAU levels when a TTC of 23 hours was combined with a TTF of 48 hours compared to a TTC of 23 hours without a prolongation of the TTF. This result indicates the specificity of TAU as a TTC indicator.
Previous studies have demonstrated a weaker impact on metabolic profiles at cooled sample handling conditions,6,30 mainly due to the lower enzyme kinetics. 13 TAU is a temperature-sensitive QI that specifically indicates unfavorable sample handling conditions at RT. TAU release from thrombocytes might be compromised, probably due to impairment of the coagulation process at lower temperatures. This fits perfectly with the recommendations for preanalytical handling of human liquid biosamples under cooled conditions (4°C) to avoid cellular metabolic activities.7,13,29,31 However, particularly under cooled conditions, complete coagulation of serum samples has to be assured to avoid subsequent coagulation at a later time point.
It is well known that metabolic profiles are influenced by the nutritional status. 29 Concerning possible interindividual differences in TAU concentrations, TAU levels are mainly influenced by nutritional uptake, for example, by consumption of meat, seafood, or dietary products.32,33 However, findings of Breier et al. demonstrated low intraindividual and interindividual coefficients of variation for TAU serum levels. 30
A limitation of this work is the low median age of healthy individuals analyzed in the frame of our study since it is well known that aging is often accompanied by a decrease in platelet count 34 as well as decreased TAU concentrations. 35 Thus, another reason for the lower TAU cutoff in our cardiologic patient collective, in addition to the abovementioned reasons, may be the higher median age compared to our studied cohorts of healthy individuals. Further studies with larger patient collectives of various ages are necessary to analyze whether age-adjusted TAU cutoff values need to be applied in samples originating from older individuals/patients.
Moreover, to prove the robustness of TAU as a QI, validation of our results in larger collectives of healthy individuals and of patients with different diseases must be performed, preferentially in combination with further preanalytical factors, for example, different serum collection tubes, time point of blood sampling (circadian rhythms), therapeutic interventions, for example, administration of certain drugs, freeze-thaw cycles, and so on. To this end, a pilot ring trial within the BMBF-funded German Biobank Alliance (GBA) is currently under way.
This pilot study compared and successfully applied both TAU serum levels and a Triple-T-model as QIs for RT precentrifugation delays of more than 60 minutes in serum samples of healthy individuals and selected rheumatologic and cardiologic patient collectives. Both QIs must be validated in larger independent cohorts and in a wider range of disease entities before their application as routine QI tool to support the use of high-qualitative serum specimens in biomedical research.
Footnotes
Acknowledgments
The authors thank Dr. S. Bremer-Streck, Dr. N. Blaurock, and S. Hein, B. Preuschaft for their technical support in the amino acid measurements. We also thank S. Reformat, C. Heinemann, C. Richert, J. Köhler (Integrated Biobank Jena, IBBJ), and K. Stötzer (Integrated Biobank Jena, IBBJ) for their excellent technical assistance at the Department of Clinical Chemistry and Laboratory Medicine of the Jena University Hospital. We are grateful to Dr. M. Keipes (ZithaGesondheetsZentrum) for helping collect samples in Luxembourg. In addition, we thank Dr. S. Bornmann and S. Heller from the occupational health service of the Jena University Hospital, Dr. B. Heymel and A. Steiner from the Department of Internal Medicine III, Jena University Hospital, and Dr. B. Betz from the Institute of Clinical Chemistry and Laboratory Diagnostics of the Jena University Hospital for their kind support in blood sample collection. We are grateful to all the study participants for their valuable contribution.
Funding
This work was funded by the German Ministry of Education and Research (BMBF No. 01EK1505B) and supported by the Integrated Research and Treatment Center and Center for Sepsis Control and Care (CSCC) at the Jena University Hospital funded by the German Ministry of Education and Research (BMBF No. 01EO1502). André Scherag also received funding from BMBF No. 01ZZ1803C. The Interdisciplinary Bank of Biomaterials and Data Würzburg (ibdw) currently receives funding from BMBF (No. 01EY1712) and from the Interdisciplinary Center for Clinical Research Würzburg (IZKF No. Z-9).
Authors' Contributions
Study conception and design: N.S., N.K., F.B., R.J., T.I., A.S., and M.K.; data interpretation: N.S., N.K., M.R., F.B., A.S., and M.K.; contribution of samples and demographic as well as clinical data: N.S., N.K, M.R., J.G., R.J., N.Kl., T.I., C.M., and F.B.; sample and data analysis: S.N., N.S., and N.K.; supervision of the study: A.S. and M.K.; drafting of the article: N.S., N.K., A.S., and M.K.; critical revision and final approval of the article: N.S., N.K., M.R., J.G., R.J., N.Kl., T.I., C.M., F.B., A.S., and M.K.
Data Availability Statement
All data generated during this study are available from N.K. (email: nadine.knutti@med.uni-jena.de).
Author Disclosure Statement
No conflicting financial interests exist.
References
Supplementary Material
Please find the following supplemental material available below.
For Open Access articles published under a Creative Commons License, all supplemental material carries the same license as the article it is associated with.
For non-Open Access articles published, all supplemental material carries a non-exclusive license, and permission requests for re-use of supplemental material or any part of supplemental material shall be sent directly to the copyright owner as specified in the copyright notice associated with the article.