
Abstract
Cell-free DNA (cfDNA) has become a promising noninvasive clinical marker widely studied in early disease detection, monitoring, and therapy selection. However, there is lack of data on a number of cfDNA-associated procedural features such as blood plasma biobanking conditions, isolation, and quantification methods that should be taken into account as they can affect downstream applications. In this study cfDNA from 125 plasma samples from healthy individuals were isolated using three different commercial kits (bead and vacuum based). Yield of cfDNA, distribution of cfDNA fragments and absolute amount of miR-223 were estimated. Moreover, the impact of different plasma biobanking conditions and hemolytic plasma were evaluated. In conclusion, results showed that quantification method (fluorescence or microcapillary electrophoresis based) has a major impact in estimating cfDNA amount. Samples isolated by QIAamp showed a higher amount of larger (around 300 bp) DNA fragments and miRNA yield, suggesting possible applications for multiomics approach. On the other hand, the highest cfDNA yield was obtained in samples isolated by the MagMAX Isolation Kit. This kit also showed lowest coefficient of variation and low miRNA yield. Plasma storage conditions and hemolysis affected performance of isolation kits differently.
Introduction
Cell-free DNA (cfDNA) is released into the blood stream in various ways, including at the death of cells or by active secretion. 1 cfDNA molecules are small with a major peak at 160–180 bp. 2 Increased levels of cfDNA can be detected in various physiological and pathological conditions. 3 Analysis of cfDNA in the blood of cancer patients showed a strong correlation between cfDNA amount and tumor size, burden, and metastasis status. It was also shown that cfDNA could be a powerful disease state and relapse monitoring analyte.1,4–6
New minimally invasive diagnostic procedures for circulating molecules are in demand because standard diagnostics are not able to analyze the cancer mutation profile changes over the course of treatment. Apart from cancer mutation monitoring, circulating nucleic acids could be used for multiomic analysis comprising genomic and epigenetic (miRNA) alterations for various pathological conditions. Therefore, blood plasma is a compelling source for liquid biopsies and there is a high interest among the medical and biobanking communities for liquid biopsy diagnostics and disease monitoring. However, there is currently a lack of scientific reports on standardized procedures for plasma storage conditions, handling of hemolyzed plasma, quantification and cfDNA isolation methods, and a lack of reports on analyzing both circulating DNA and miRNA yields.
Previous studies analyzed the impact of stabilizing agents (specifically for cfDNA and routinely used stabilizers [EDTA, heparin, etc.]),7–11 the time elapsed between blood collection and centrifugation,9,11,12 different centrifugation profiles, and isolation kits.8,11,13,14 In the study we present here, we evaluated differences between two quantification methods and three cfDNA isolation kits. Additionally, we analyzed whether plasma storage conditions and hemolysis affect the amount of isolated cfDNA. The key metrics in our analyses were the yields of genomic DNA (gDNA) and miRNA in cfDNA samples and the size distribution of smaller and larger cfDNA fragments between different kits. The isolation kits were selected to compare the performance of different methods (bead and vacuum based).
To our knowledge this is the first study in which the discrepancy between cfDNA quantification methods, the impact of hemolysis on cfDNA amount, and the amount of miRNA in cfDNA samples (multiomics approach) were evaluated.
Materials and Methods
The study was approved by the Kaunas Regional Biomedical Research Ethics Committee (No. Nr. BE-2-10). Informed consent was obtained from all study participants.
Blood collection, plasma storage, and hemolysis induction
Blood was collected by standard phlebotomy techniques in BD Vacutainer K2EDTA tubes (10 mL, 366643) at two time points during the period of the study. For studying the influence of plasma freeze–thaw cycles, our experiment was repeated on two separate days for the same volunteers (age range of subjects were 22–25 years) and set up as follows (see Fig. 1, left half): three blood tubes were collected from five self-reported healthy volunteers (one male and four females). Blood was processed immediately after blood draw to avoid confounding effects.
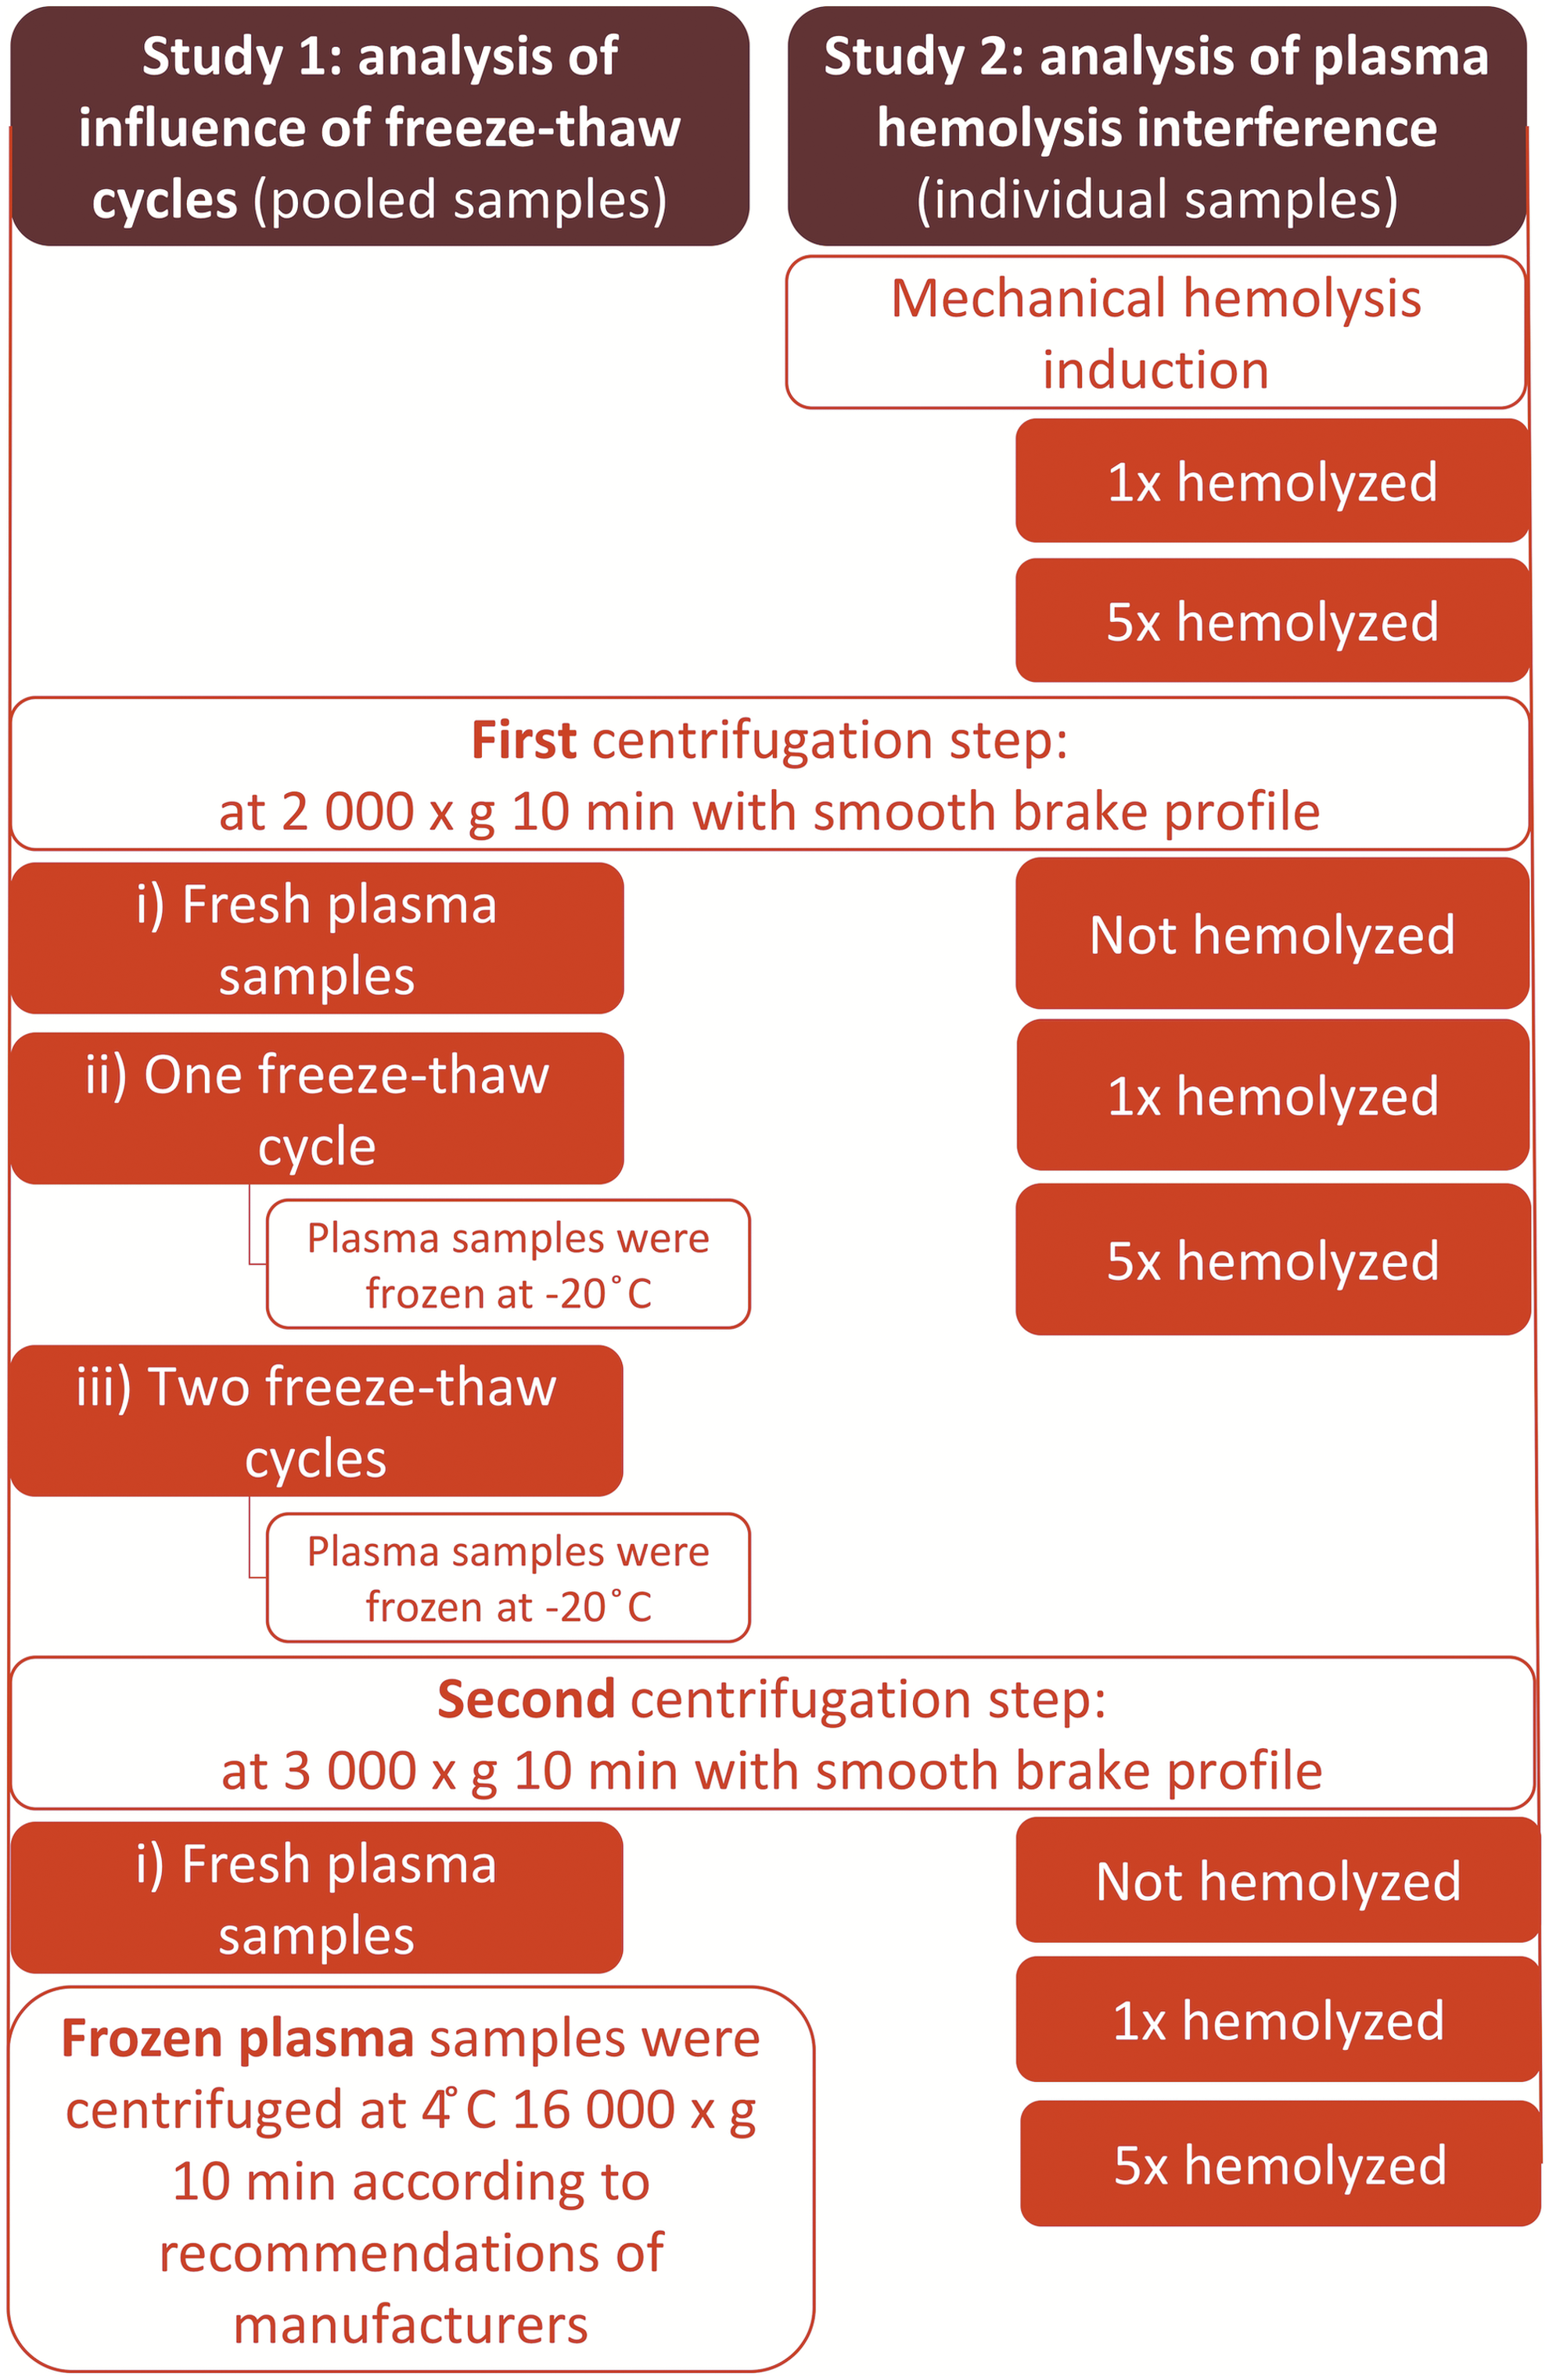
Flow of samples preparation. Study 1: pooled samples from five healthy volunteers; Study 2: individual samples from one healthy volunteer. Left half: equal volumes of each participant's plasma were pooled and divided into three groups: (i) fresh plasma, (ii) one freeze–thaw cycle, and (iii) two freeze–thaw cycles. The blood tubes were first centrifuged at room temperature at 2000 × g for 10 minutes. Then fresh plasma aliquots from group (i) were centrifuged again at 3000 × g for 10 minutes. The aliquots from group (ii) (one freeze–thaw cycle) and group (iii) (two freeze–thaw cycles) were frozen at −20°C after just one blood centrifugation. The aliquots from group (iii) (two freeze–thaw cycles) were then completely thawed at room temperature and frozen at −20°C once again. All frozen plasma samples were centrifuged before cfDNA isolation procedures at 4°C at 16,000 × g for 10 minutes. The plasma storage experiment was repeated in another two replicates. Right half: Three blood tubes were drawn from a healthy proband. The first tube of nonhemolyzed blood was centrifuged at room temperature at 2000 × g for 10 minutes and then at 3000 × g for 10 minutes. Hemolysis was induced mechanically on the remaining two blood tubes: one and five draws through the needle were performed. The hemolysis experiment was repeated in another three replicates. cfDNA, cell-free DNA.
Tubes were centrifuged at room temperature at 2000 × g for 10 minutes with smooth brake profile to prevent disruption of the buffy coat layer. Equal volumes (6 mL) of each participant's plasma were pooled and divided into three groups: (i) fresh plasma, (ii) one freeze–thaw cycle, and (iii) two freeze–thaw cycles.
The fresh plasma aliquots from group (i) were centrifuged again at 3000 × g for 10 minutes with smooth brake profile according to the recommendations from previous studies.7,9 The aliquots from group (ii) (one freeze–thaw cycle) and group (iii) (two freeze–thaw cycles) were frozen at −20°C after just one blood centrifugation. The aliquots from group (iii) (two freeze–thaw cycles) were then completely thawed at room temperature and frozen at −20°C once again. All frozen plasma samples were centrifuged before cfDNA isolation procedures at 4°C at 16,000 × g for 10 minutes according to the isolation kit manufacturer's recommendations.
For studying the influence of hemolysis, our experiment was repeated on two separate days for the same volunteer and set up as follows (see Fig. 1, right half): three tubes of blood were collected from one healthy volunteer. Of these tubes, one nonhemolyzed blood tube was centrifuged at room temperature at 2000 × g for 10 minutes with smooth brake profile and then at 3000 × g for 10 minutes with smooth brake profile.
Hemolysis was induced mechanically on the remaining two blood tubes as described by Koseoglu et al. 15 : one and five draws through the needle were performed to obtain moderate and severe hemolysis, respectively. Then blood samples were first centrifuged with smooth brake profile at 2000 × g for 10 minutes and second at 3000 × g for 10 minutes. Finally, plasma samples were aliquoted (2 × 1 mL of plasma for each tested condition: nonhemolyzed, 1 × hemolyzed, and 5 × hemolyzed) and processed further. Hemolysis of blood samples was evaluated spectrophotometrically at 570 nm wavelength using an absorbance microplate reader, Tecan Sunrise 16 (data not shown).
cfDNA isolation
cfDNA was isolated using three commercially available isolation kits. The NextPrep-Mag cfDNA Isolation Kit (Bioo Scientific) and MagMAX Cell-Free DNA Isolation Kit (Thermo Fisher Scientific) are bead based, whereas the QIAamp Circulating Nucleic Acid Kit (Qiagen) is a column-based isolation kit (Table 1). All isolation procedures were done according to the manufacturer's protocols using 1 mL of plasma. To assess exogenous DNA contamination, a water control was included. Purified DNA was either analyzed without delay or stored at +4 until further analysis. Processing time of the cfDNA Isolation Kits was around 45 minutes, 1.5 hours, and 2 hours for NextPrep-Mag, MagMAX, and QIAamp, respectively.
Specifications of Cell-Free DNA Isolation Kits
Price may vary in different countries.
Price for the here tested 1–3 mL kit; the 3–5 mL kit is better value for 5 mL isolations.
cfDNA quantification
cfDNA amount was quantified by two different methods: the Fluorescence-based Qubit dsDNA HS Assay Kit (Thermo Fisher Scientific) and laser-induced fluorescence-based microcapillary electrophoresis, the Agilent High-Sensitivity DNA Kit (Agilent Technologies). Peaks around 180, 350, and 500 bp were considered as mono-, di-, and trinucleosomal fragments, respectively (Fig. 2). Fragments higher than 1000 bases were considered as gDNA. Summary statistics are presented in Table 2.
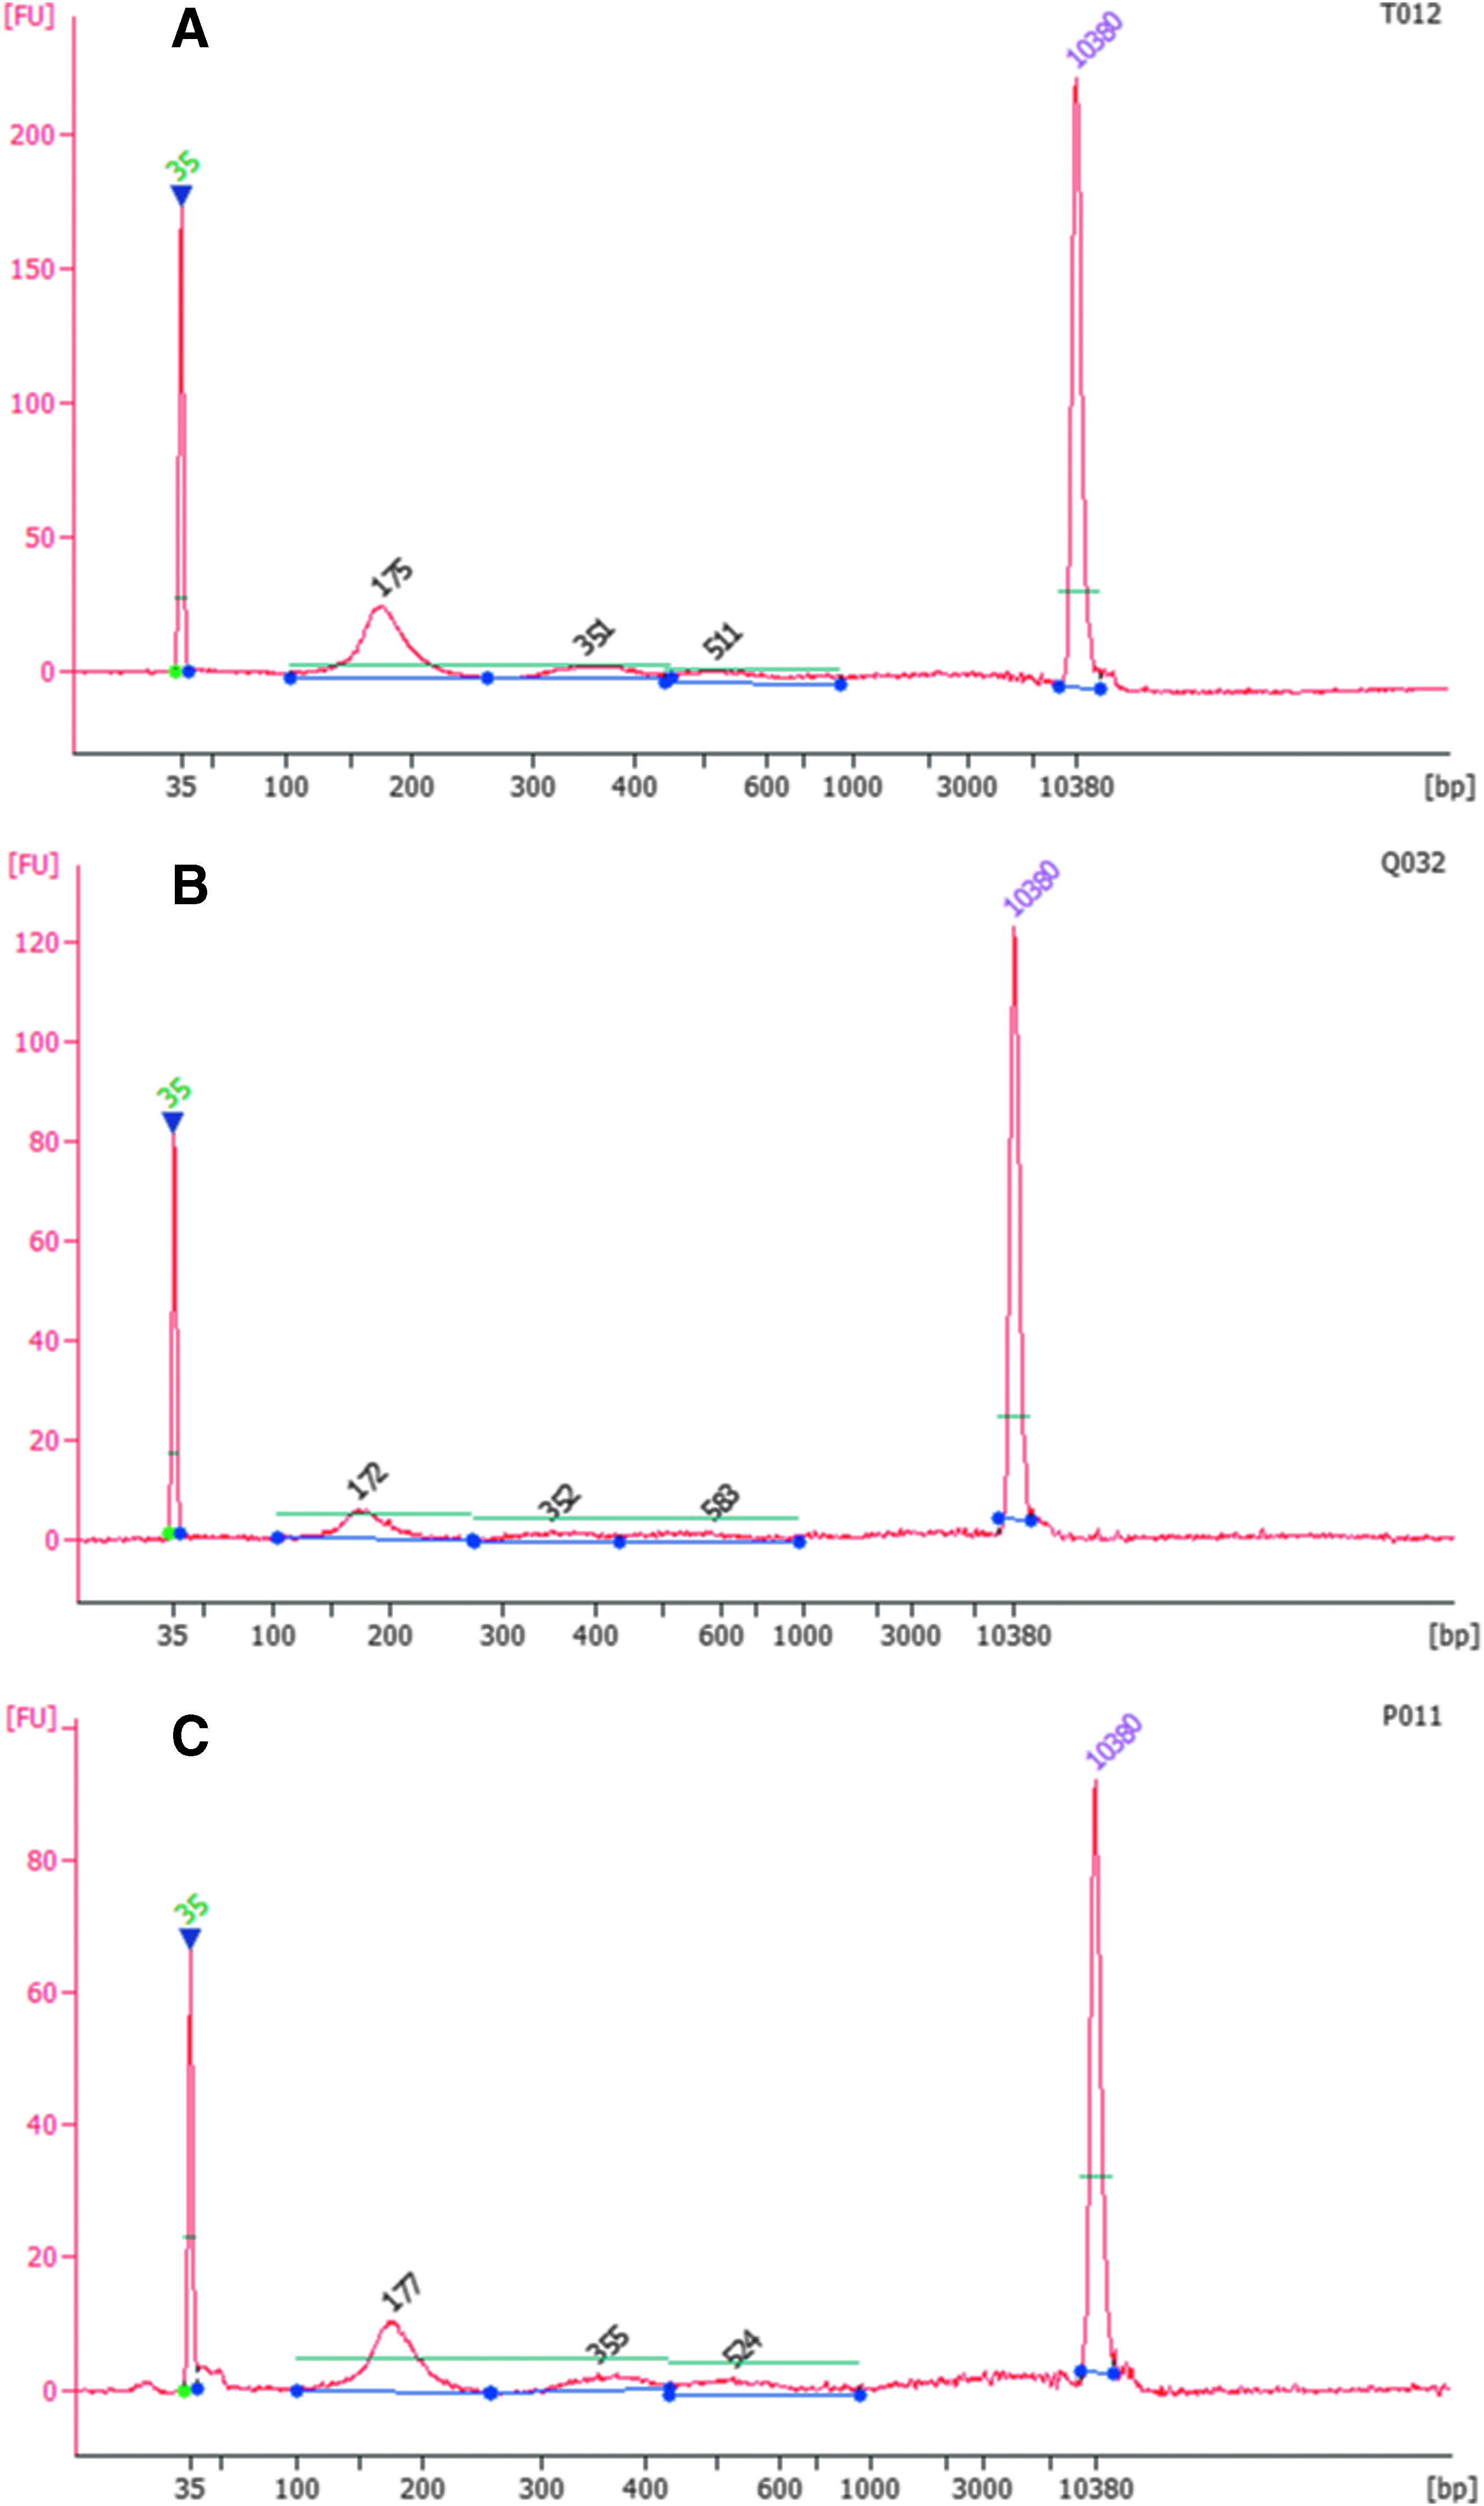
Plasma cfDNA length distributions depending on kit. The figure shows representative Agilent Bioanalyzer 2100 Electropherograms of cfDNA from pooled plasma samples.
Amount of Cell-Free DNA and Genomic DNA Isolated by Different Isolation Kits
cfDNA, cell-free DNA; CV, coefficient of variation; gDNA, genomic DNA.
Absolute miR-223 quantification
The amount of miR-223 in plasma samples was determined using real-time quantitative polymerase chain reaction (RT-qPCR) and TaqMan miRNA Assay primers and probes. RT-qPCR was carried out on Applied Biosystems 7500 Fast Thermocycler using the manufacturer's recommended cycling conditions. Absolute quantification was performed using qPCR standard curves generated with synthetic single-stranded RNA nucleotides corresponding to the mature miR-223 sequence (miRbase Release v.22). The synthetic miRNA was first reverse transcribed to generate standard curves, then the miRNA amount in pg per 1 mL of plasma was evaluated according to the CT value in each sample.
Statistical analysis
Statistical analysis was performed using R Studio software (R version 3.3.3). Data are presented as mean ± standard deviation and considered significant when p is less than 0.05. Two-sided T-test or Mann–Whitney U test were used. Data distribution was determined by the Kolmogorov–Smirnov (K–S) test, which was used to determine whether the data distribution was normal or non-normal. The T-test was used to determine significance of difference between data with normal distribution. The Mann–Whitney U test was used for significance of difference between data with non-normal distribution.
Results
Amount of cfDNA varies greatly depending on quantification method
First, our study determined whether there are differences between values obtained by fluorescence-based and laser-induced fluorescence-based microcapillary electrophoresis methods (Qubit and Agilent, respectively) for all samples of the study (n = 125). Interestingly, values obtained by the two different methods differed significantly (on average Qubit: 7.11 ± 3.24 ng/mL of plasma; Agilent: 4.06 ± 1.55 ng/mL of plasma; Mann–Whitney U test, p = 1.86 × 10⁻²¹). Accordingly, comparing different kits, differences in the amount of cfDNA were significant only on the basis of the Qubit quantification method (Fig. 3): the amount of cfDNA isolated by QIAamp was significantly greater (9.49 ± 4.02 ng/mL of plasma) compared with the NextPrep-Mag (5.74 ± 1.57 ng/mL of plasma) and MagMAX (6.06 ± 2.08 ng/mL of plasma) Isolation Kits (Mann–Whitney U test, p = 1.62 × 10⁻⁷; p = 1.16 × 10⁻⁶, respectively).
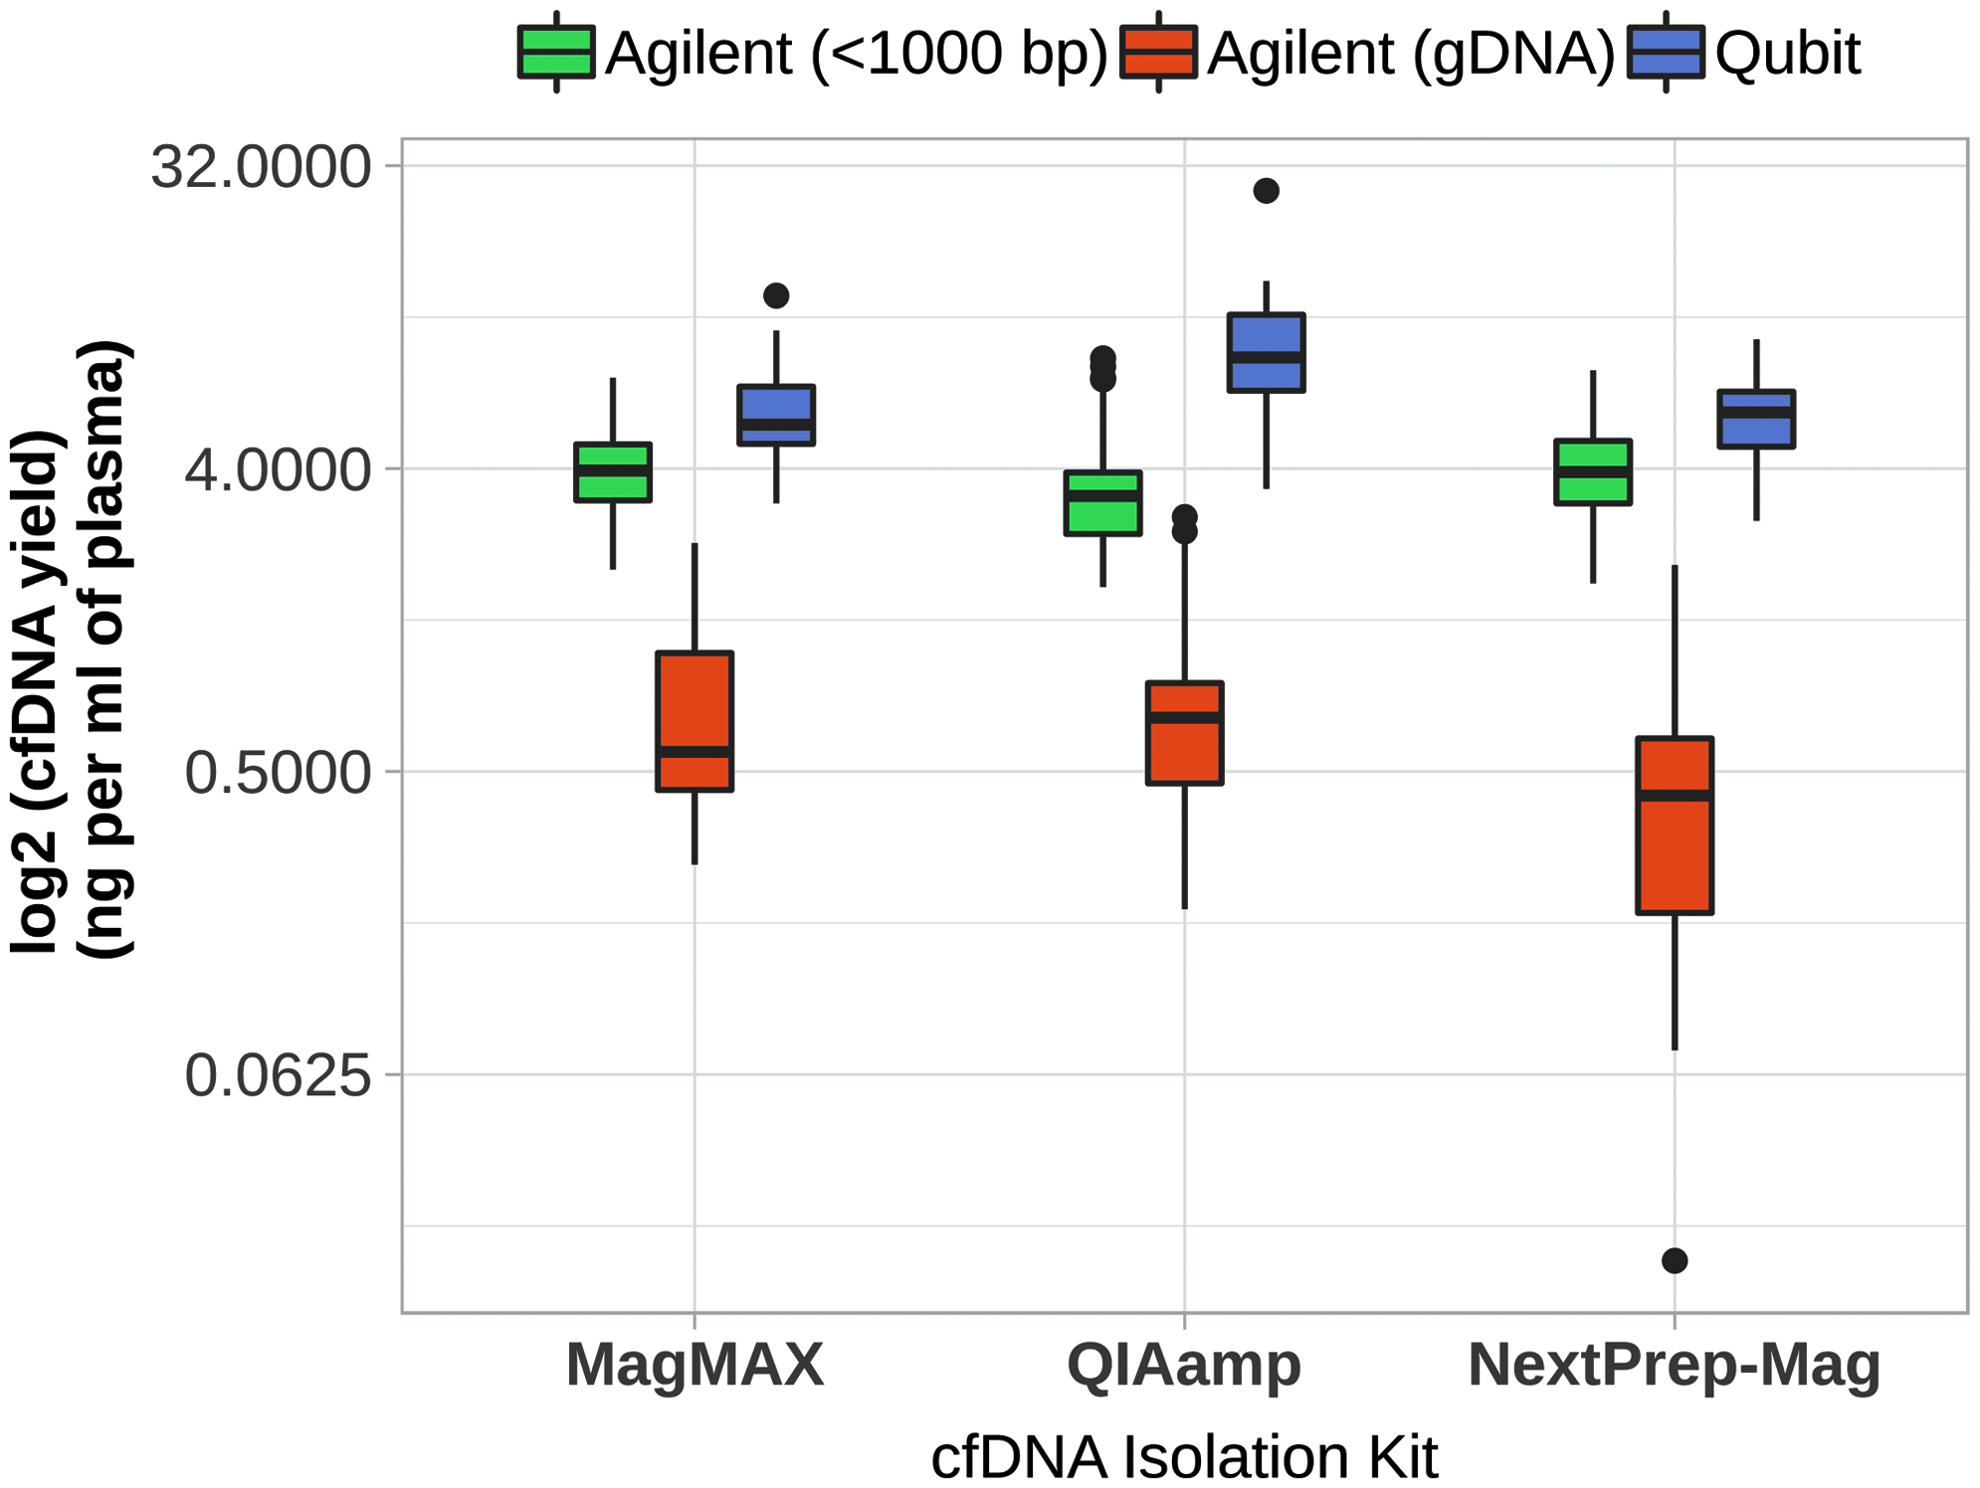
Amount of cfDNA isolated by different kits and quantified by different methods. Yield of cfDNA in all plasma samples (Study 1 and Study 2 samples) analyzed in the study. Based on Qubit quantification, a significantly higher amount of cfDNA was isolated with QIAamp. Based on Agilent quantification, no statistical significance was determined between the cfDNA yields of different isolation kits. The amount of gDNA was higher in isolations by QIAamp and MagMAX than by NextPrep. Boxes represent interquartile range, from the bottom: 25th percentile, 50th percentile, and 75th percentile. Whiskers—largest and smallest value within 1.5 times interquartile range. Dots represent outside values—>1.5 times and <3 times interquartile range beyond either end of the box.
Conversely, according to the Agilent quantification method, there were no significant differences between the amounts of cfDNA isolated with different isolation kits (Fig. 3). The discrepancy between quantification methods may be explained by the lack of specificity for cfDNA in fluorescence-based methods, as not only cfDNA fragments are quantified. Carrier RNA (cRNA) is present in QIAamp isolations, which could interfere with the signal. Therefore, all further comparisons were based on quantifications by the Agilent method. The coefficient of variation (CV) of cfDNA yield in aliquoted pooled samples quantified by Qubit and Agilent isolated by NextPrep-Mag were—12.32% and 30.05%, MagMAX—11.68% and 14.12%, and QIAamp—14.91% and 26.30%, respectively (Table 2).
Plasma biobanking conditions and hemolysis affected performance of cfDNA isolation kits differently
We have evaluated how freeze–thaw cycles and different grades of hemolytic plasma could affect amount of cfDNA and gDNA. Samples of Study 1 (analysis of influence of freeze–thaw cycles) were pooled aliquoted samples (n = 89) and samples of Study 2 (analysis of hemolytic plasma interference) were individual aliquoted samples (n = 36). Only samples isolated by the QIAamp Kit showed significant changes in cfDNA yield concerning plasma biobanking conditions: the amounts of cfDNA in fresh plasma samples (2.46 ± 0.61 ng/mL of plasma), in samples after one freeze–thaw cycle (3.15 ± 0.55 ng/mL of plasma) and in samples after two freeze–thaw cycles (3.11 ± 0.63 ng/mL of plasma) showed a significant increase in cfDNA yield (T-test, p = 0.016 and p = 0.031, respectively) (Fig. 4).
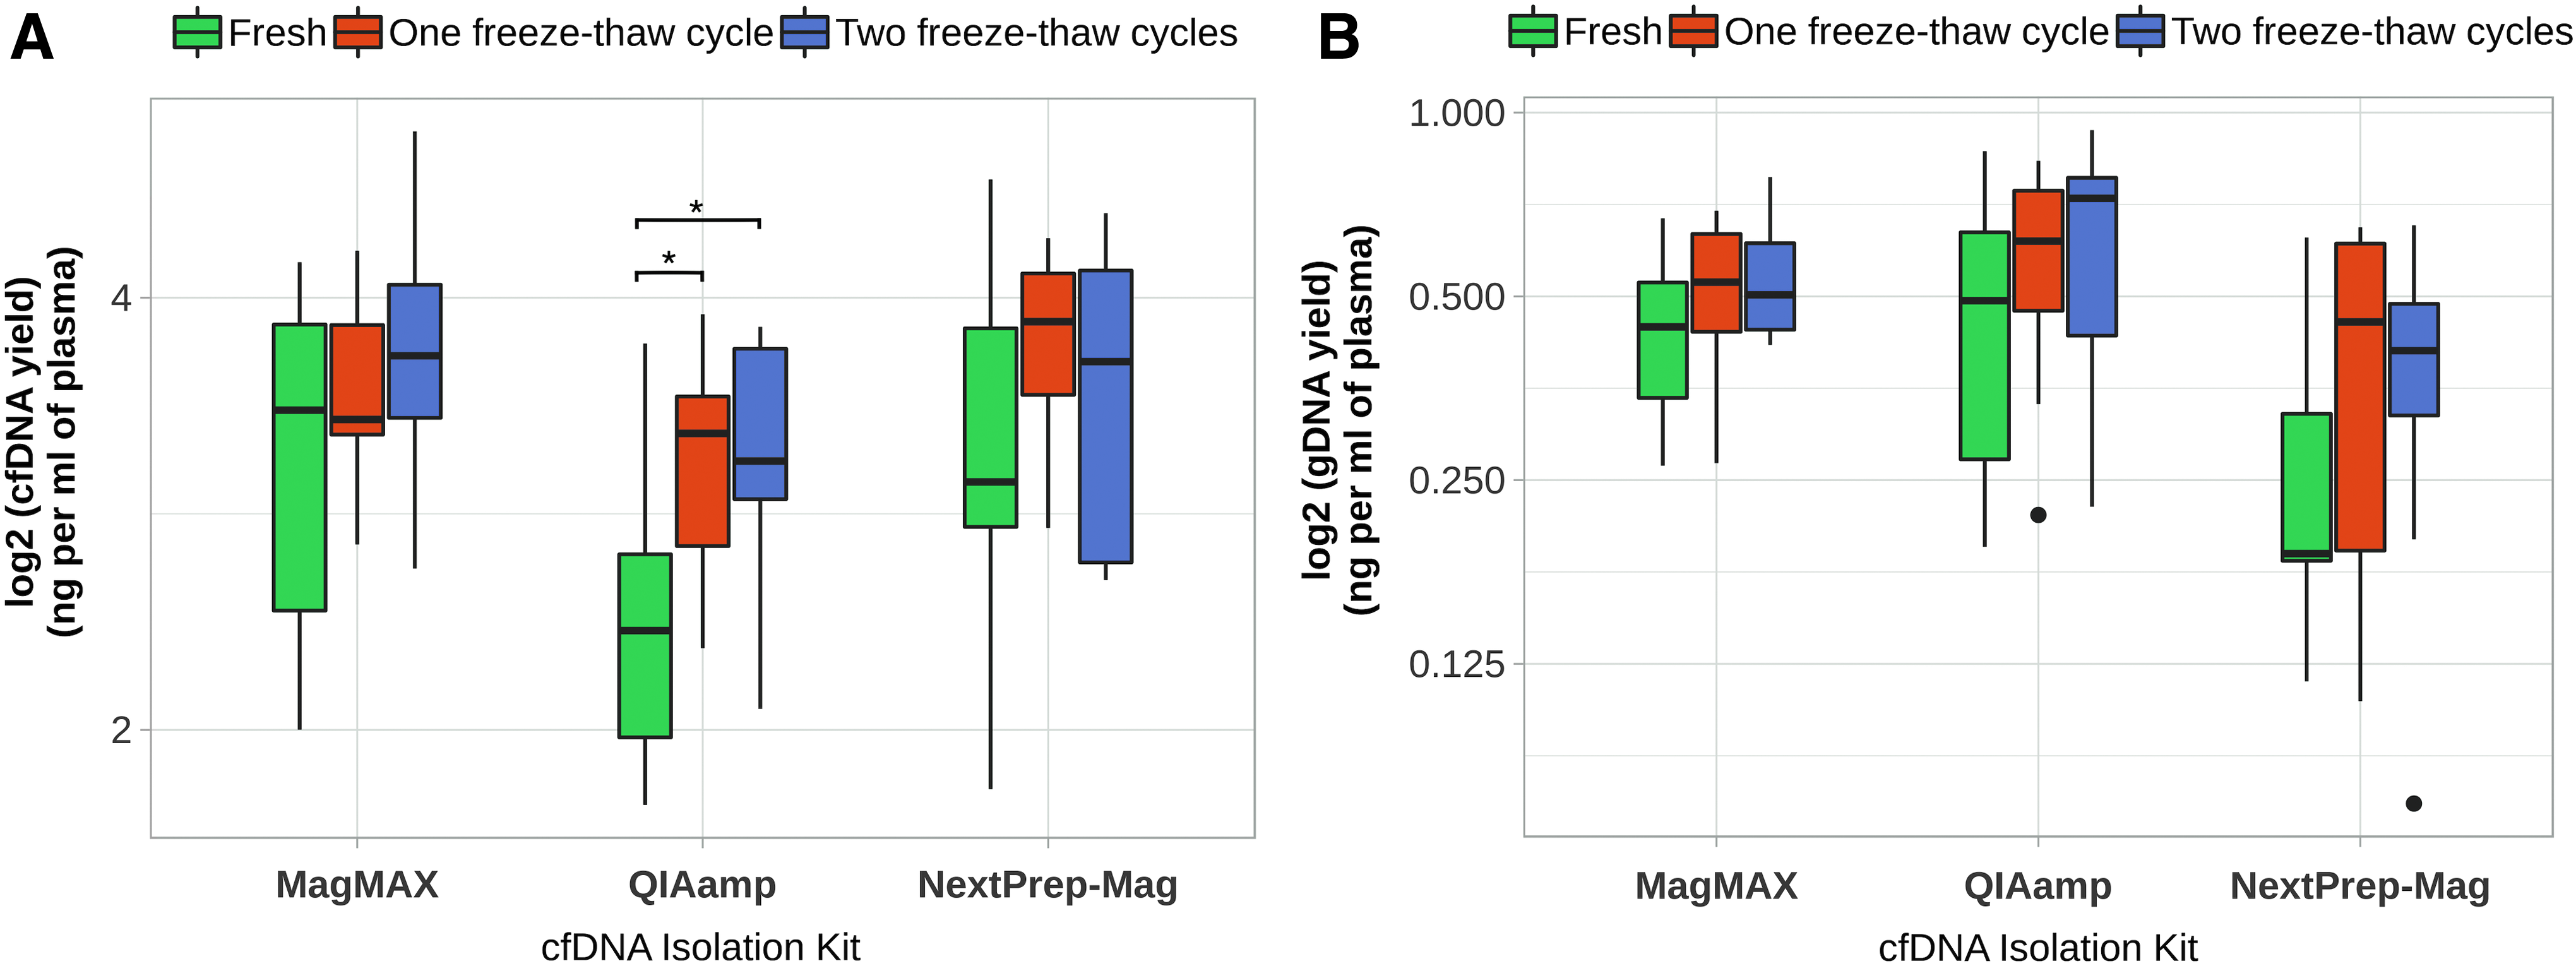
Distribution of cfDNA amount according to different plasma storage conditions.
No significant differences in cfDNA yield after freeze–thaw cycles were observed in samples isolated by MagMAX and NextPrep-Mag kits. Moreover, no significant differences were seen between the amounts of gDNA from different plasma storage conditions and isolation kits. Comparing nonhemolyzed plasma with moderately or severely hemolyzed plasma samples, no significant differences were determined in the cfDNA amounts in samples isolated by three different kits. However, significant differences were determined for the amounts of gDNA in samples isolated by MagMAX between nonhemolyzed samples and samples with severe hemolysis (1.34 ± 0.18 ng/mL vs. 2.12 ± 0.23 ng/mL of plasma; T-test, p = 0.002) (Fig. 5).
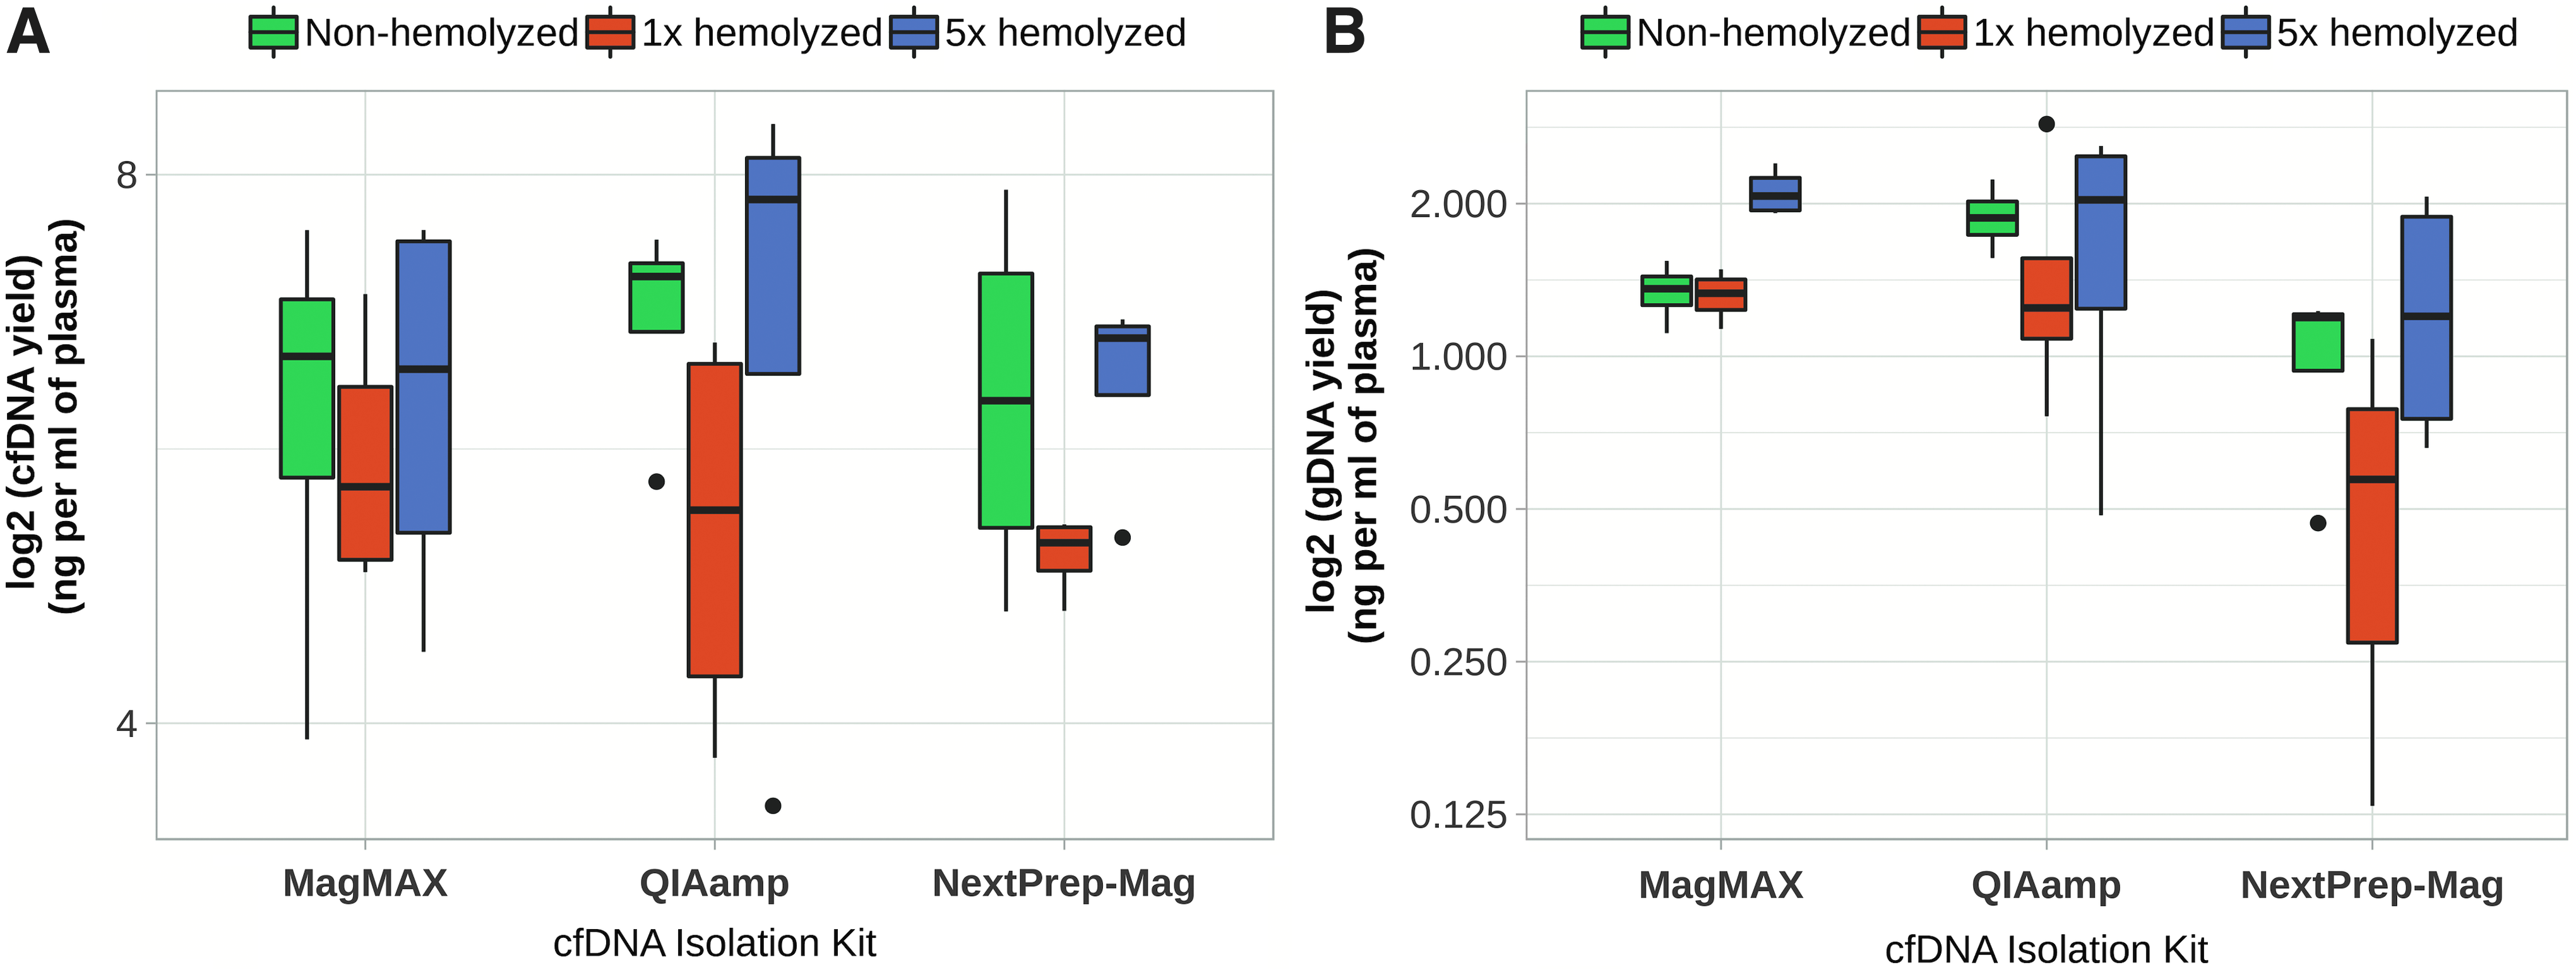
Amount of cfDNA and gDNA in nonhemolyzed and hemolyzed samples.
Amount of gDNA and miRNA in cfDNA samples depends on isolation kit
The amount of co-occurring gDNA and miRNA in the cfDNA isolates is summarized in Figures 3 and 6, respectively. The amount of gDNA was significantly higher for the QIAamp (0.90 ± 0.69 ng/mL of plasma) and MagMAX (0.81 ± 0.56 ng/mL of plasma) Isolation Kits compared with the NextPrep-Mag (0.53 ± 0.45 ng/mL of plasma) Isolation Kit (Mann–Whitney U test, p = 0.001, p = 0.004, respectively) (Fig. 3). miR-223 quantification analysis showed significantly higher amounts of miRNA in samples isolated by QIAamp and NextPrep-Mag (2 × 10⁻³ ± 9 × 10⁻⁴ and 7 × 10⁻³ ± 7 × 10⁻³ pg/1 mL of plasma; T-test, p = 0.003 and p = 0.027, respectively) compared with samples isolated by MagMAX (1 × 10⁻⁴ ± 8 × 10⁻⁵ pg/1 mL of plasma) (Fig. 6).

Amount of miRNA in plasma samples isolated by different kits. Yield of miR-223 in pooled plasma samples (n = 3). Significantly higher amount of miRNA in samples isolated by QIAamp and NextPrep was determined compared with samples isolated by MagMAX. Yields based on qPCR. Boxes represent interquartile range, from the bottom: 25th percentile, 50th percentile, and 75th percentile. Whiskers—largest and smallest value within 1.5 times interquartile range. Dots represent outside values—>1.5 times and <3 times interquartile range beyond either end of the box. qPCR, quantitative polymerase chain reaction.
Distribution of cfDNA fragment lengths varies depending on isolation kit and also could be affected by plasma storage conditions
The cfDNA length distributions depending on kit are shown in Figure 2. These length distributions show three peaks that we interpreted to be mono-, di-, and trinucleosomal cfDNA fragments. Comparing performance of the different isolation kits, fresh plasma samples were analyzed (n = 29); while comparing plasma storage conditions—fresh plasma samples and samples after one or two freeze–thaw cycles were analyzed (n = 89). A higher amount of mononucleosomal fragments was determined in samples isolated by NextPrep-Mag (2.78 ± 0.97 ng/mL of plasma) and MagMAX (2.89 ± 1.04 ng/mL of plasma) Isolation Kits than in samples isolated by QIAamp (2.09 ± 1.07 ng/mL of plasma; Mann–Whitney U test, p = 0.0003 and p = 8.22 × 10⁻⁵, respectively).
On the other hand, samples isolated by QIAamp showed a higher amount of dinucleosomal fragments (0.94 ± 0.46 ng/mL of plasma) compared with NextPrep-Mag (0.67 ± 0.28 ng/mL of plasma) and MagMAX (0.66 ± 0.31 ng/mL of plasma) (Mann–Whitney U test, p = 0.002 and p = 0.001, respectively). Samples isolated by QIAamp also showed a higher amount of trinucleosomal fragments compared with samples isolated by MagMAX (0.85 ± 0.52 ng/mL of plasma and 0.59 ± 0.23 ng/mL of plasma respectively; Mann–Whitney U test, p = 0.008) (Fig. 7).
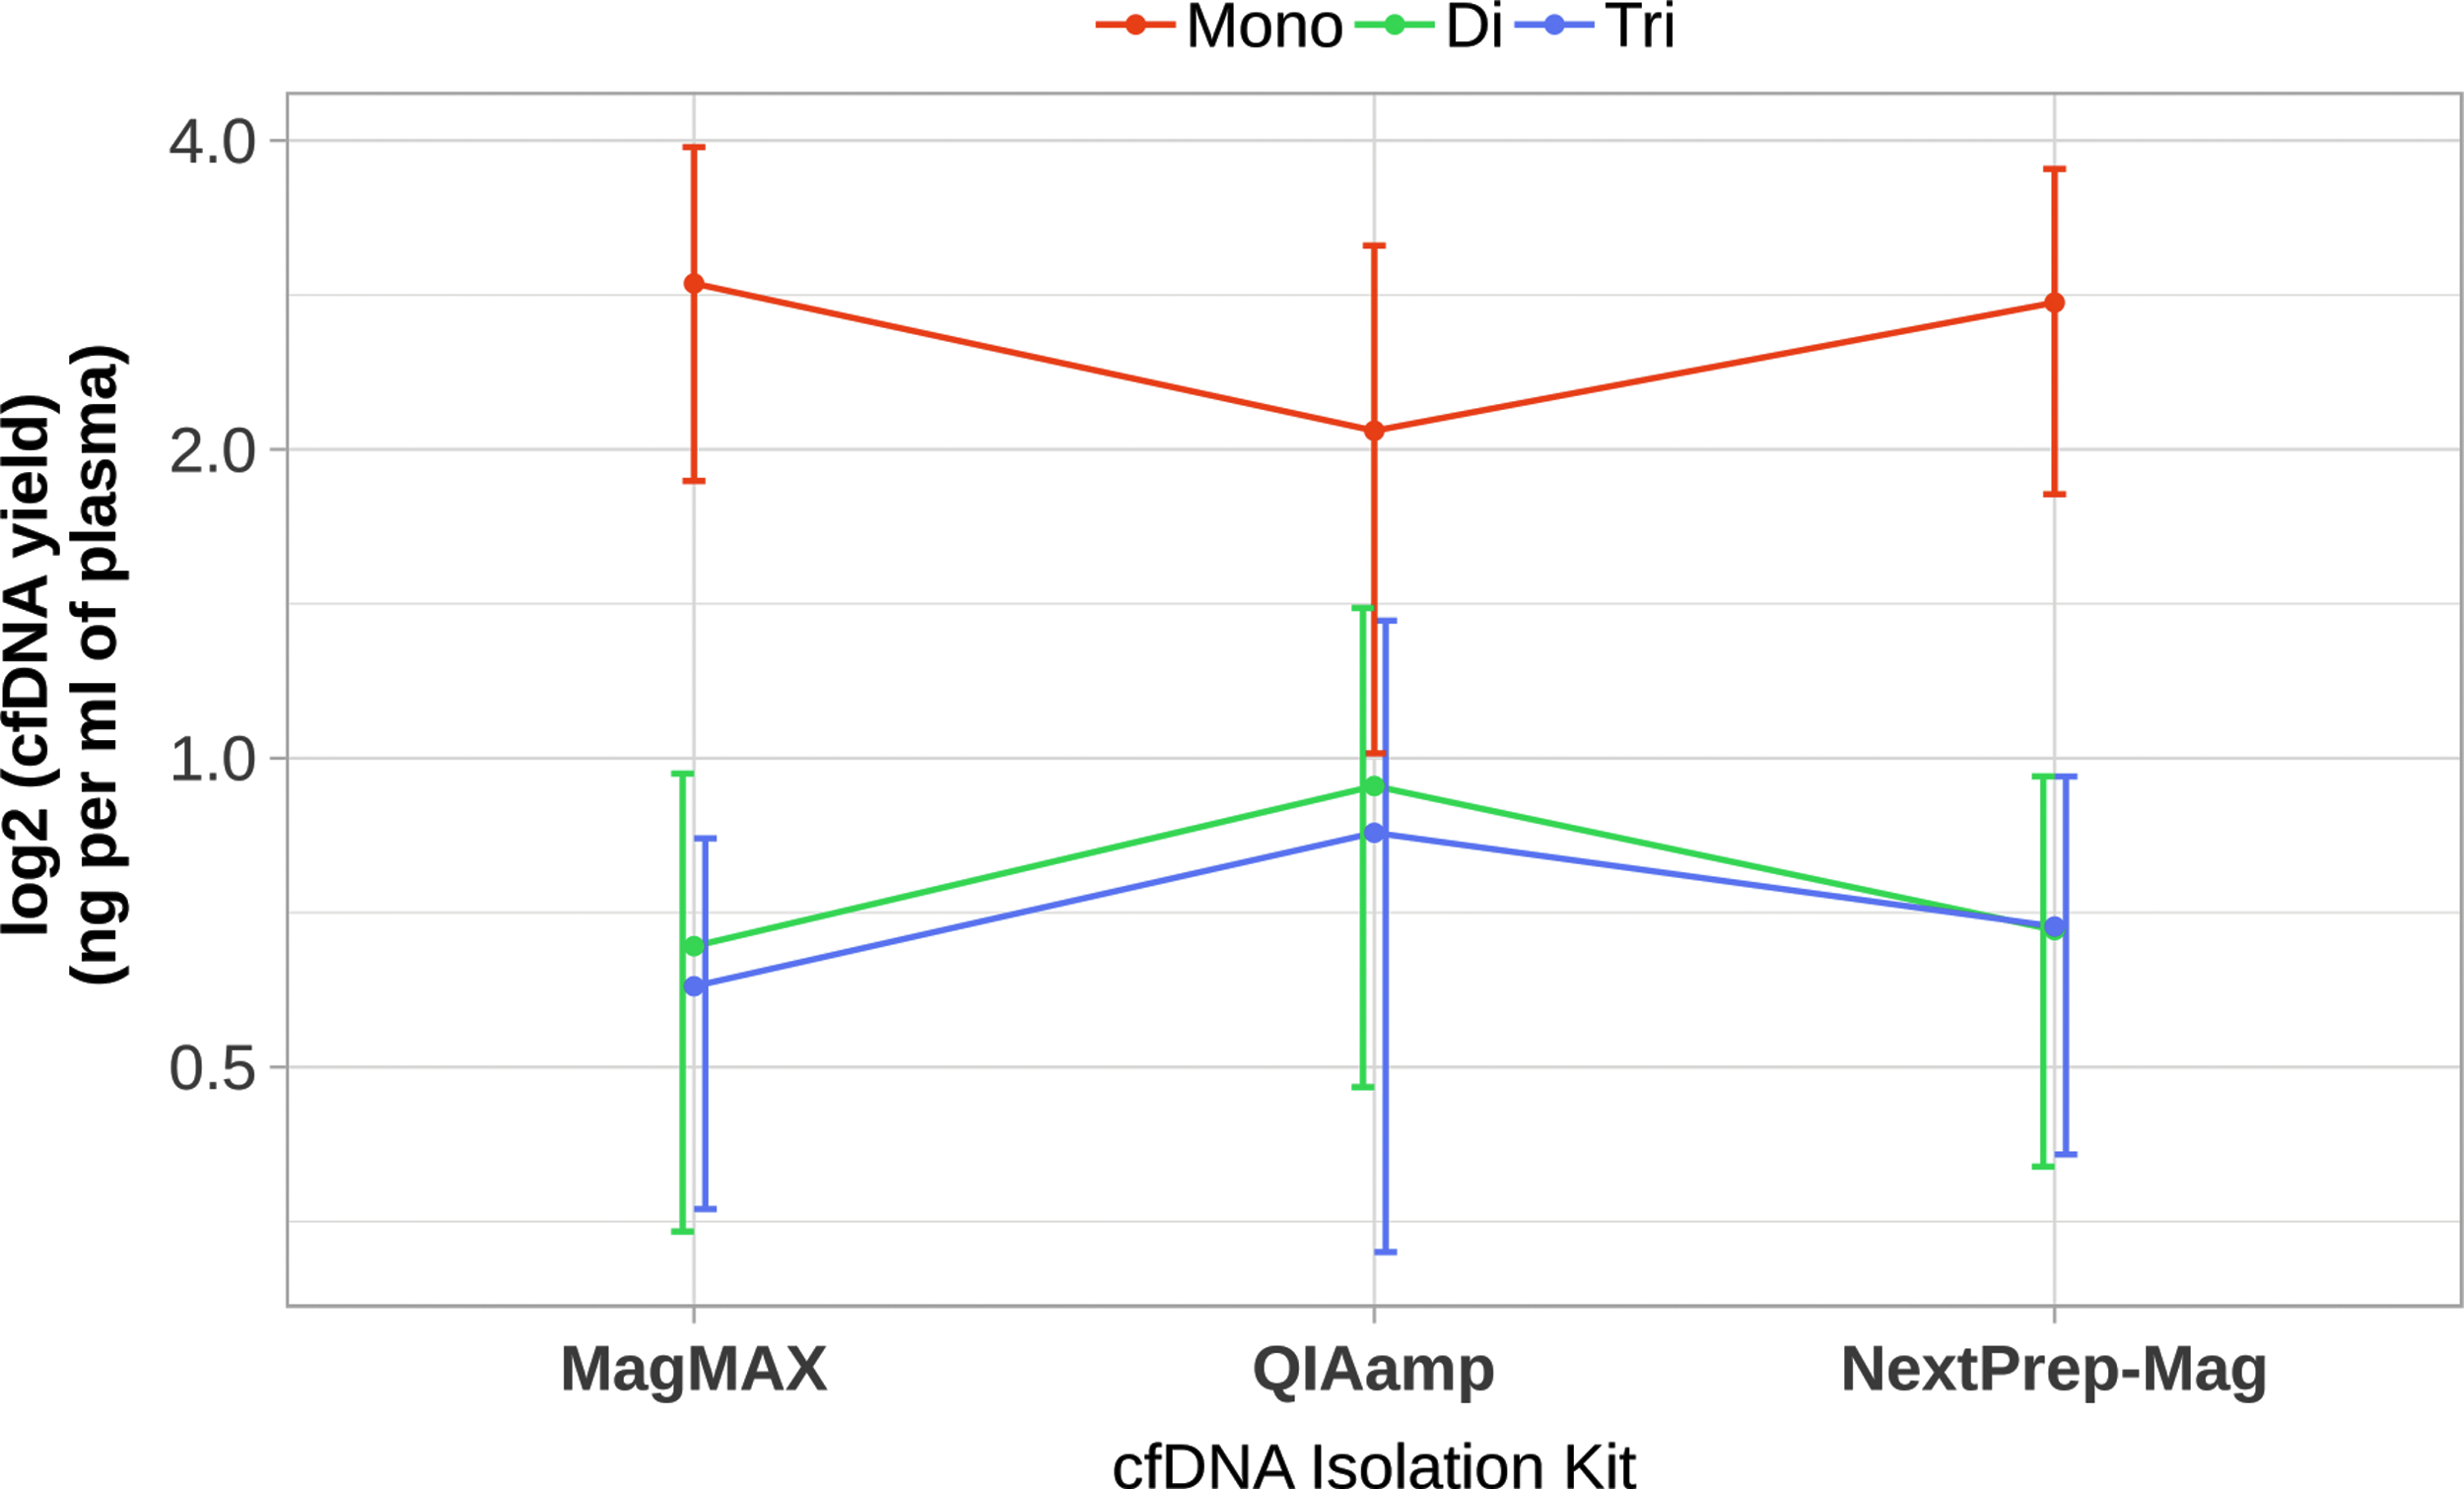
Distribution of cfDNA fragments isolated with different isolation kits. Distribution of cfDNA fragments in all plasma samples analyzed in the study and isolated by three different kits. Higher amount of mononucleosomal fragments was determined in samples isolated by the NextPrep-Mag and MagMAX Isolation Kits compared with QIAamp. Higher amount of di- and trinucleosomal fragments in samples isolated by QIAamp than by other isolation kits. Yields based on Agilent quantification.
The amounts of mono-, di-, and trinucleosomal cfDNA depending on the number of freeze–thaw cycles are shown in Figure 8. A slight increase of mononucleosomal fragments in samples isolated by QIAamp after one freeze–thaw cycle was observed (1.31 ± 0.42 and 1.70 ± 0.38 ng/mL of plasma, fresh and once frozen respectively; T-test, p = 0.044). A slight increase in trinucleosomal fragments in samples isolated by QIAamp after two freeze–thaw cycles was determined (0.51 ± 0.22 and 0.72 ± 0.15 ng/mL of plasma, fresh and twice frozen respectively; T-test, p = 0.029). A slight increase in mononucleosomal fragments was observed in samples isolated by MagMAX after two freeze–thaw cycles (2.11 ± 0.59 and 2.77 ± 0.60 ng/mL of plasma, fresh and twice frozen respectively; T-test, p = 0.023) (Fig. 8).
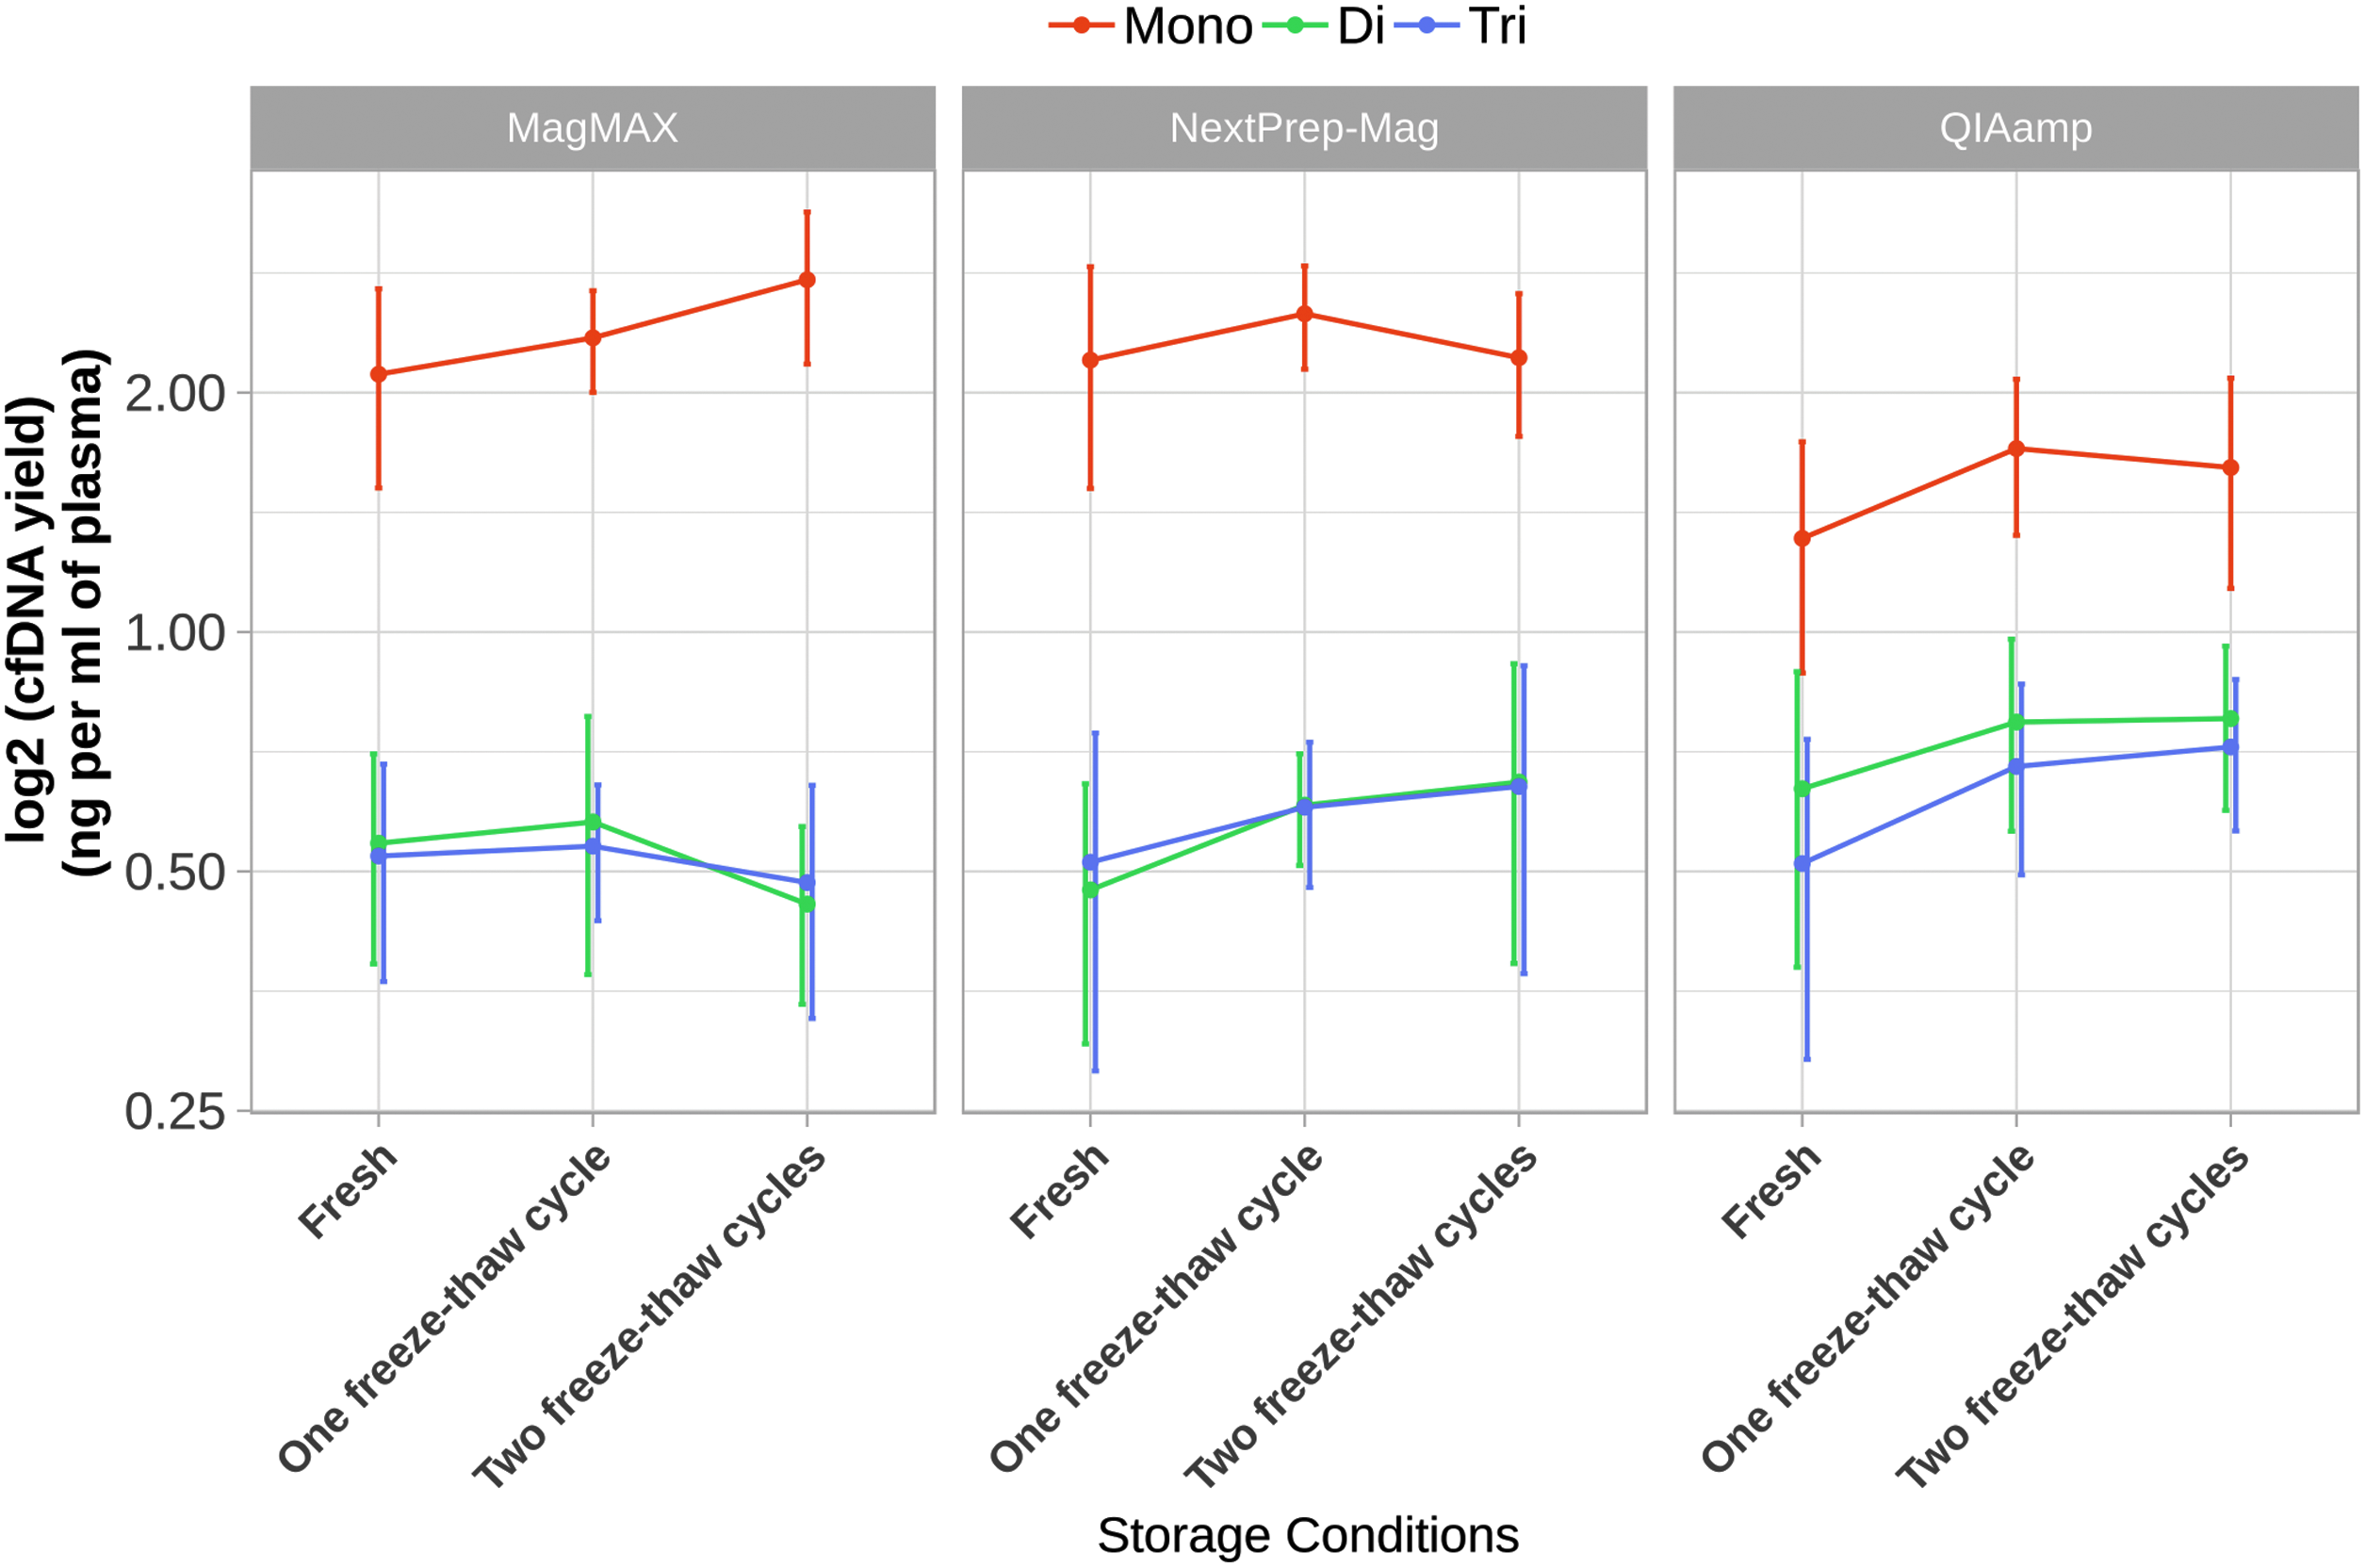
Distribution of cfDNA fragments isolated with different isolation kits after different plasma storage conditions. Distribution of cfDNA fragments in plasma samples under different plasma storage conditions (fresh, one, and two freeze–thaw cycles). Slight increase of mononucleosomal fragments in samples isolated by QIAamp after one freeze–thaw cycle was observed, and slight increase in trinucleosomal fragments in samples isolated by QIAamp after two freeze–thaw cycles was determined. Also, slight increase in mononucleosomal fragments was observed in samples isolated by MagMAX after two freeze–thaw cycles compared with fresh plasma samples.
Discussion
Recent studies of cancer biomarkers mainly focus on minimally invasive tests, such as liquid biopsies, which could be important for regular monitoring, disease management (relapse, metastasis), and evaluation of resistance to therapy. The minimally invasive nature of plasma sampling makes cfDNA a suitable clinical analyte. However, isolation of cfDNA has some procedural features that should be taken into account as they can affect downstream applications.
In our study, we evaluated the impact of the quantification method and found that the amount of cfDNA quantified by Qubit and Agilent differed significantly. cRNA is present in QIAamp isolations, which could interfere with the signals as also stated in the handbook presented by the manufacturer. Spectrometry and fluorescence-based methods are less specific and in the special case when cRNA (QIAamp isolation method) is used, the quantification signal may be increased nonspecifically. 17 Real-time PCR is currently recommended as the gold standard for DNA quantification in biobanks. However, this method is expensive and time consuming.
On the other hand, the microcapillary electrophoresis-based method has many advantages: it is less time consuming, provides information on the distribution of cfDNA fragment lengths and on the presence of gDNA, and it is specific to DNA and sensitive. Indeed, cRNA was not observed to impact the cfDNA quantification when using Agilent (data not shown).
Previous studies widely reported the advantages of the QIAamp Isolation Kit, and Qiagen remains one of the leaders in this field.10,11,13,18 It is important to note that in many of those cases cfDNA yield was quantified by fluorescence-based methods, which could lead to inaccurate conclusions. Similarly, our results showed a significantly greater amount of cfDNA isolated by this QIAamp Kit only when quantified by Qubit fluorometer, and in this case cRNA interference could not be ruled out. In terms of CVs of pools of plasma samples quantified by Qubit and Agilent, MagMAX showed the lowest CVs of 11.68% and 14.12%, respectively, suggesting that this kit may enable the best technical reproducibility.
Second, significant changes in the cfDNA amount were observed in samples isolated by the QIAamp Isolation Kit after additional plasma freeze–thaw cycles, while, interestingly, no increase of gDNA was determined. In our study we considered fragments longer than 1000 bp to be gDNA. The Agilent High-Sensitivity DNA Kit size range is 50–7000 bp, and larger fragments were not analyzed, therefore results on gDNA presence should be interpreted with caution. Third, no significant changes in isolated cfDNA or gDNA amounts were observed in hemolyzed plasma samples, except for an increase of gDNA when using the MagMAX Isolation Kit.
Fourth, we analyzed the yield of larger DNA fragments and miRNA in cfDNA samples. QIAamp and MagMAX isolations had a higher gDNA background compared with NextPrep-Mag. Although two of isolation kits (MagMAX and NextPrep-Mag) were not designed for miRNA isolation, we were able to show that circulating plasma miRNA is present in cfDNA samples. Absolute miR-223 quantification showed a significantly higher amount of miRNA isolated by QIAamp and NextPrep-Mag compared with MagMAX, suggesting possible application of both kits for analysis of both circulating nucleic acids (DNA and RNA) and even multiomics approaches.
Finally, we analyzed the recovery rates of mono-, di-, and trinucleosomal fragments, which are important for planning sequencing strategies. We evaluated these recovery rates for each isolation kit and for different plasma biobanking conditions. Our results revealed that the kits tested showed significantly different recovery. Greater amounts of small fragments were isolated by MagMAX and NextPrep-Mag, and greater amounts of bigger fragments were isolated by QIAamp.
Storage conditions also had an impact on recovery: an increase in mono- and trinucleosomal fragments was seen in samples isolated by QIAamp after one freeze–thaw cycle, and a slight increase in mononucleosomal fragments was seen in samples isolated by MagMAX after two freeze–thaw cycles. The increase in mononucleosomal fragments could partially be interpreted as the degradation of longer fragments after freeze–thaw cycles. The increase in trinucleosomal fragments may be due to the rupturing of cellular debris and therefore the recovery of longer fragments. Considering hybridization capture-based sequencing, length of the cfDNA fragments play an important role. Modifications of sequencing library preparation and especially DNA shearing step should be taken into account as well.
This study has some potential limitations. First, small sample size; in the analysis of different plasma pools different CVs were seen, showing high data variability. Increasing the number of samples would also give greater statistical power to detect differences. Second, the amounts of cfDNA in healthy individuals are low, therefore further studies with cancer patients may show a wider range of factors that could impact cfDNA yield, for example, saturation of beads or columns. Finally, qPCR or digital droplet PCR analysis, which are currently recommended for cfDNA quantification was not performed to compare both Qubit and Agilent quantification methods.
In conclusion, the quantification method has a major role in cfDNA analysis and further applications, all isolation methods had different strengths and weaknesses that would appeal to different users with different requirements:(1) The NextPrep-Mag Isolation Kit is offered for a lower price (cheapest for isolations of 1 mL samples), has a short and easy protocol (processing time around 45 minutes), recovers sufficient miRNA; (ii) MagMAX showed great results with amount of cfDNA, offers wide range of plasma volume input, however, is more expensive for isolations of 5 mL samples and could potentially be affected by hemolytic plasma. Moreover, proteinase K is not provided. Both bead-based methods require additional equipment (magnetic rack); (iii) QIAamp has a strong economical advantage for samples with greater volume (5 mL), and could be used for circulating miRNA analysis. However, it contains poly-A cRNA, which should be taken into account when choosing the quantification method. Moreover, it is a vacuum-based method requiring expensive additional equipment (vacuum system).
Footnotes
Acknowledgments
M.F. acknowledges funding from the EU Horizon 2020 program under grant agreement 824110 (European Advanced infraStructure for Innovative Genomics, EASI-Genomics) and from the ERDF Interreg Deutschland-Danmark program (project: Changing Cancer Care).
Author Disclosure Statement
No conflicting financial interests exist.