
Abstract
Background:
A formal method validation for biospecimen processing in the context of accreditation in laboratories and biobanks is lacking. A previously optimized stool processing protocol was validated for fitness-for-purpose for downstream microbiome analysis.
Materials and Methods:
DNA extraction from human stool was validated with various collection tubes, stabilizing solutions and storage conditions in terms of fitness-for-purpose for downstream microbiome analysis, robustness, and sample stability. Acceptance criteria were based on accurate identification of a reference material, homogeneity of extracted samples, and sample stability in a 2-year period.
Results:
The automated DNA extraction using the chemagic™ Magnetic Separation Module I (MSM I) extracted 8 out of 8 bacteria in the ZymoBIOMICS® Microbial Community Standard. Seven tested stabilizing solutions (OMNIgene®•GUT, RNAlater®, AquaStool™, RNAssist, PerkinElmer SEB lysis buffer, and DNA Genotek's CP-150) were all compatible with the chemagic MSM I and showed no significant difference in microbiome alpha diversity and no significant difference in the overall microbiome composition compared to the baseline snap-frozen stool sample. None of the stabilizing solutions showed intensive polymerase chain reaction (PCR) inhibition in the SPUD assay. However, when we take into account more stringent criteria which include a higher double-stranded DNA yield, higher DNA purity, and absence of PCR inhibition, we recommend the use of OMNIgene•GUT, RNAlater, or AquaStool as alternatives to rapid freezing of samples. The highest sample homogeneity was achieved with RNAlater- and OMNIgene•GUT -stabilized samples. Sample stability after a 2-year storage in −80°C was seen with OMNIgene•GUT -stabilized samples.
Conclusions:
We validated a combination of a stool processing method with various collection methods, suitable for downstream microbiome applications. Sample collection, storage conditions and DNA extraction methods can influence the microbiome profile results. Laboratories and biobanks should ensure that these conditions are systematically recorded in the scope of accreditation.
Introduction
In the context of biobank accreditation and quality assurance of preclinical research, biospecimen processing method validation is critical. It allows for assessment of the method's fitness-for-purpose, reproducibility, robustness, and sample stability. Published validated methods reduce the effort needed by researchers to establish various processing conditions, thereby saving resources and time. In addition, biospecimen processing method validation has become a normative requirement for biobank accreditation. 1 We present here the sixth in a series of articles reporting the validation of methodology for fit-for-purpose biospecimen processing for downstream applications.2–6
Our understanding of the organisms inhabiting our gut and how they affect human health and disease has advanced substantially in recent years. Previous studies have linked specific gut microbial fingerprints to different diseases and conditions ranging from diabetes to obesity, inflammatory bowel disease, and colorectal cancer.7–12 It is evident from the number of articles being published on the gut microbiome that the field is progressing rapidly. However, although we know more now than before, there are still large knowledge gaps in the field that need to be addressed, such as standardization and validation of methods.
In 2015, the Integrated BioBank of Luxembourg (IBBL) published an article focused on the optimization of a stool processing protocol. 3 The study identified the optimal combination of DNA extraction method and stool collection container type. The automated DNA extraction with the chemagic™ Magnetic Separation Module I (MSM I) method (PerkinElmer chemagen, Baesweiler, Germany), coupled with DNA Genotek's P-085 (CP-150) tubes (Ontario, Canada), was found to be optimal, automation-friendly, and with reduced logistic challenges for sample collection and shipment.
Incidentally, shortly after IBBL's article was published, DNA Genotek discontinued the production of the CP-150 tube. Therefore in this article, we extended the scope of the previous study by validating the automated stool DNA extraction on the chemagic MSM I platform with the commercialized OMNIgene®•GUT kit, produced by the same company. We have compared it to the CP-150 tube and to other collection methods in terms of fitness-for-purpose for downstream microbiome analysis. To overcome issues related with preprocessing stool stability, the present validation also encompasses different stabilizers and storage conditions versus the snap-frozen collection. Fitness-for-purpose for downstream microbiome analysis was assessed using 16S rRNA gene sequencing.
Materials and Methods
Study design
The optimized protocol from our previous publication 3 was validated in terms of fitness-for-purpose for the trueness of 16S rRNA gene sequencing analysis, robustness in terms of homogeneity and prefreezing delay and sample stability.
To evaluate the trueness of the method, we tested a reference material with known bacterial composition. In addition, room temperature-collected samples (with or without stabilizer) were also evaluated in terms of the quantity and purity of the extracted DNA and the presence of polymerase chain reaction (PCR) inhibitors and compared to the baseline snap-frozen-collected samples. A comparison was also done between the commercialized OMNIgene•GUT tubes and the phased-out prototype CP-150 tubes from DNA Genotek, which was previously tested in the initial method optimization. We performed 16S rRNA gene sequencing on all extracted DNA to determine the microbiome profile of each sample and to assess the effect of different collection methods on the fecal microbiota alpha diversity.
To evaluate the robustness in terms of homogeneity, we tested samples stored in four collection tube types by taking four frozen cores from different specimen areas using a frozen specimen aliquoting instrument. The robustness in terms of prefreezing delay was evaluated using samples in OMNIgene•GUT tubes stored at room temperature (RT) for up to 2 weeks.
The sample stability was assessed by analyzing the variability of the 16S rRNA gene microbiome after 2 years storage at −80°C. DNA samples frozen at −80°C, which were extracted 24 hours postfreezing were used as the baseline.
Human stool samples were collected from healthy volunteers who provided written informed consent (CNER approval no. 201107/02).
Reference material used
The ZymoBIOMICS™ Microbial Community Standard (D6300) was obtained from Zymo Research (Irvine, CA). The D6300 is a commercially available, regulatory grade reference material consisting of 10 inactivated microorganisms as follows: Pseudomonas aeruginosa, Escherichia coli, Salmonella enterica, Lactobacillus fermentum, Enterococcus faecalis, Staphylococcus aureus, Listeria monocytogenes, Bacillus subtilis, Saccharomyces cerevisiae, and Cryptococcus neoformans. It includes three gram-negative bacteria, five gram-positive bacteria, and two yeasts.
In-process quality control materials used
Two in-process quality control (QC) materials were used for the DNA extraction and 16S rRNA gene sequencing and these are as follows: (1) the Internal Bacterial DNA Extraction Control (Bacterial Pool QC), prepared at the Laboratoire National de Santé (LNS) and IBBL, was used in stool DNA extraction for downstream 16S rRNA gene sequencing. This bacterial suspension was prepared from two freeze-dried microorganisms (Vibrio brasiliensis and Moraxella canis) obtained from DSMZ (Leibniz Institute DSMZ-German Collection of Microorganisms and Cell Cultures, Braunschweig, Germany), cultured at the LNS, and pooled in IBBL with a concentration of ≥108 CFU/mL.
The Internal 16S Mock Bacterial Community Control (DNA QC 16S), prepared in IBBL, was used in 16S rRNA gene sequencing. This material is composed of 10 commercially available exogenous bacterial genomic DNA (Oceanicola marinus, Vibrio aestuarianus, Thioclava dalianensis, Roseovarius halotolerans, Undibacterium macrobrachii, Paraoerskovia marina, Halomonas campaniensis, Ardenticatena maritima, Desulfobulbus rhabdoformis, and Fulvimarina pelagi), which were all obtained from DSMZ and were mixed in even concentration in IBBL.
Stool collection
For the comparison of different stool collection methods, samples from two donors were collected. For each donor, ∼50 g of bulk sample was collected in a sterile container and homogenized by rigorous mixing using a sterile spatula with ∼2–5 mL of phosphate-buffered saline to facilitate mixing. The bulk samples were then aliquoted to their respective containers and stored in different storage conditions following Table 1.
Stool Collection Methods and Storage Conditions
RT storage corresponds to 19°C–25°C.
RT, room temperature.
For robustness (homogeneity), stool samples from two donors were collected and aliquoted into the following containers: OMNIgene•GUT kit (0.5 g of sample), RNAlater® in ParasiTrap® tube (1 g sample +1 mL RNAlater), 1 g of sample snap frozen (in −80°C) in Sarstedt sterile feces container, and AquaStool™ in ParasiTrap tube (200 mg sample +2 mL AquaStool reagent). The samples that were stored in OMNIgene•GUT tubes, RNAlater, and AquaStool were all homogenized by either using the metallic bead in the OMNIgene•GUT tubes or by the cap press in the ParasiTrap tubes. No homogenization was performed in the samples stored in the Sarstedt sterile feces container. Following aliquoting (with/without homogenization), the contents of each container were transferred into 2-mL cryovials and were then frozen in −80°C freezer for at least 24 hours. For each frozen sample, four stool cores were taken using CryoXtract CXT353 System (Woburn, MA) using a previously validated protocol. 13 A total of 32 cores weighing ∼200 mg were cored and each core was processed for DNA extraction.
For robustness (prefreezing delay), stool samples from two donors were collected and each bulk sample was homogenized and aliquoted equally into 12 OMNIgene•GUT tubes and stored as follows: 3 tubes were frozen immediately in −80°C freezer, 3 were stored for 24 hours at RT then frozen in −80°C freezer, 3 were stored for 1 week at RT then frozen in −80°C freezer, and 3 were stored for 2 weeks at RT then frozen in −80°C freezer.
For sample stability, 15 OMNIgene•GUT tubes were filled with an equal quantity of a homogeneous stool bulk from one donor and then frozen in −80°C freezer.
DNA extraction
A chemagic DNA blood protocol was used with the MSM I instrument using the chemagic DNA Blood 4k Kit special H24 (ref. CMG-1074) with a lysis buffer for fecal samples, and MSM I software. Each sample was lysed using 2 mL of SEB lysis buffer and 30 μL Proteinase K (both included in the kit) and vortexed to obtain a homogenous suspension that was incubated for 10 minutes at 70°C water bath, then 5 minutes at 95°C. Lysates (1.5 mL) were centrifuged for 5 minutes at 10,000g at RT. One milliliter supernatants were transferred to a 24XL deep well plate. Plates were processed using the chemagic MSM I automated protocol. Each DNA extraction run included an internal bacterial DNA extraction control (Bacterial Pool QC) in duplicates to check for the efficiency of the DNA extraction and to detect any contamination during the run.
DNA quantification and purity measurement
Total DNA quantification by spectrophotometry was performed using a Synergy Mx Monochromator-Based Multi-Mode microplate reader (Biotek) with Gen 5 version 2.0 software and Take 3 plate. DNA quantification and purity (A260/A280 ratio) measurements were performed in the same assay after DNA extraction. Double-stranded DNA quantification by spectrofluorometry was performed with Quant-iT PicoGreen dsDNA Assay Kit (Invitrogen) using 96-well plates.
SPUD assay (detection of PCR inhibitors)
DNA template quality was assessed with the quantitative PCR SPUD assay that detects PCR inhibitors using a published method. 14 Samples were tested in triplicates.
16S rRNA gene sequencing and bioinformatics analysis
The gene-specific primers were used to target the V3–V4 regions of the 16S rRNA gene. These primers are designed with Illumina overhang adapters and used to amplify templates from genomic DNA. The primer sequences used are as follows: forward primer = 5′-TCGTCGGCAGCGTCAGATGTGTA TAAGAGACAGCCTACGGGNGGCWGCAG-3′ and reverse primer = 5′-GTCTCGTGGGC TCGGAGATGTGTATAAGAGACAGGACTACHVGGGTATCTAATCC-3′.
Amplicons were generated, cleaned, indexed, and sequenced according to the Illumina-demonstrated 16S Metagenomic Sequencing Library Preparation Protocol with certain modifications. 15 In brief, an initial PCR contained at least 12.5 ng of DNA. A subsequent limited-cycle amplification step was performed to add multiplexing indices and Illumina sequencing adapters. Libraries were normalized and pooled and sequenced on the Illumina MiSeq system using 2 × 300 bp paired-end reads.
Each library preparation run included positive and negative controls as follows: the internal bacterial DNA extraction control (Bacterial Pool QC) and internal 16S mock bacterial community control (DNA QC 16S), both prepared in-house, were used as positive controls to check the trueness of the method (analytic wet bench process and bioinformatics analysis of sequence data) and to detect any contamination during the sequencing library preparation and/or artefacts arising from the bioinformatics analysis. DNase/RNase-free water was used as negative control to detect any contamination during the start of the sequencing library preparation process. QC checks were performed systematically all throughout the processing. A sequencing run was only accepted when the acceptance criteria for each preparation step passed.
When the sequencing run passed the preliminary QC checks, the resulting raw 16S rRNA gene sequences (FASTQ files) were cleaned and clustered as operational taxonomic units (OTUs) using UPARSE and Mothur and annotated by Megablast using RDP reference database version 11.5.
Validation criteria
The trueness acceptance criterion was that all extracted DNA replicates of ZymoBIOMICS Microbial Community Standard (D6300) must show the presence of all the expected bacterial OTUs at the genus level.
For the comparison of different stool collection methods, the snap-frozen collection was used as the baseline. The condition with no significant difference in alpha diversity compared to the baseline (p < 0.05) was considered as the most accurate.
The robustness (homogeneity) acceptance criterion was the following: for genus with ≥5% relative abundance, the coefficient of variation (CV%) between the four cores must be <30%.
The robustness (prefreezing delay) acceptance criterion was: with the snap-frozen collection being used as the baseline, the condition with no significant difference (p > 0.05) in alpha diversity compared to the baseline, was considered as the most robust in terms of prefreezing delay.
For stability, the 16S rRNA gene microbiome profile of each sample at different time points was analyzed. The stability acceptance criteria were the following: for each OTU (genus level) with >1% relative abundance, the absolute differences between the baseline control samples (extracted and sequenced at day 0) and the experimental control samples (extracted and sequenced after 2 years) were calculated and compared against the 0.3 analytical combined uncertainty (| T0–T2 | < 0.3 σ analytical combined uncertainty).
Statistical analyses
Mean, SD, and CV% were calculated using Microsoft Office Excel 2016. To determine if alterations in microbial diversity occurred as a result of different fecal collection conditions, alpha and beta diversities were investigated using R Statistics Software v3.5.1 with R Studio v1.1.447 and R—Phyloseq package, 16 v1.24.2. Alpha diversity results between different fecal collection conditions, homogeneity and pre-freezing delay results were compared using one-way analysis of variance (ANOVA) on ranks (Kruskal–Wallis test). Analyse-IT Method Validation Edition, v.5.01, software package was used with 5% significance threshold. Finally, to determine if there is no significant difference in the overall microbiome composition among the two donor samples collected in different storage conditions, we performed PERMANOVA (permutational multivariate analysis of variance) on Bray–Curtis dissimilarity index using the adonis function from the R package vegan.
Results
Fitness-for-purpose in terms of trueness of 16S rRNA gene sequencing
The fitness-for-purpose of the automated DNA Extraction on chemagic MSM I in terms of fitness-for-purpose and trueness of 16S rRNA gene sequencing was evaluated using ZymoBIOMICS Microbial Community Standard (D6300). Triplicate DNA extraction and 16S rRNA gene sequencing of the DNA extracted from the reference material identified 8 out of 8 expected bacterial genera (Fig. 1).
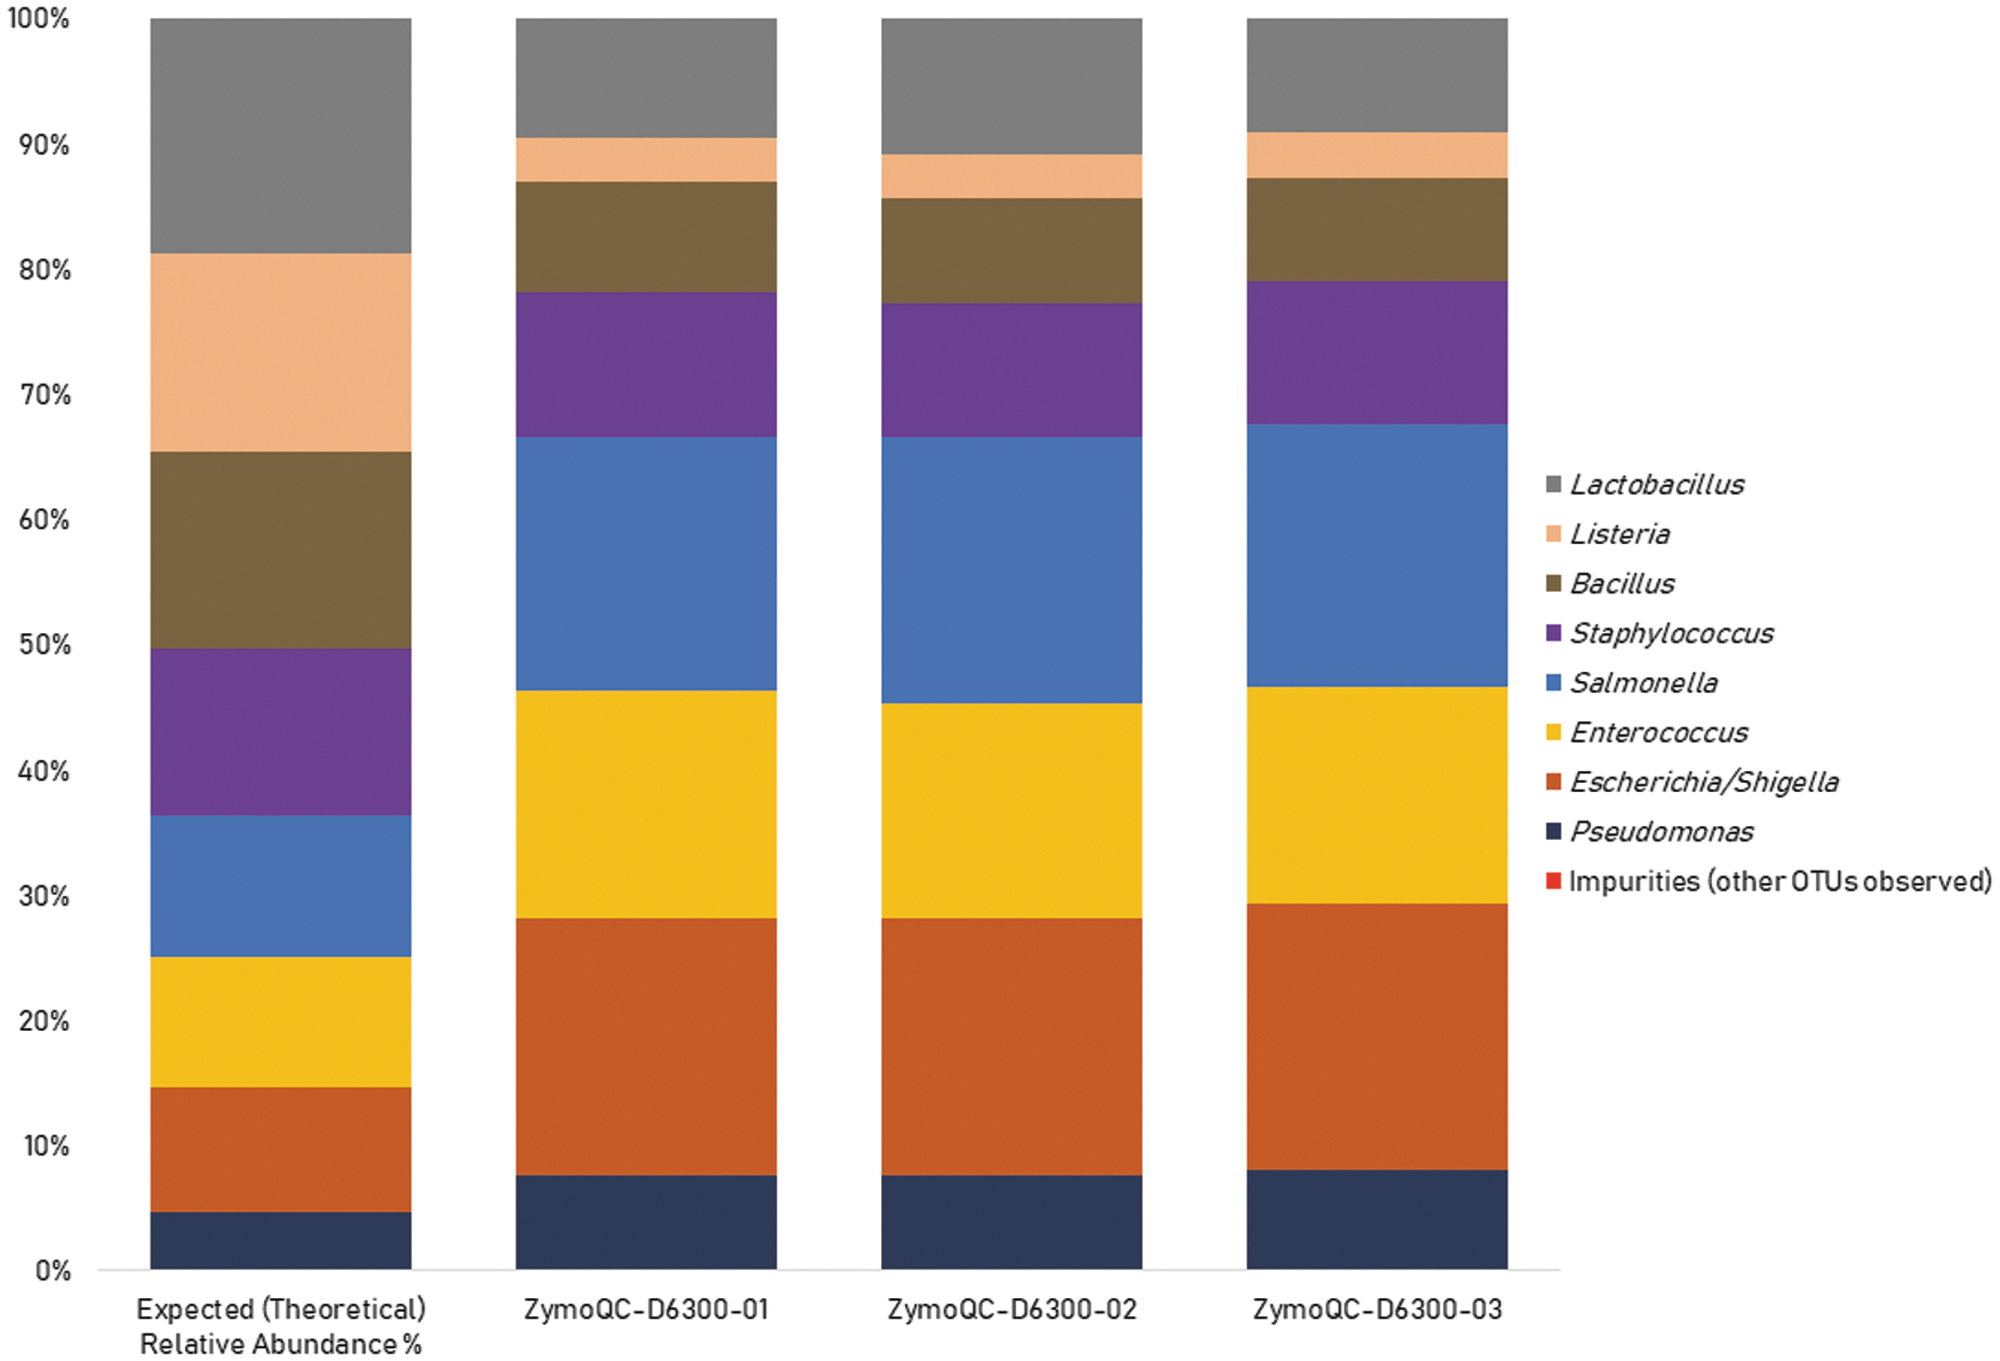
Theoretical and mean experimental genus-level relative abundance of ZymoBIOMICS™ Microbial Community Standard (D6300). Eight out of 8 expected bacterial genera were identified.
Comparison of different stool collection methods
DNA yield by spectrophotometry and spectrofluorometry
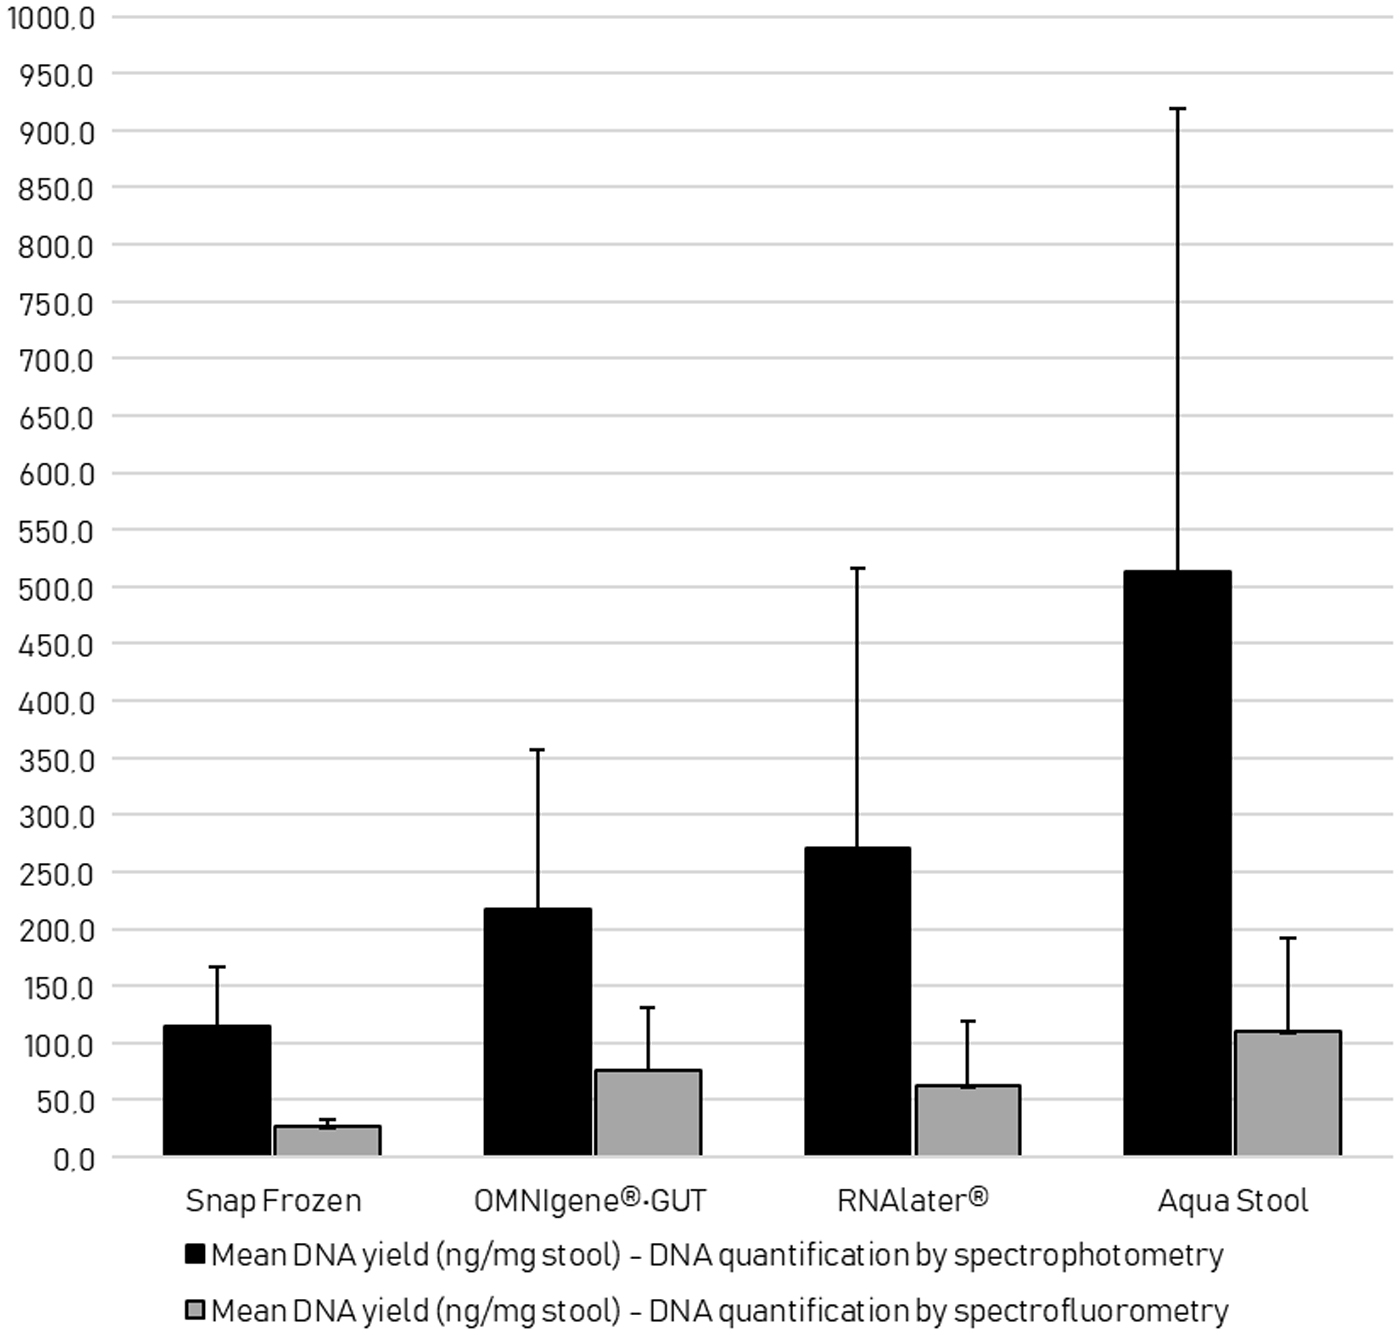
Seven RT collection methods (with or without stabilizer) were compared to the snap-frozen collection in terms of total and double-stranded DNA yields. DNA quantification by spectrophotometry and spectrofluorometry of the 48 DNA extracts obtained is presented in Figure 2. A wide range in yields was seen with different collection methods. RNAlater, OMNIgene•GUT, and AquaStool gave higher total DNA yields compared to the baseline snap-frozen samples. All tested collection methods, with the exception of RNAssist, gave higher double-stranded DNA yields compared to the baseline snap-frozen samples.

Comparison of the total DNA yield (ng/mg stool) by spectrophotometry and spectrofluorometry of the different stool collection methods. The bar height represents the average total DNA yield in ng/mg stool sample and the error bars represent the SD. SD, standard deviation.
DNA purity by spectrophotometry
The most common DNA purity calculation is the ratio of the absorbance at 260 nm divided by the reading at 280 nm. Good-quality DNA generally has A260/280 ratio of 1.7–2.0. 17 Figure 3 shows that PE Lysis buffer obtained the lowest mean ratio of 1.55. All other collection methods obtained a mean ratio between 1.7 and 1.9.
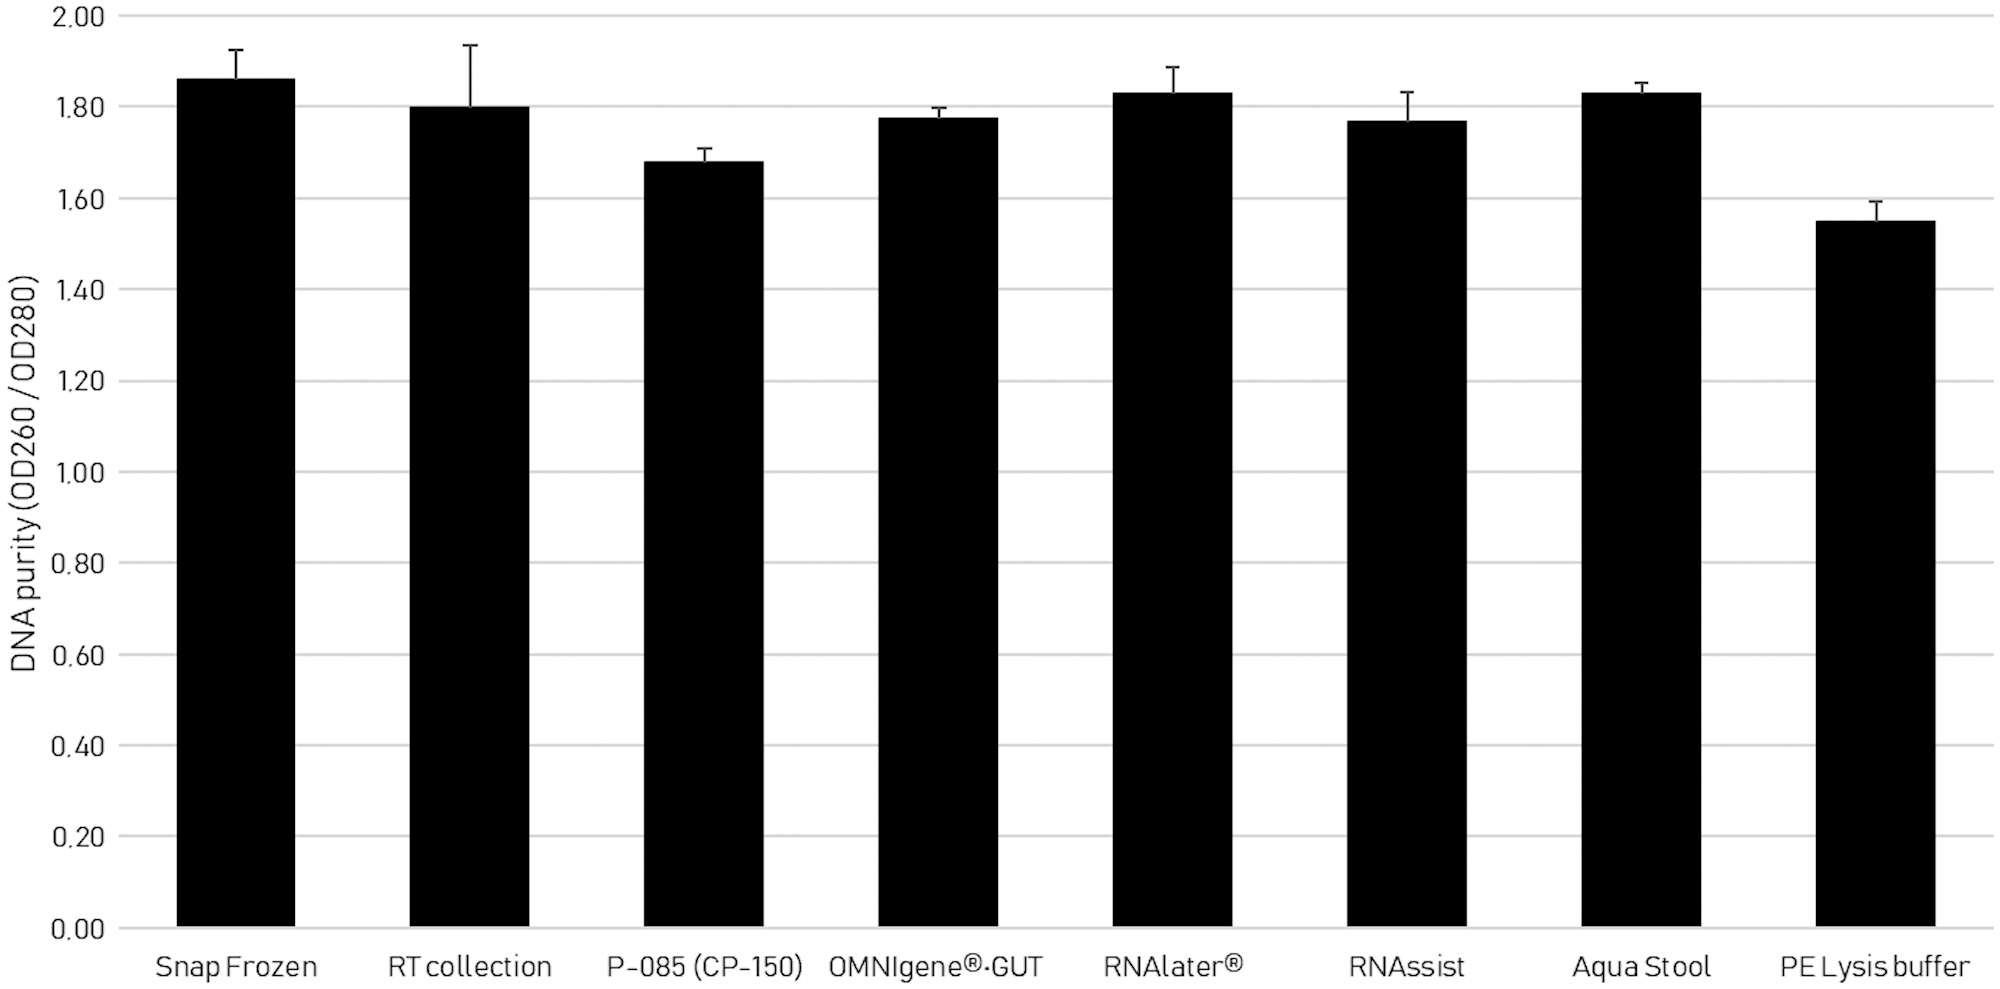
DNA purity measurement by A260/280 ratio. The bar height represents the average A260/280 ratio and the error bars represent the SD.
Detection of PCR inhibitors
The SPUD assay was performed on all DNA samples extracted from eight different collection methods to determine the presence of possible PCR inhibitors that may interfere with downstream analyses. Ideally, a stool collection method must not show an intensive PCR inhibition in the SPUD assay.
Table 2 shows the SPUD assay results for all the samples. Results show that all, with the exception of CP-150, showed no PCR inhibition in the assay. As for the CP-150, it showed a slight inhibition. Although this result is acceptable, it is still highly recommended to opt for the collection method which shows no inhibition at all. In this regard, DNA Genotek's OMNIgene•GUT tubes performed better than the phased-out CP-150 tubes.
Detection of Polymerase Chain Reaction Inhibitors by SPUD Assay
Alpha diversity
We performed 16S rRNA gene sequencing on all extracted DNA to determine the microbiome profile of each sample and to assess the effect of different collection methods on the fecal microbiota alpha diversity. The effect of different collection methods on fecal microbiota alpha diversity was assessed based on OTU richness (measured based on the absolute observed number of taxa), diversity (Shannon–Wiener index) and evenness (Simpson's evenness). The results are shown in Figure 4(A–C). The extent of microbiota structural and composition diversities was measured and plotted using (A) OTU richness, (B) Shannon–Weiner diversity index, (C) Simpson's evenness index. Between-group variations (different collection conditions) were measured using using one-way ANOVA on ranks (Kruskal–Wallis test). OTU richness (p = 0.96), diversity (p = 0.78), and evenness (p = 0.71) did not differ significantly between storage conditions (p > 0.05).
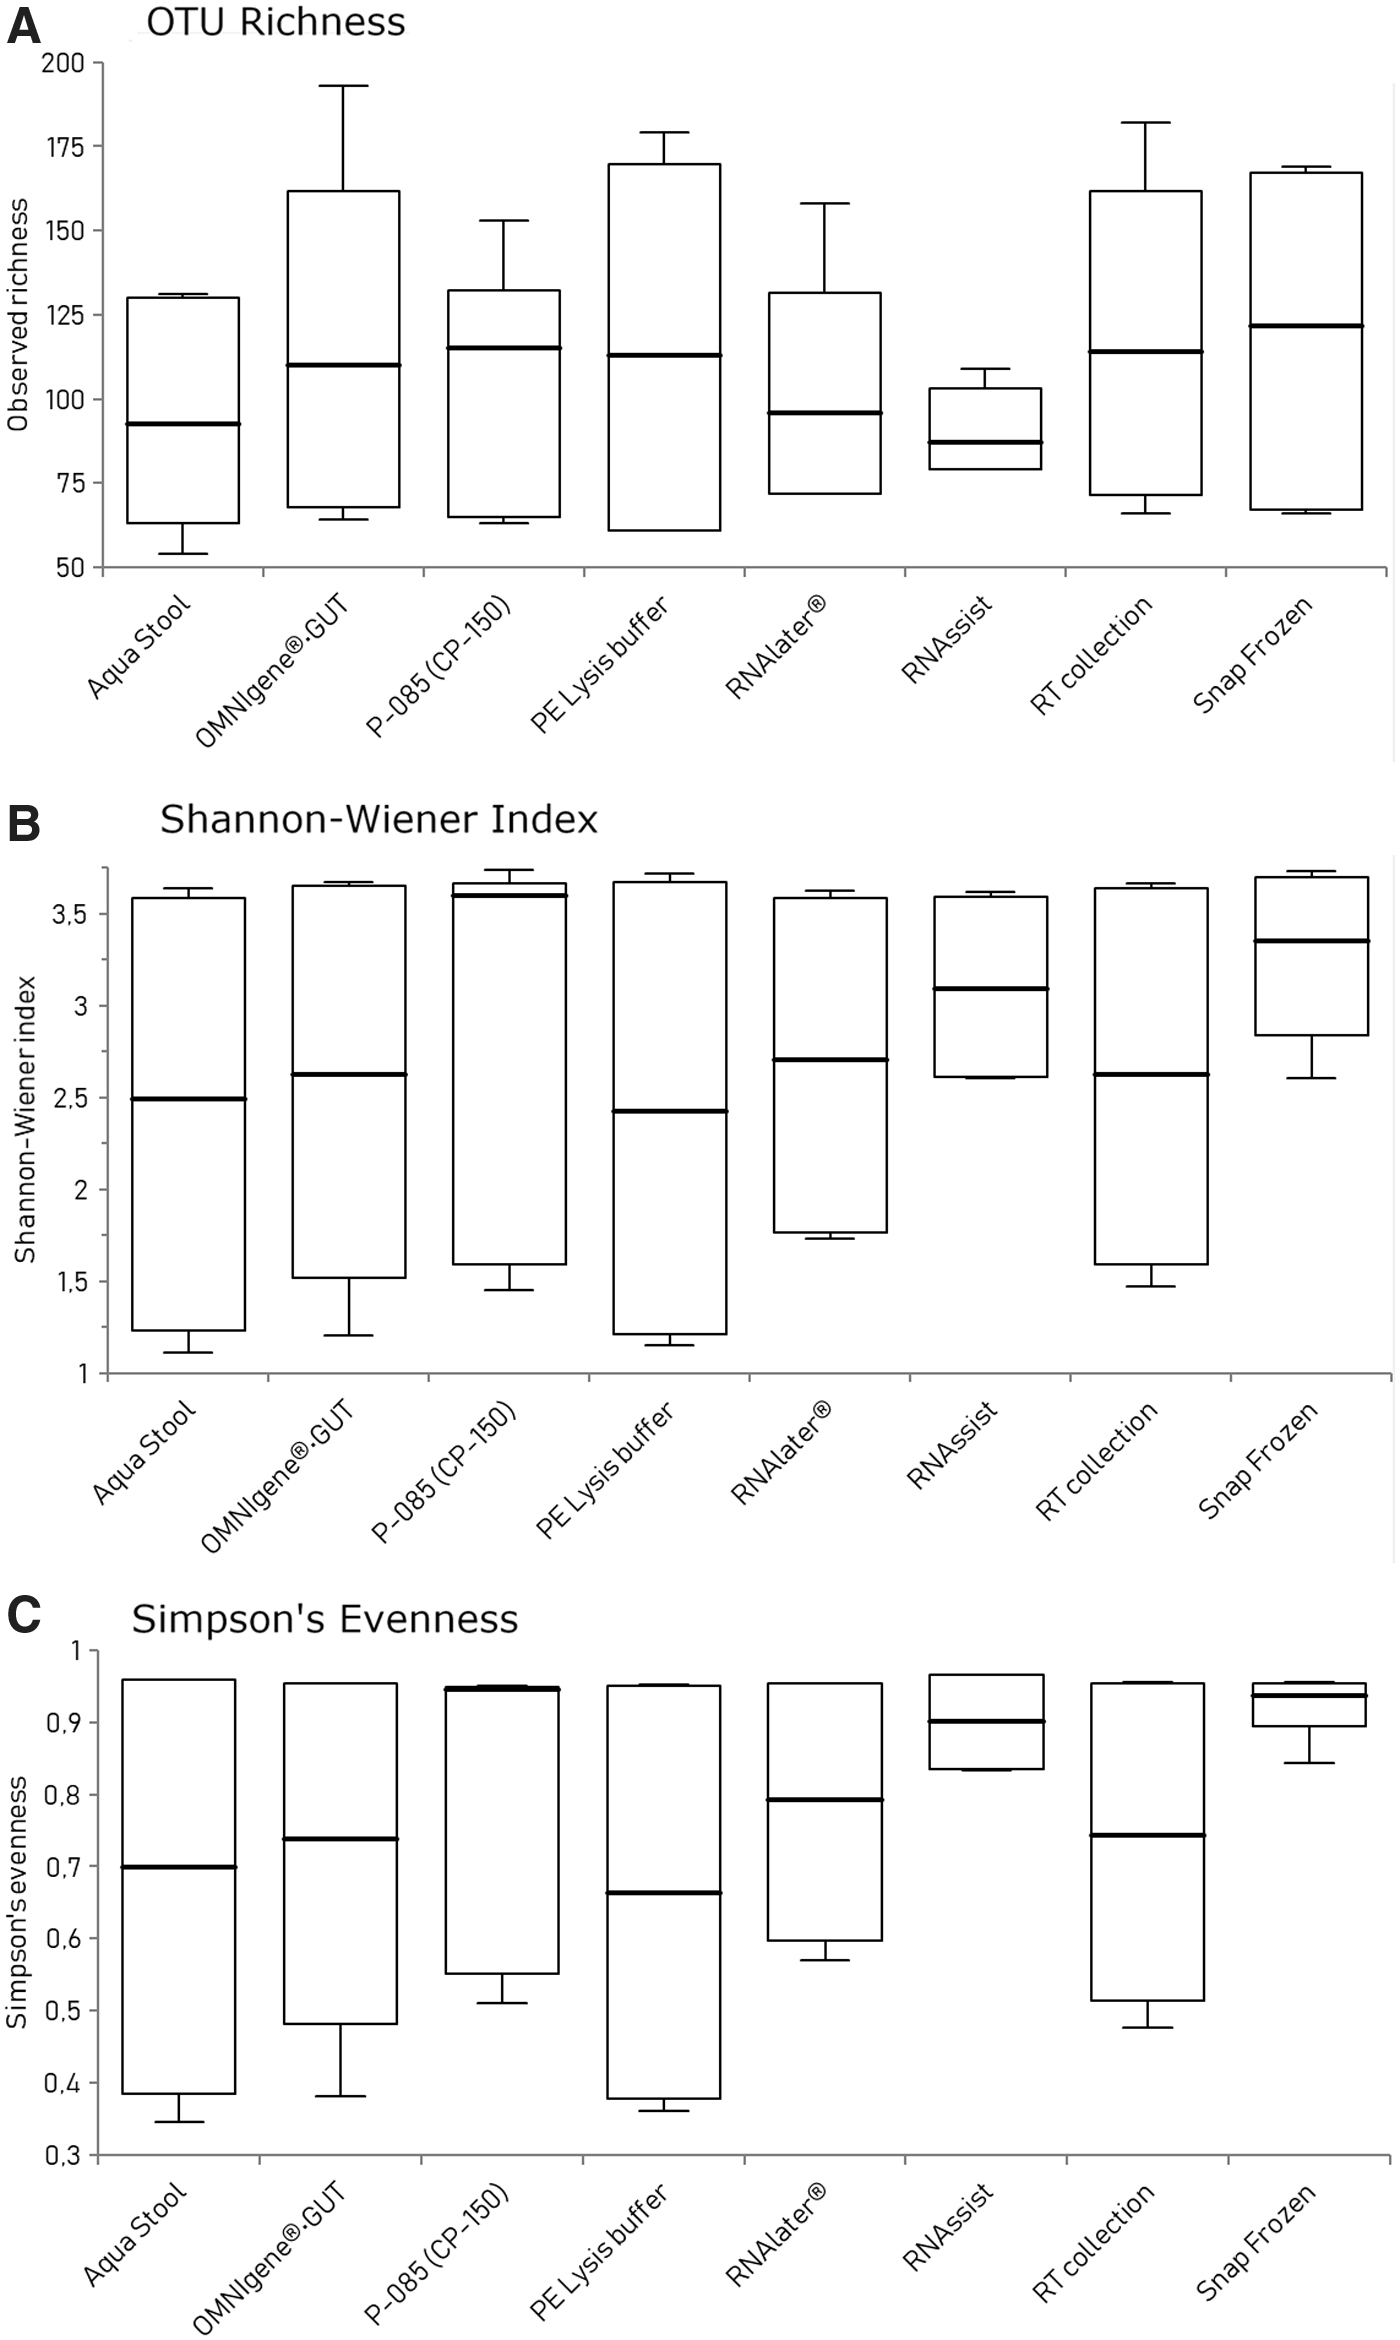
Fecal microbiota alpha diversity in eight different collection methods. This was assessed based on OTU richness (measured based on the absolute observed number of taxa), diversity (Shannon–Wiener index) and evenness (Simpson's evenness). OTU, operational taxonomic unit.
Beta diversity
To determine if there is no significant difference in the overall microbiome composition among the two donor samples collected in different storage conditions, we performed a PERMANOVA on Bray–Curtis dissimilarity index using the adonis function from the R package vegan. The test revealed no significant difference in bacterial communities between the samples collected under different collection methods (p > 0.05).
Robustness in terms of homogeneity
Three room-temperature collection methods with stabilizers (OMNIgene•GUT, RNAlater, and AquaStool) had higher double-stranded DNA yield, higher DNA purity, and absence of PCR inhibition compared with the other four room-temperature collection methods (Figs. 2 and 3, Table 2). Because of these results, we evaluated the homogeneity of these three collection methods and compared the results to the snap-frozen collection.
DNA yield by spectrophotometry and spectrofluorometry
DNA quantification by spectrophotometry and spectrofluorometry of the 32 cores (16 cores per donor, 2 donors) is presented in Figure 5. A wide range in yields was observed in all the samples. On average, the cores obtained from AquaStool, RNAlater, and OMNIgene•GUT consistently gave higher DNA yields (both in spectrophotometry and spectrofluorometry measurements) compared to the baseline snap-frozen cores. All cores met the required double-stranded DNA yield output (minimum 12.5 ng) for the 16S rRNA gene sequencing assay, which is a critical factor to consider before performing the assay.
Comparison of the total DNA yield (ng/mg stool) by spectrophotometry and spectrofluorometry of the frozen cores from Snap Frozen, OMNIgene®•GUT, RNAlater®, and AquaStool™ collection methods. The bar height represents the average total DNA yield in ng/mg stool sample and the error bars represent the SD.
Taxonomy and genus relative abundance
The comparison of the genus-level OTU relative abundances of all the cores extracted from two donor samples which were collected under four different conditions is shown in Figure 6.
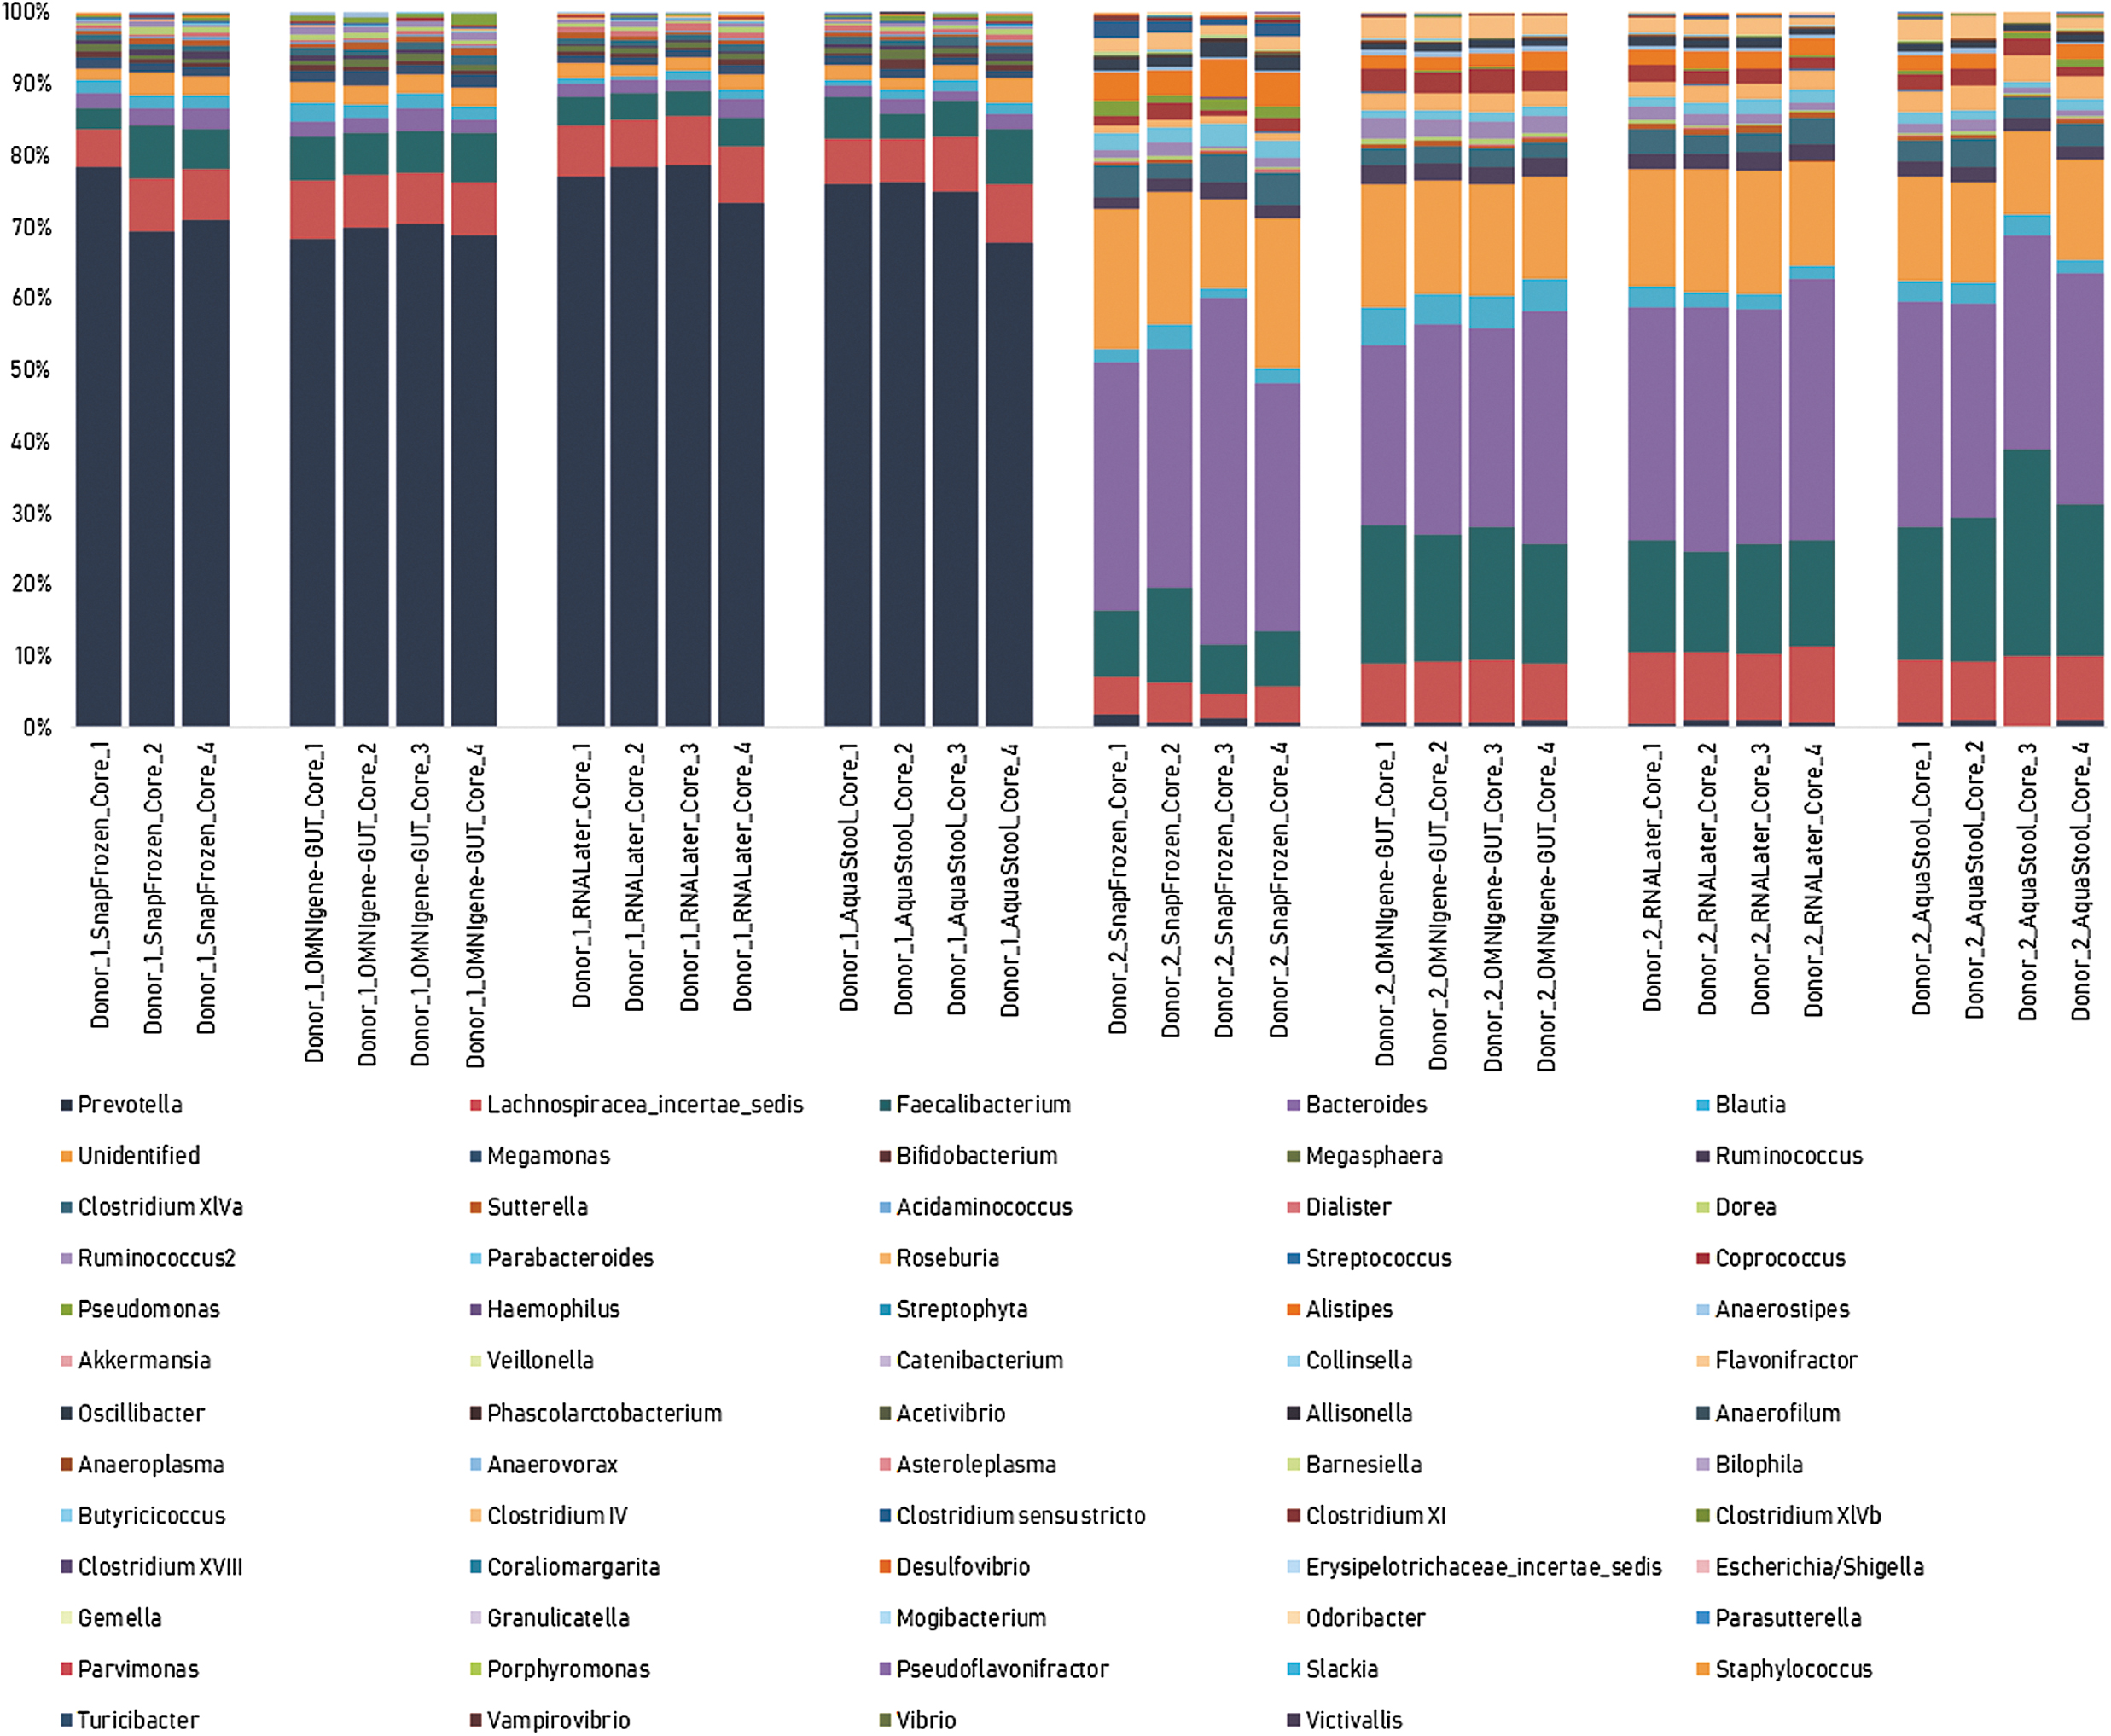
Genus-level microbiome profile of all cores extracted from two donor samples collected using snap-frozen collection, OMNIgene•GUT, RNAlater, and AquaStool. No significant variation (CV% < 30%) in the proportion of the dominant genera (>5% OTU relative abundance) in the cores extracted from each collection tube in both Donor 1 and Donor 2 samples. CV, coefficient of variation.
For Donor 1, the dominant genera (>5% OTU relative abundance) found in the cores were Prevotella and Lachnospiracea_incertae_sedis with mean relative abundances of 73.2% and 7.1%, respectively. For Donor 2, the dominant genera found in the cores were Bacteroides, Unidentified genus, Faecalibacterium, and Lachnospiracea_incertae_sedis with mean relative abundances of 32.9%, 15.9%, 16.2%, and 8.0%, respectively.
There was no significant variation (CV% < 30%) in the proportion of the dominant genera in the cores extracted from each collection tube in both Donor 1 and Donor 2 samples (Table 3). This meant that each sample tube that was cored and tested contained a homogenous sample. Although the result was not significant (p > 0.05), it is evident that the cores extracted from the nonhomogenized snap-frozen samples showed a higher CV% compared with the samples stored with stabilizers across all dominant genera. Overall, the highest homogeneity was achieved with RNAlater and OMNIgene•GUT-stabilized samples.
Dominant Genera (>5% Operational Taxonomic Unit Relative Abundance) Found in Donor 1 and Donor 2 Core Samples
CV, coefficient of variation; SD, standard deviation.
Robustness in terms of prefreezing delay
We evaluated the OMNIgene•GUT kit in the scope of robustness in terms of prefreezing delay for up to 2 weeks at RT and compared the results to the snap-frozen collection.
Alpha diversity
The effect of prefreezing delay on fecal microbiota alpha diversity in samples collected with the OMNIgene•GUT kit was assessed based on OTU richness (measured based on the absolute observed number of taxa), diversity (Shannon–Wiener index), and evenness (Simpson's evenness). The results are shown in Figure 7(A–C). The extent of microbiota structural and composition diversities were measured and plotted using (A) OTU richness, (B) Shannon–Weiner diversity index, and (C) Simpson's evenness index. Between-group variations (different prefreezing delay time points) were measured using one-way ANOVA on ranks (Kruskal–Wallis test). OTU richness (p = 0.6247), diversity (p = 0.7932), and evenness (p = 0.7964) did not differ significantly between the different time points (p > 0.05).
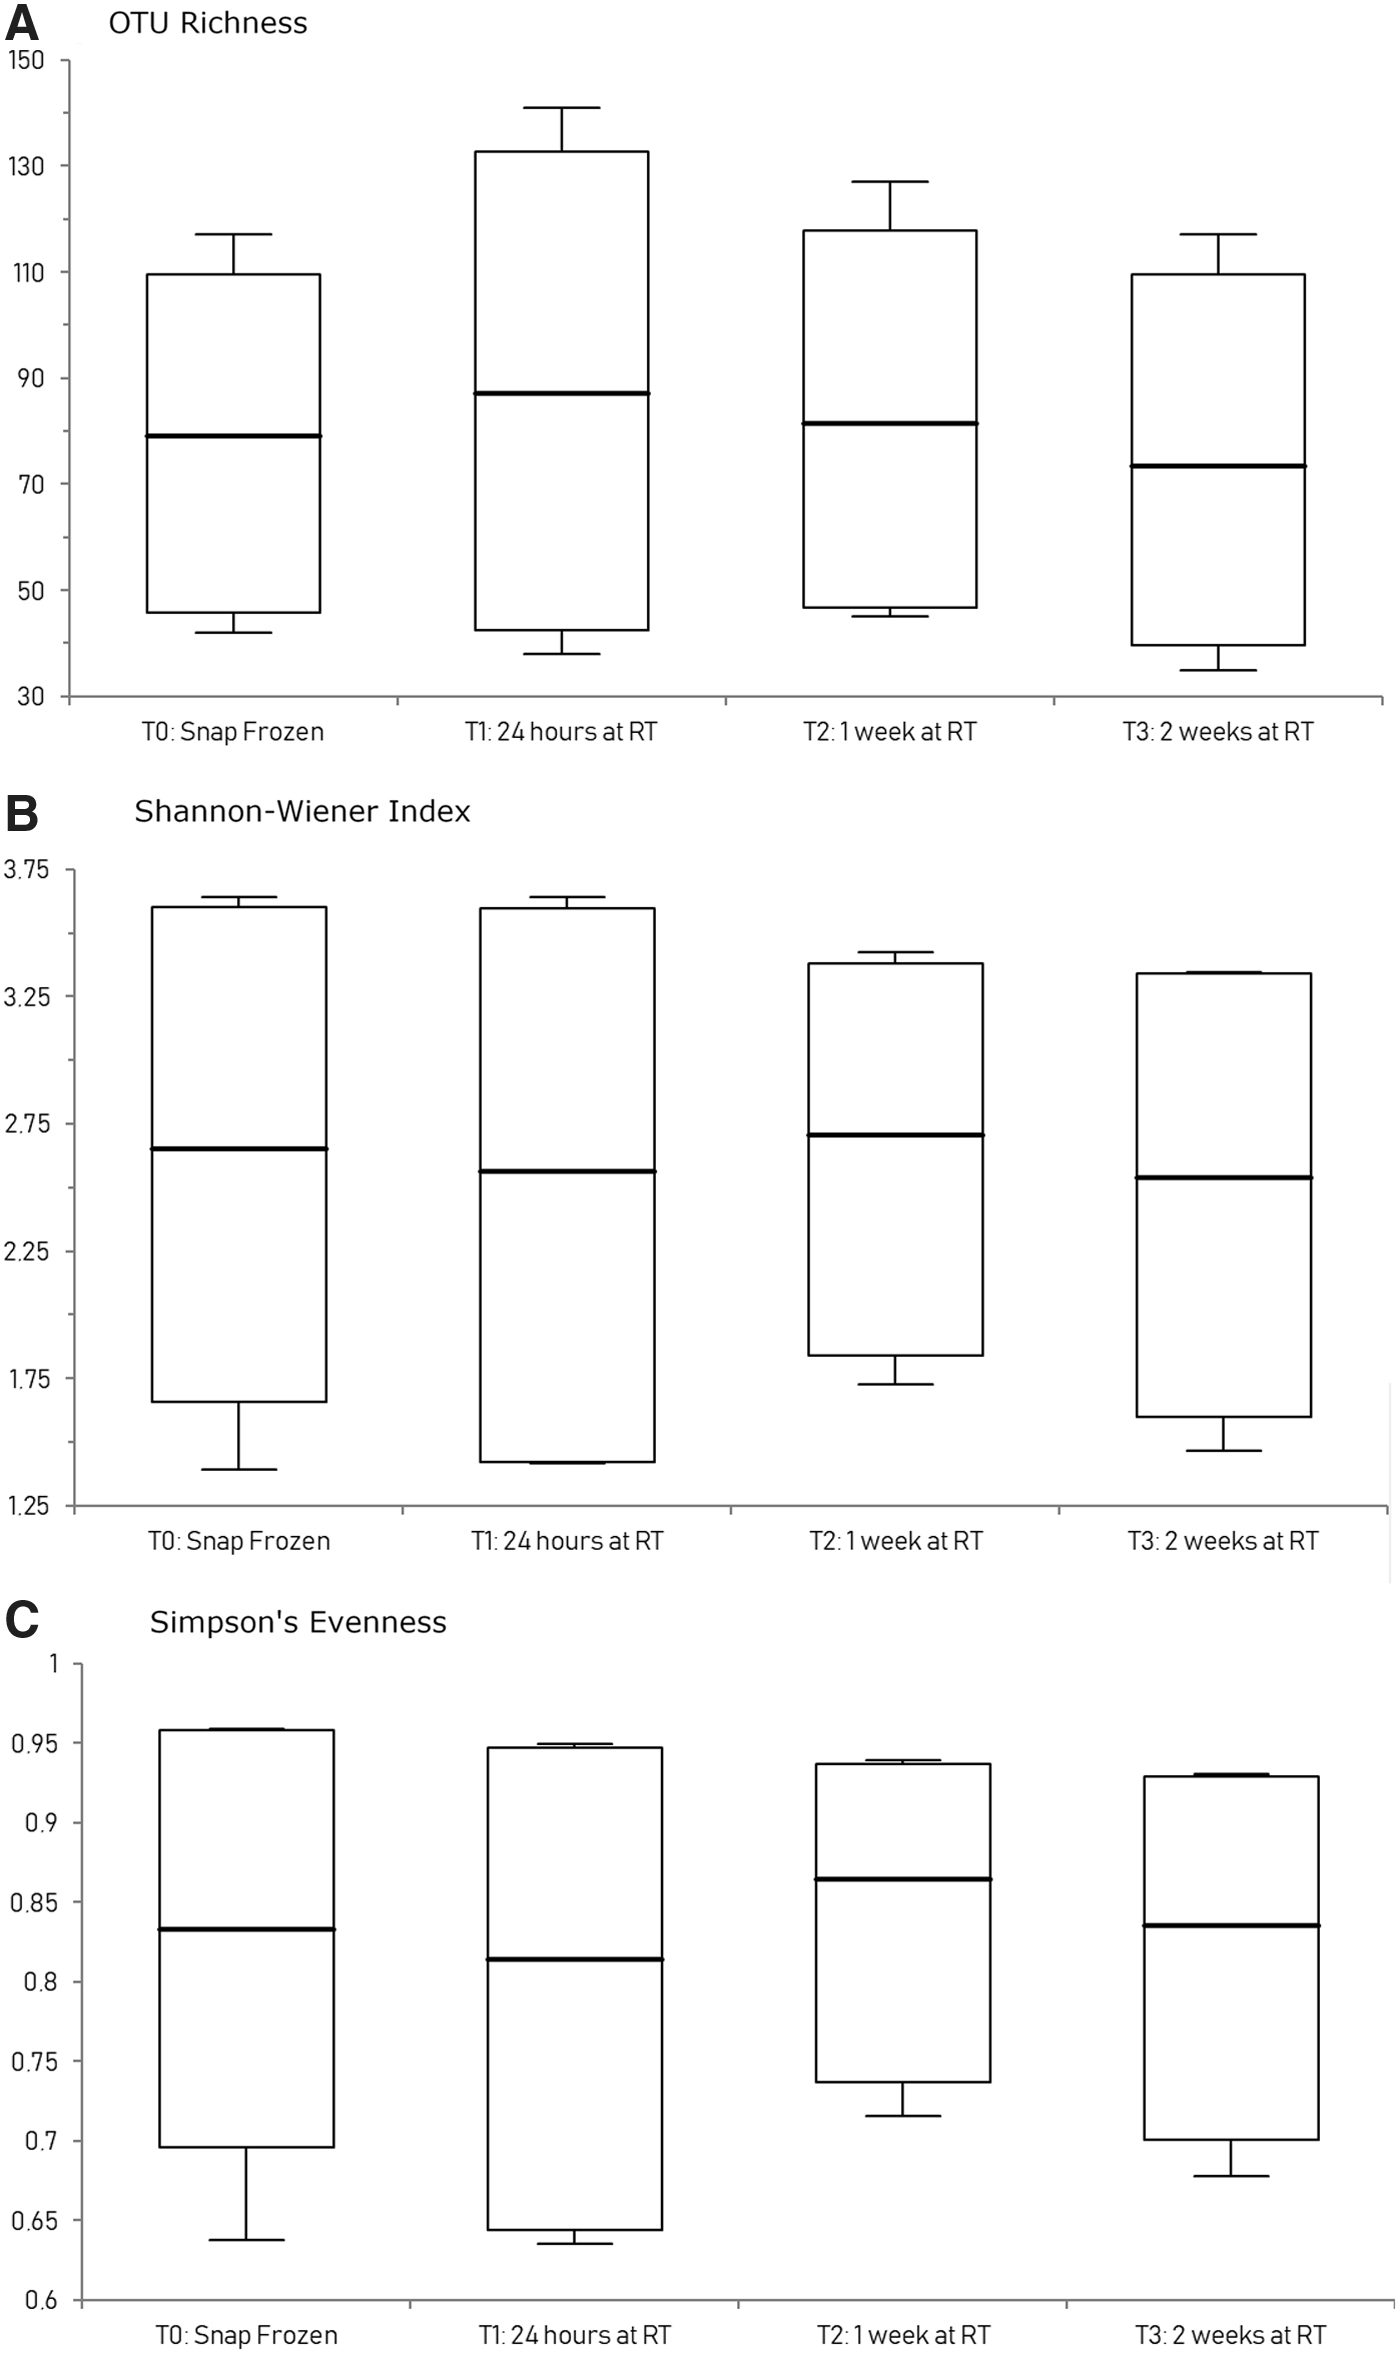
Fecal microbiota alpha diversity following storage under four different time points. OTU richness (p = 0.6247), diversity (p = 0.7932), and evenness (p = 0.7964) did not differ significantly between the different time points (p > 0.5, one-way ANOVA on ranks). ANOVA, analysis of variance.
Genus relative abundance
The comparison of the genus-level OTU relative abundances of two donors' samples stored under four different prefreezing delay time points is shown in Figure 8. For Donor 1, the dominant genera (>5% OTU relative abundance) found in the snap-frozen sample were Prevotella and Bacteroides with mean relative abundances of 80.4% and 5.9%, respectively. For Donor 2, the dominant genera found in the snap-frozen sample were Bacteroides, Unidentified (at the genus level), Lachnospiracea_incertae_sedis, and Clostridium XlVa with mean relative abundances of 47.0%, 18.6%, 7.7%, and 5.9%, respectively.
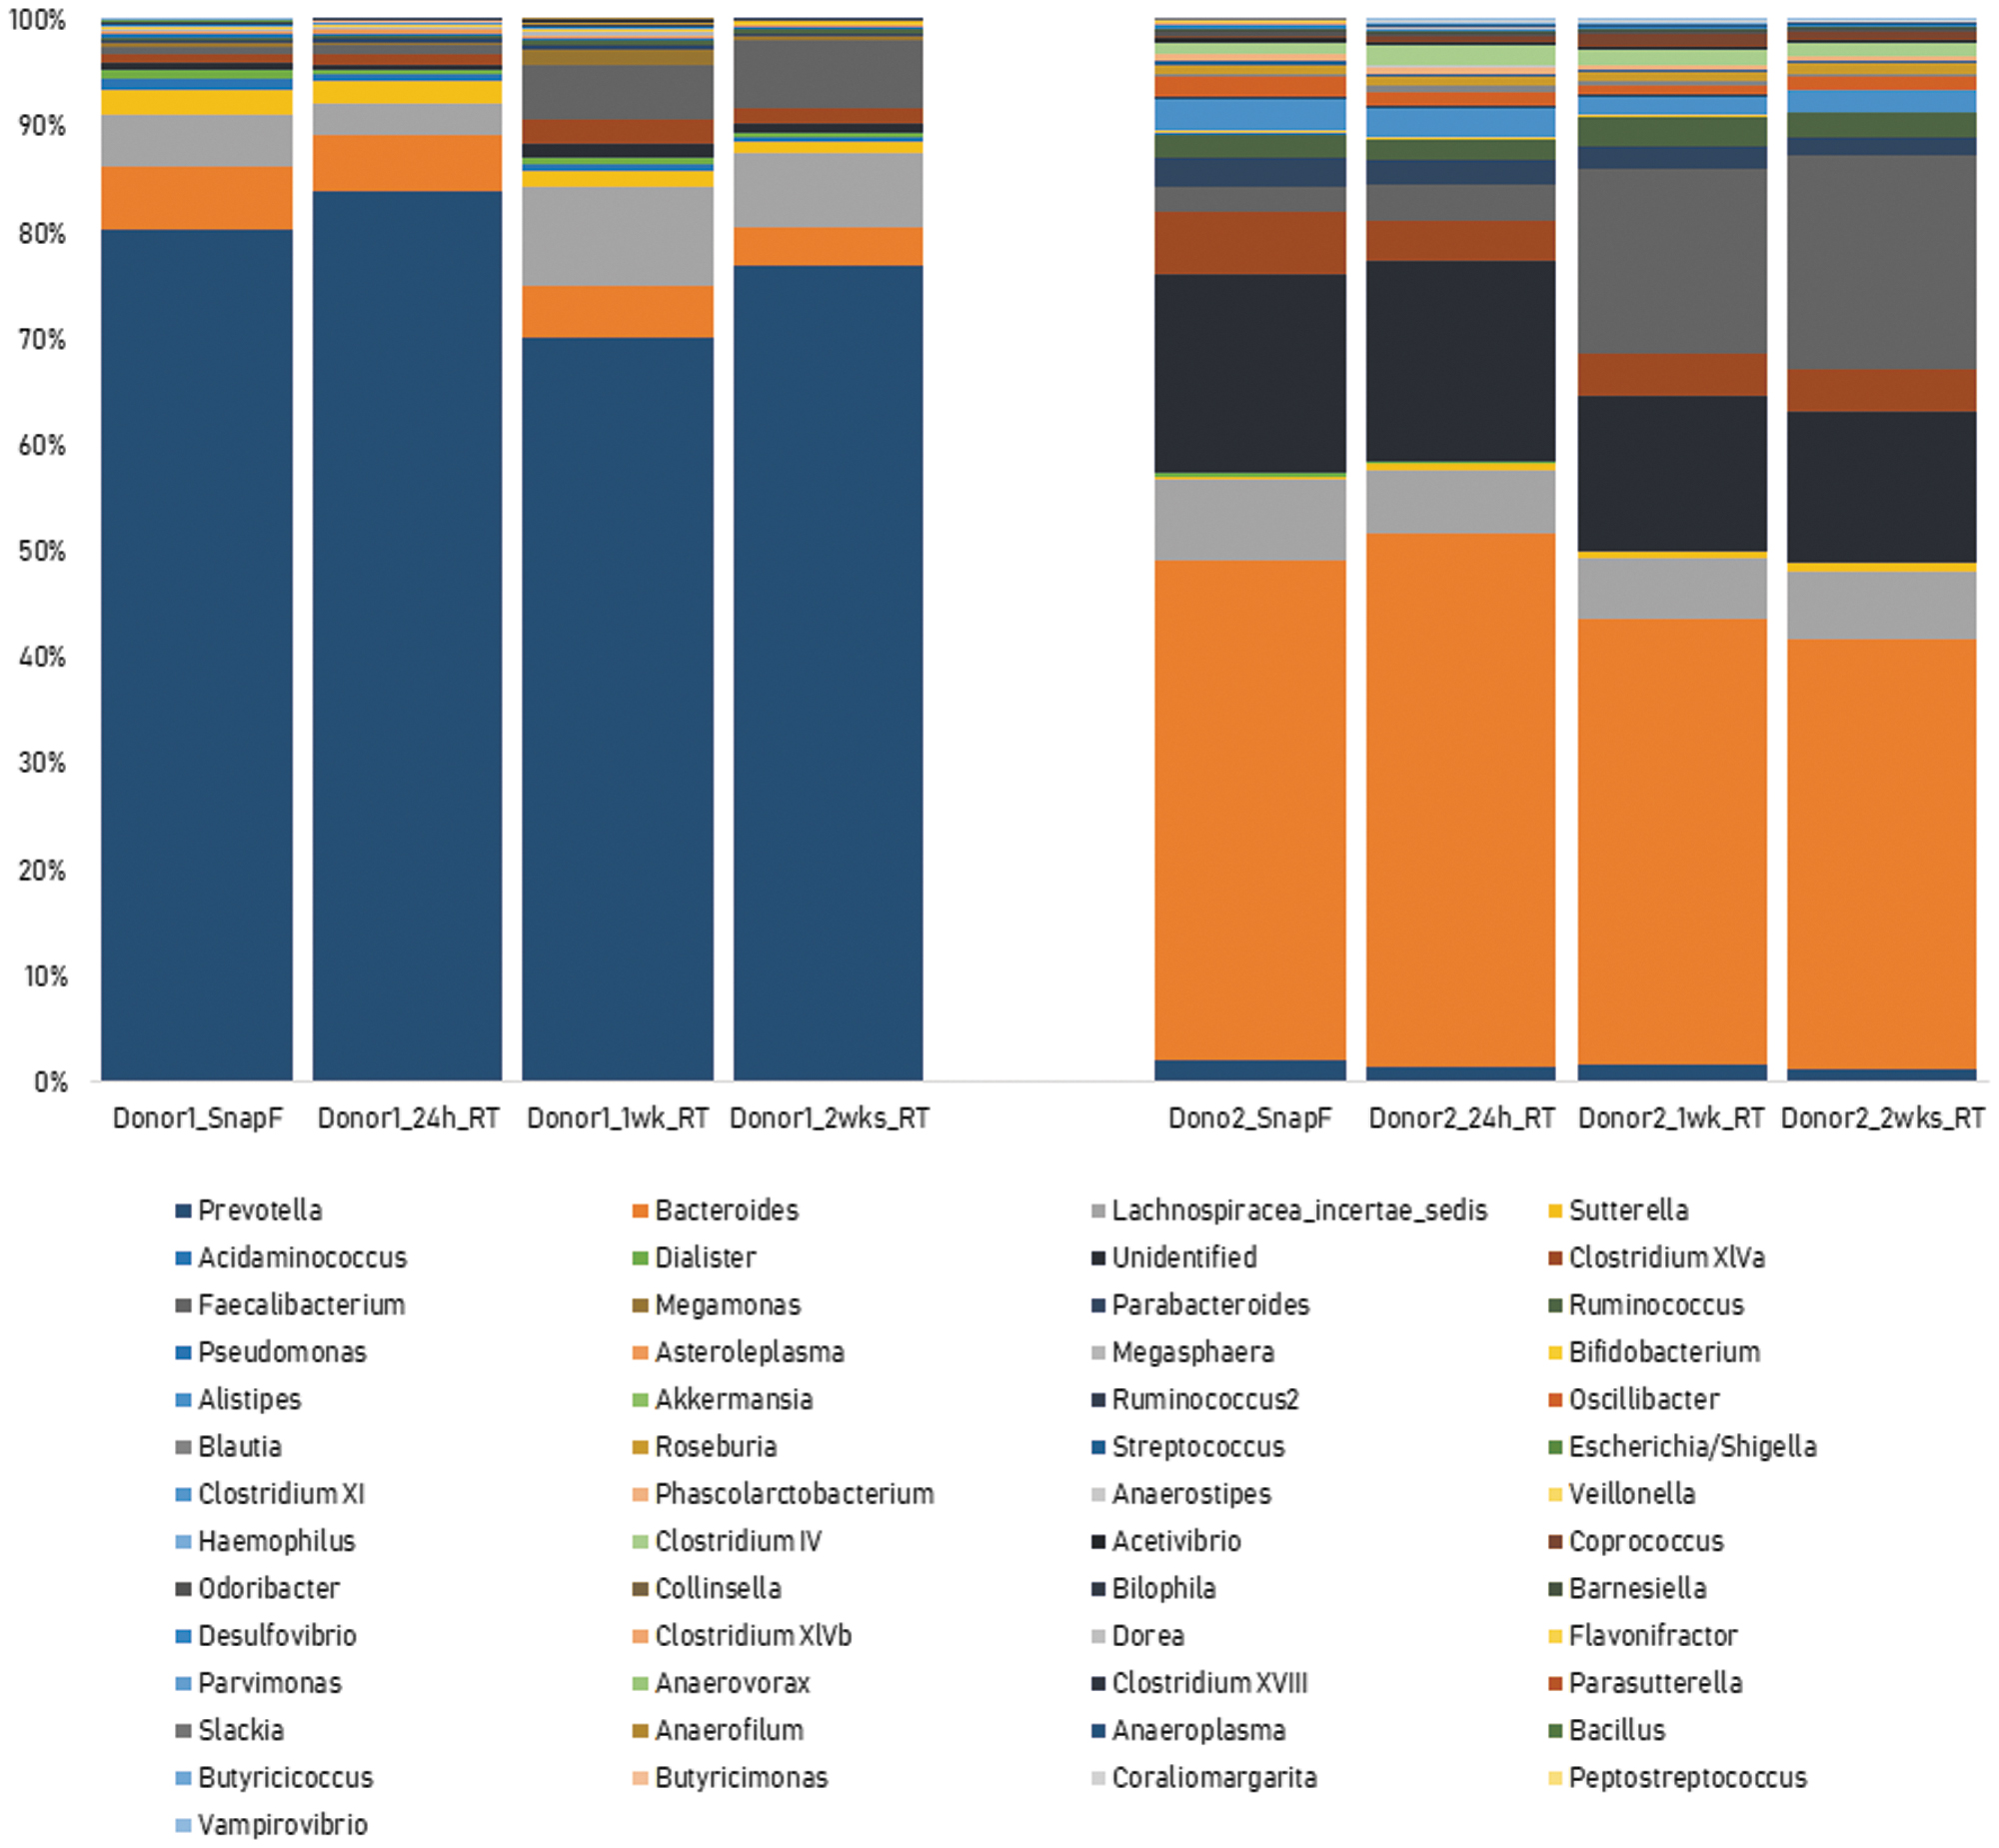
Genus-level microbiome profile of two donor samples following storage under four different time points. No significant variation (CV% < 30%) in the proportion of the dominant genera (>5% OTU relative abundance) when the same samples were stored at room temperature for 24 hours, 1 week and 2 weeks.
There was no significant variation (CV% < 30%) in the proportion of these dominant genera when the same samples were stored at RT for 24 hours, 1 week, and 2 weeks (Fig. 8). This implies that the storage of OMNIgene•GUT-stabilized samples for up to 2 weeks at RT does not produce any significant change in the microbiome profile.
Beta diversity
Finally, to determine if there is no significant difference in the overall microbiome composition among samples from each donor subjected to various prefreezing delays, we performed a PERMANOVA test. The test revealed that the Bray–Curtis dissimilarity between bacterial communities from the two donors was significantly greater (p < 0.05) than the dissimilarity between the samples subjected to various prefreezing delays (p > 0.05). The fecal microbiota alpha diversity remained consistent across the different prefreezing delay time points (Fig. 7A–C).
Sample stability of OMNIgene•GUT-stabilized samples in −80°C
The sample stability of OMNIgene•GUT-stabilized samples was assessed by analyzing the variability of the 16S rRNA gene microbiome profile at −80°C at different time points in a 2-year period. The sample frozen at −80°C which was extracted in triplicates 24 hours postfreezing was used as the baseline. Genus-level relative abundances between the baseline (T0) and after 2 years storage in −80°C (T2) appeared visually similar when examining genera that have relative abundances of >1% (Fig. 9). This was verified statistically by calculating the absolute difference of genus-level OTU relative abundances between T0 and T2 and comparing it against the 0.3 σ analytical combined uncertainty of the method. The results found no significant difference in the relative abundances of the genera (OTU >1%) between T0 and T2 samples (Table 4).
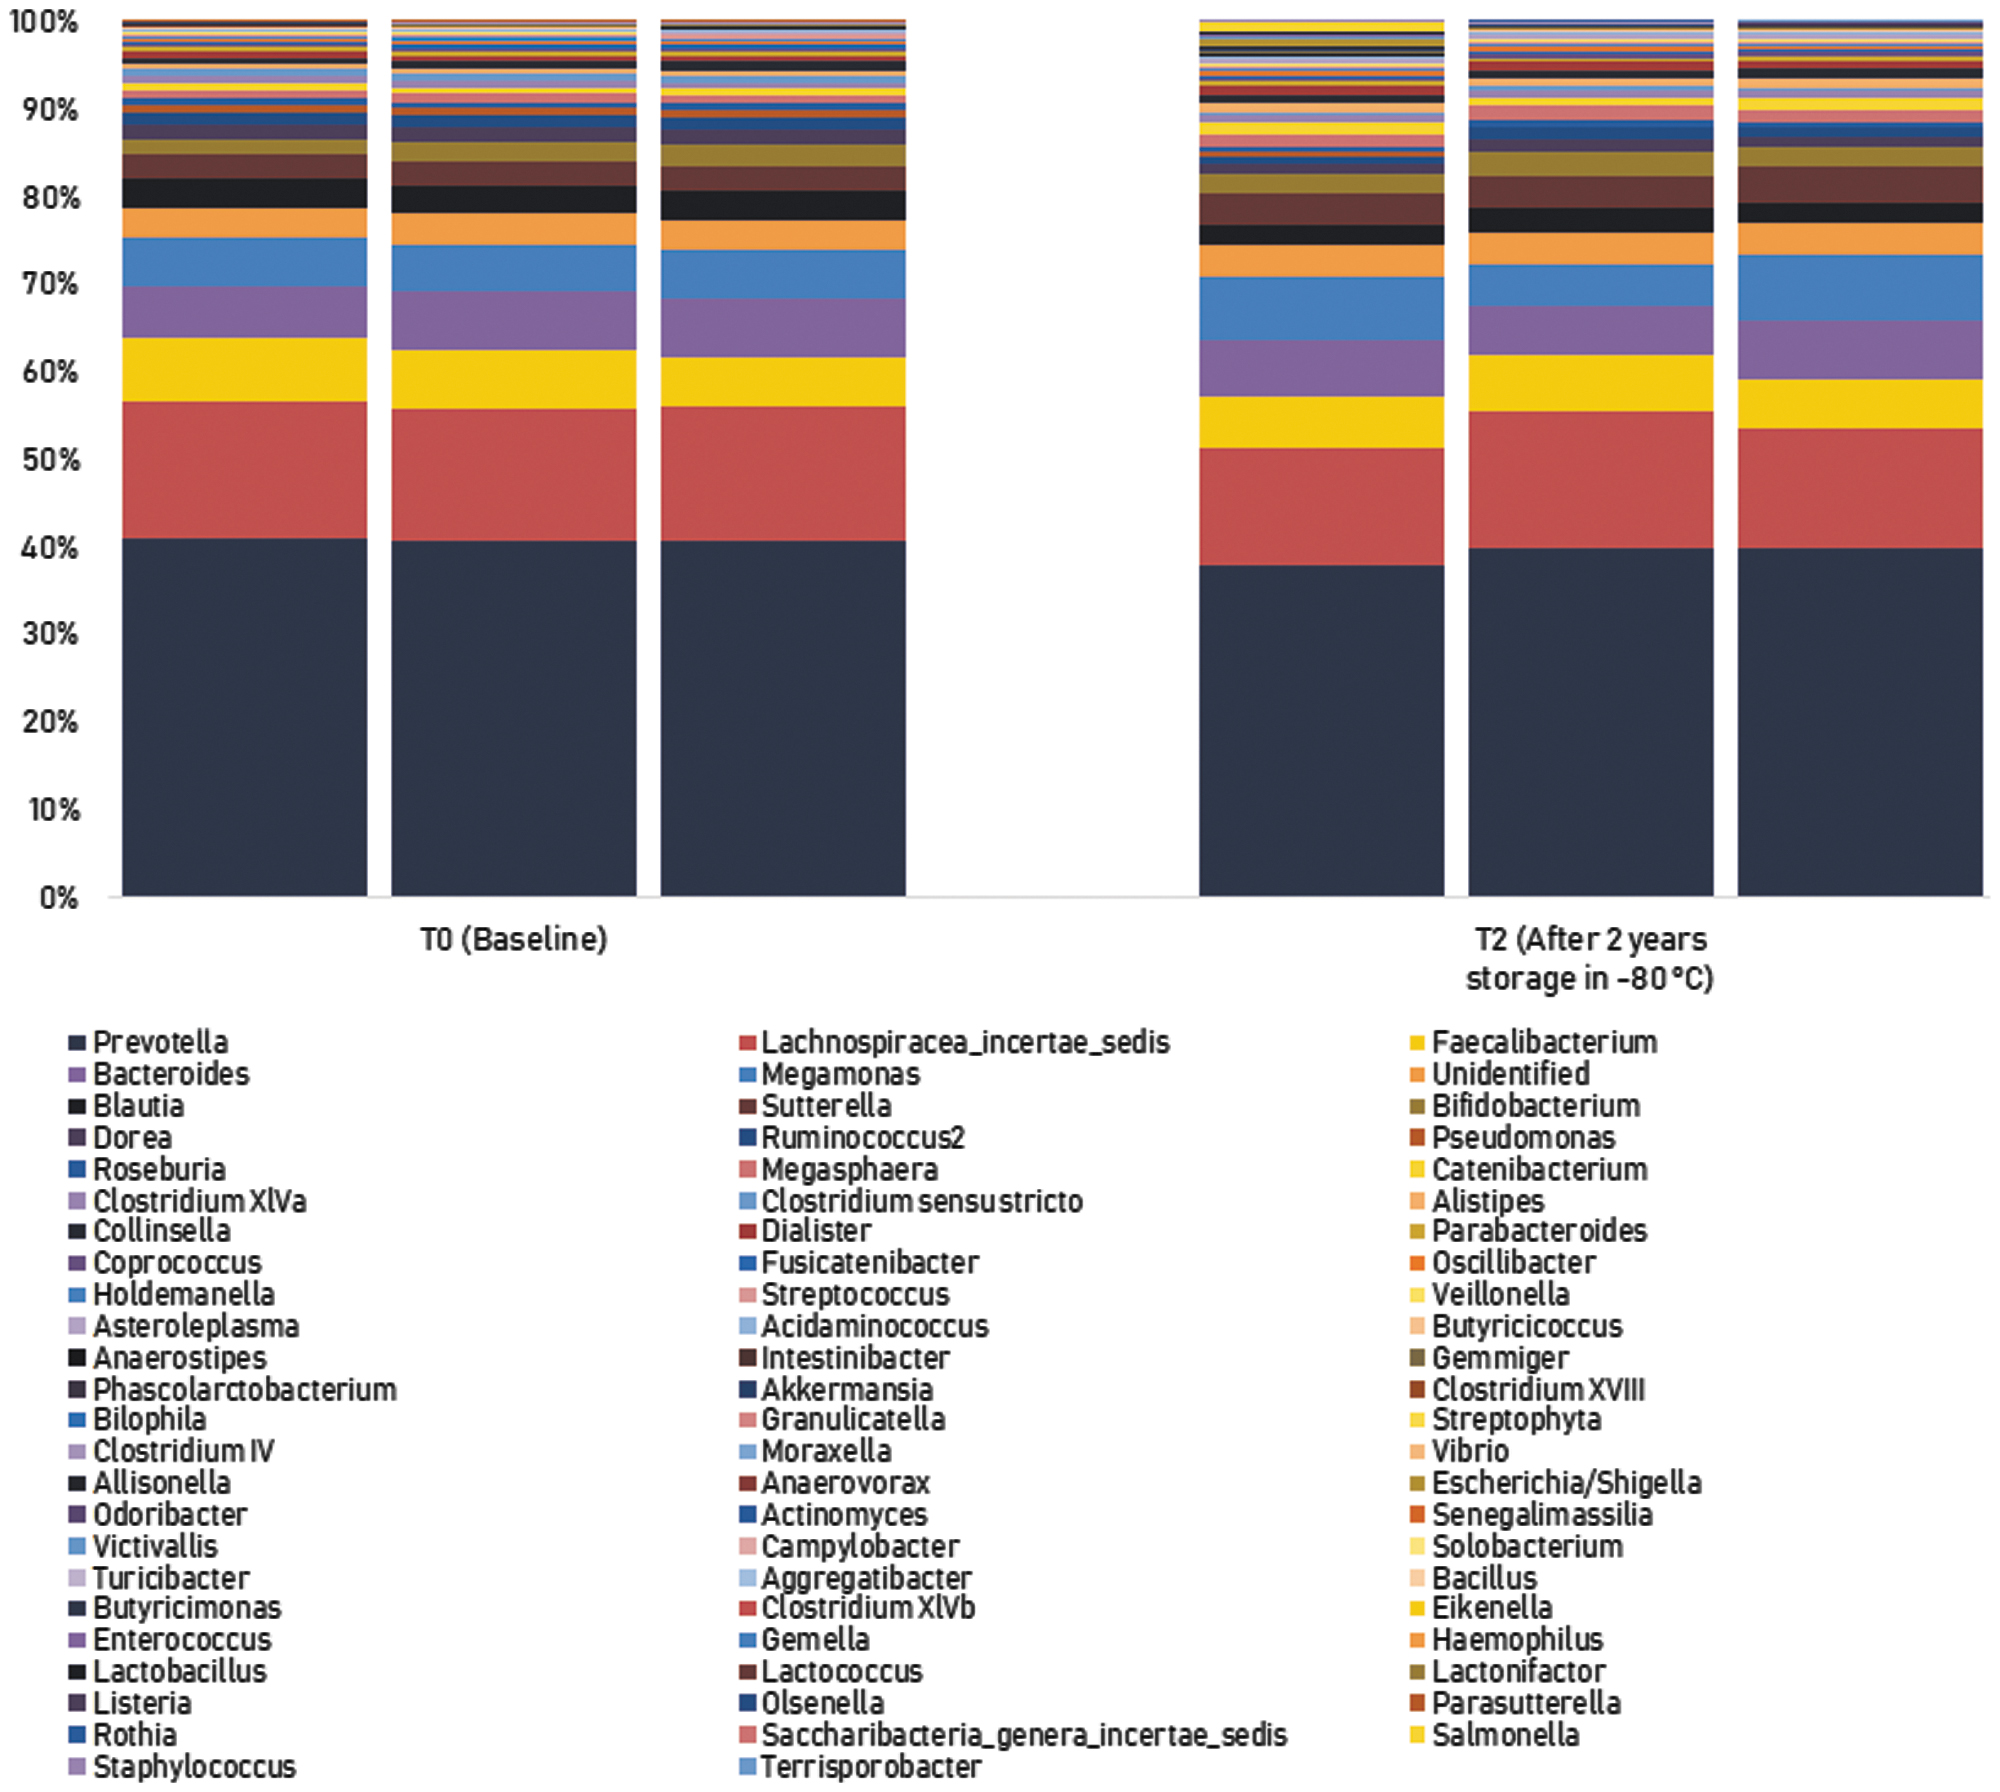
Sample stability of OMNIgene•GUT-stabilized samples after 2 years storage at −80°C (technical triplicates). No significant difference in the relative abundances of the genera (OTU >1%) between T0 and T2 samples.
Comparison of Genera with >1% Relative Abundance in T0 and T2 Stability Samples
T0, baseline sample (snap frozen at −80°C and extracted in triplicates 24 hours postfreezing); T2, after 2 years storage in −80°C.
Discussion
Several stool DNA extraction and collection methods now exist for capturing the gut microbiome profile accurately, allowing investigators to draw reliable conclusions without having the burden of freezing the samples immediately. The purpose of this study was to validate a previously optimized stool DNA extraction method and to compare different associated stool collection methods in terms of fitness-for-purpose for downstream 16S rRNA gene sequencing, robustness, and sample stability.
Previous studies have confirmed that the choice of the stool DNA extraction method has the greatest impact on the accuracy of the downstream results.18–25 Therefore, to control biases and errors arising from the choice of the DNA extraction method, it is crucial to validate the method first with a microbial mock community reference material. These materials have been used in previous studies to test and validate DNA extraction methods, most notably using the Human Microbiome Project (HMP)-derived controls.26,27 However, there is an accessibility limit for the HMP controls, which is set at one item per year. In addition, some HMP controls that were used by researchers before in previous studies are now discontinued.28–29 Therefore in this study, we used the commercially available, regulatory-grade reference material from Zymo Research (D6300). This material consists of eight different bacterial strains representing different cell wall recalcitrance (five gram-positive bacteria and three gram-negative bacteria) to assess bias in DNA extraction caused by uneven cell lysis. The automated DNA extraction using the chemagic MSM I with the DNA Blood 4k kit identified 8 out of 8 expected bacterial genera present in the reference material.
The DNA extraction method was also validated using samples obtained from eight different collection methods. Seven RT collection methods (with or without stabilizer) were compared to the snap-frozen collection in terms of total and double-stranded DNA yields, DNA purity and absence of PCR inhibition, microbiome alpha diversity, and overall microbiome composition. Based on our results, all collection methods were compatible with the chemagic MSM I and showed no significant difference in the microbiome alpha diversity and no significant difference in the overall microbiome composition compared to the baseline snap-frozen stool sample. Although it is apparent that the collection methods varied in producing DNA yields, they had no obvious effect on fecal microbiota alpha diversity, which is in line with the findings of others.30,31 None of the collection methods showed intensive PCR inhibition in the SPUD assay.
However, when we take into account more stringent criteria which include a higher double-stranded DNA yield, higher DNA purity, and absence of PCR inhibition, we recommend the use of OMNIgene•GUT, RNAlater, and AquaStool as alternatives to rapid freezing of samples, while RNAssist, PerkinElmer lysis buffer, and CP-150 are suboptimal. This is because RNAssist resulted in low double-stranded DNA yield, PerkinElmer lysis buffer gave the lowest DNA purity and CP-150 showed a slight inhibition in the SPUD assay. These unfavourable results may pose a problem if we want to use the extracted DNA for whole-genome shotgun sequencing or other methods which require more DNA input and higher quality DNA.
The highest sample homogeneity was achieved with RNAlater- and OMNIgene•GUT-stabilized samples. The method is robust overall to both nonhomogenized snap-frozen samples and homogenized stabilized samples. This result is in agreement with a previous study suggesting that the degree of homogenization does not alter significantly the microbial community composition. 32 Although this is the case, we still highly recommend to homogenize all samples whenever possible, before DNA extraction and long-term storage.
The method is robust to OMNIgene•GUT-stabilized samples stored at RT for up to 2 weeks. Leaving the stabilized samples for 2 weeks at RT did not produce any significant change in the microbiome profile, which is in line with the findings of previous studies.33,34 In addition, according to manufacturer's guidelines, the OMNIgene•GUT kit should allow samples to be kept at RT for up to 60 days and a previous study has shown that the OMNIgene•GUT kit gave similar results after 28 days at RT compared with freshly extracted stool DNA. 33 Therefore, for population and large cohort microbiome studies where cold chain transportation is not feasible, the OMNIgene•GUT kit proved to be suitable as an alternative collection method.
Finally, sample stability after a 2-year storage in −80°C was seen with OMNIgene•GUT-stabilized samples. To our knowledge, this is the first time that this result has been demonstrated. This suggests that isochronous DNA extraction and 16S rRNA gene sequencing can be performed in OMNIgene•GUT-stabilized samples 2 years after freezing in −80°C without any significant impact in the downstream 16S rRNA gene sequencing results.
Conclusion
Sample collection, storage conditions, and DNA extraction method can influence the microbiome profile results. The application of downstream microbiome analyses can only yield valuable insight if the material analyzed truly represents the microbial community at the site sampled. By evaluating the impact of different collection tubes and storage conditions in terms of fitness-for-purpose for downstream microbiome analysis, robustness, and sample stability, we provide an empirical basis for future method validation. Laboratories and biobanks should ensure that the sample collection, storage conditions, and DNA extraction method are systematically recorded in the scope of accreditation.
Footnotes
Acknowledgments
We thank Joël Mossong, PhD and Catherine Ragimbeau, PhD of LNS, Luxembourg for the assistance in the preparation of the DNA extraction QC material.
Author Disclosure Statement
No conflicting financial interests exist.
Funding Information
No funding was received.