
Abstract
Introduction:
Measurements from frozen sample collections are important key indicators in clinical studies. It is a prime concern of biobanks and laboratories to minimize preanalytical bias and variance through standardization. In this study, we aimed at assessing the effects of different freezing and thawing conditions on the reproducibility of medical routine parameters from frozen samples.
Materials and Methods:
In total, 12 pooled samples were generated from leftover lithium heparinized plasma samples from clinical routine testing. Aliquots of the pools were frozen using three freezing methods (in carton box at −80°C, flash freezing in liquid nitrogen, and controlled-rate freezing [CRF]) and stored at −80°C. After 3 days, samples were thawed using two methods (30 minutes at room temperature or water bath at 25°C for 3 minutes). Ten clinical chemistry laboratory parameters were measured before (baseline) and after freeze–thaw treatment: total calcium, potassium, sodium, alanine aminotransferase, lactate dehydrogenase (LDH), lipase, uric acid, albumin, c-reactive protein (CRP), and total protein. We evaluated the influence of the different preanalytical treatments on the test results and compared each condition with nonfrozen baseline measurements.
Results:
We found no significant differences between freezing methods for all tested parameters. Only LDH was significantly affected by thawing with fast-rate thawing being closer to baseline than slow-rate thawing. Potassium, LDH, lipase, uric acid, albumin, and CRP values were significantly changed after freezing and thawing compared with unfrozen samples. The least prominent changes compared with unfrozen baseline measurements were obtained when a CRF protocol of the local biobank and fast thawing was applied. However, the observed changes between baseline and frozen samples were smaller than the measurement uncertainty for 9 of the 10 parameters.
Discussion:
Changes introduced through freezing–thawing were small and not of clinical importance. A slight statistically based preference toward results from slow CRF and fast thawing of plasma being closest to unfrozen samples could be supported.
Introduction
Biological samples are the fundamental source for human biomarker research. Worldwide, biobanks are implementing mechanisms to collect, process, store, and distribute those samples to researchers. Apart from very few successful attempts, only a minute fraction of the innumerous biomarkers has been independently validated.1,2
The preanalytical phase, including collection, transport, and processing before stabilization at low temperature, is the largest source of variation in many studies.3,4 Preanalytical sample variability has been shown to exert significant effects on subsequent study results. Therefore, controlling such variables is pivotal for the future use of samples in personalized medicine for diagnostic or prognostic purposes. 5
Although standardization of the preanalytical phase has been recognized as a key factor for improved sample quality and professional sample utilization, 6 implementation of standards for the whole chain from bedside to cryobench is a cumbersome process that requires continuous adaption to the ever refining sensitivity for detecting preanalytical bias.7,8 Whereas the effects on speed and standardized handling are obvious, the impact of these rather expensive technical optimizations remains unclear. 9 Quite a large number of preanalytical steps have already been identified as affecting sample quality, for example, blood tube types,10,11 room- or refrigerated temperature exposure,12–14 centrifugation conditions, 9 hemolysis and contamination,10,12,15 storage temperatures,16,17 or even complex combinations of the aforementioned conditions. 18
For most clinical studies, cryopreservation of samples is necessary due to specimen sampling over prolonged time ranges, and it is well known that storage at room temperature (RT) influences metabolite stability in plasma and serum.19–21 Several recommendations and guidelines on adequate storing conditions for different matrices used in routine laboratory analysis have been published and applied,22–24 and freezing temperatures for storage of samples are indicated in most publications. Yet, detailed procedures for freezing and thawing are often not mentioned. It has previously been shown that the rate of freezing and thawing has an effect on denaturation of proteins in aqueous solutions 25 and membrane integrity in human cell lines. 26 Freezing rates influence the intra- and extracellular ice formation, may lead to turbidity in serum due to a concentration gradient of solute after crystallization of water and cryoprecipitates, and may cause ice-induced partial unfolding of proteins.25,27,28 However, to the best of our knowledge, so far there are no studies investigating the influence of freezing and thawing rates on standard clinical parameters.
The principal goal of our experiment was to analyze the influence of clinical chemistry laboratory-specific freezing and thawing conditions on 10 standard laboratory parameters that were selected based on their reported temperature sensitivity in literature and representative of a variety of analyte classes.16,29
Materials and Methods
The study was conducted in adherence to the World Medical Association Declaration of Helsinki regarding research involving human subjects. The cantonal ethical review committee in Bern, Switzerland, approved the application of anonymized leftover samples for quality control studies without further ethical consent.
Samples and study design
Anonymized leftover samples from hospitalized patients of the Bern University Hospital, Inselspital, were collected after analysis at the Center for Laboratory Medicine, Bern. The lithium heparinized plasma tubes (S-Monovette; Sarstedt, Nümbrecht, Germany) were stored at 4°C after routine analysis and before collection for this study. Blood collection was done <24 hours before for all specimens. Leftover samples were randomly pooled to balance single high or low values and to gain sufficient volume. Pools were prepared with six patient samples per pool. Twelve heparinized plasma pools were prepared and each pool was divided into seven 525 μL aliquots before further analysis. Aliquots were stored in biobank cryotubes (0.7 mL EXT Jacket Tubes, FluidX; Brooks Life Science Systems, Manchester, Great Britain). Sample size calculations for detecting significant changes of a magnitude of 10% for the chosen analytes with power at least equal to 90% resulted in sample sizes as low as three to five pools for most of the analytes. We chose to raise the sample size to 12 pools to maintain high power for all analytes.
Analysis of routine clinical parameters
A total of 10 standard laboratory parameters were selected due to their reported temperature sensitivity in literature16,29: total calcium, potassium, sodium, alanine aminotransferase (ALAT), lactate dehydrogenase (LDH), lipase, uric acid, albumin, C-reactive protein (CRP), and total protein. Measurements were performed according the guidelines of the Swiss Accreditation Service (SAS) and ISO/IEC 17025. Every day before starting the measurements, each instrument was calibrated according to the manufacturer's protocol. Measurements were made on Cobas 8000 analyzer series (Roche Diagnostics International AG, Rotkreuz, Switzerland). A detailed list of applied analytical methods can be derived from Table 1. Statistical parameters (intraday coefficient of variation [CV], bias and measurement uncertainty [MU]) of each analysis had been determined during method verification. In brief, intraday CV and bias were calculated from two independent quality controls (human sera with constituents added to obtain desired component levels, PreciControl ClinChem Multi 1 and 2; Roche Diagnostics International AG), whereby each quality control sample was analyzed 10 times in series. The overall CV in series was calculated as follows: CV = (measurement number-weighted standard deviation/measurement number-weighted mean) × 100. Bias in series was calculated as percentage deviation of the measured value from its true value (quality control sample level) and the measurement number-weighted mean of the bias was used for further calculation of the MU.
List of Applied Analytical Methods
ALAT, alanine aminotransferase; BCP, bromocresol purple; CRP, C-reactive protein; CV, measurement number-weighted coefficient of variation in series of two levels; ISE, ion-selective electrode; LDH, lactate dehydrogenase; MU, measurement uncertainty.
Baseline measurement
One aliquot of each pool was analyzed immediately after pooling (sample baseline). The measured value for each parameter was assumed to be a reference standard. It was used to assess the influence of different freezing and thawing protocols with varying freezing and thawing rates in comparison with the nonfrozen state of the sample.
Freezing protocols
Simultaneously to baseline measurements, the remaining aliquots of the corresponding pool were randomized and either shock-frozen in liquid nitrogen (sample “snapfreeze”), put into a carton cryobox and stowed away in a conventional −80°C freezer (sample “boxfreeze”) or frozen with a standard controlled-rate freezing (CRF) protocol (sample “biobank”) of the Liquid Biobank Bern (LBB), which is operated by the Center for Laboratory Medicine, Bern. Using the biobank freezing protocol, samples were first precooled to 8°C and then, using a linear gradient, frozen to −15°C with a rate of −3°C/min. Furthermore, the gradient rate was increased to −5°C/min until −50°C and finally, −40°C/min until reaching the −140°C sample end temperature. The “biobank” freezing protocol was performed in an Askion work bench wb230 (ASKION GmbH, Gera, Germany). After the different freezing conditions, all samples were stored in the same freezer at −80°C for 3 days.
Thawing protocols
Three days after freezing of the pooled samples, the influence of fast and slow thawing on the differently frozen samples was examined in two equally frozen aliquots of the same pool. Half of the samples were simultaneously thawed for 30 minutes at RT (air-conditioning set at 23°C ± 1°C), whereas the other half was thawed for 3 minutes in a 25°C tempered water bath, vortexed for 1 minute and analyzed instantly in randomized order. Each sample was completely defrosted after both thawing approaches. A schematic overview of the workflow is shown in Figure 1.
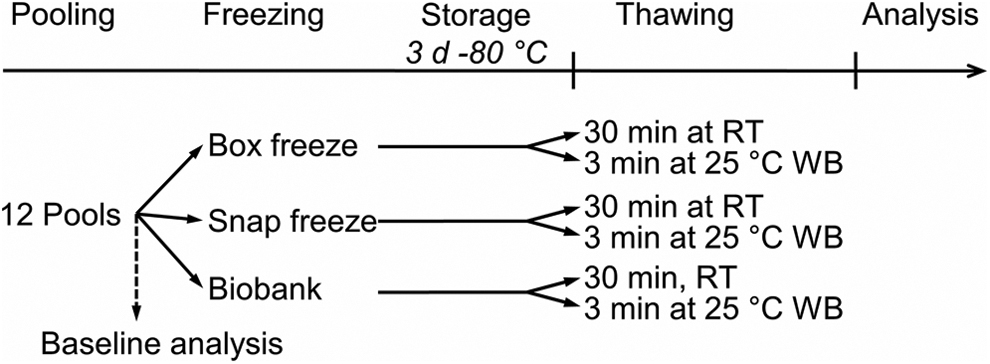
Workflow. RT, room temperature; WB, water bath.
Data analysis
For each analyzed parameter, determination of expanded MU was conducted as follows: MU = k × ((CV 2 + Bias 2 )1/2), whereby k is a coverage factor (1.96) defining the confidence level of 95% for two-sided normally distributed data, CV is the measurement number-weighted mean of the CV in series, and bias is the measurement number-weighted mean of the bias in series as described earlier. Regarding statistical analysis, in a first step, a general linear model set up in a hierarchical structure as a split-unit experiment with the freezing method in the main units and thawing in the split-units was applied to find differences either between the two thawing or the three freezing approaches, or their interaction. In a second step, a general linear model of baseline against the six freezing–thawing combinations comparison was utilized to evaluate the changes of analyzed parameters against the unfrozen baseline. The methods followed properly accommodated the paired setting in the experiment since each pool was subjected to the same freezing and thawing conditions. Pool effects were introduced as random factors in the models; all results are thus adjusted for pool effects. Normality assumptions were checked using the Shapiro–Wilk test. All statistical analyses were performed with R version 3.6.0 (R Core Team, Vienna, Austria, 2019).
Results
Influence of freezing protocols on analyte stability
The experimental set consisted of 10 clinical chemistry parameters, in which samples were frozen in three different ways (put into a carton cryobox in a −80°C freezer = “boxfreeze,” shock-frozen in liquid nitrogen = “snapfreeze,” or using a standard CRF protocol = “biobank”). Small absolute changes in concentration or activity measurements were found, but the split-unit ANOVA analysis yielded no statistically significant changes among “boxfreeze,” “snapfreeze,” or “biobank” conditions for all 10 parameters as summarized in Table 2.
Mean and Standard Deviation of Measurements of the Freezing Methods
A general linear model for a split-unit design was applied to calculate p-values.
BF, boxfreeze; SF, snapfreeze.
Influence of thawing protocols on analyte stability
The influence of two thawing strategies on the 10 clinical chemistry parameters was assessed as follows. Pooled samples were either thawed at RT for 30 minutes (TRT) or in a water bath at 25°C for 3 minutes (TWB). Nine out of the 10 analyzed parameters showed only minor absolute changes and were not statistically different between slow (TRT) or fast (TWB) thawing (Table 3). The analysis of LDH after thawing revealed a significant difference between TRT and TWB (p = 1.07e−5) with slow thawing resulting in higher values than rapid thawing. An interaction effect of freezing upon thawing for LDH analysis was tested using a split-unit ANOVA, which did not detect any significant interaction between freezing and thawing of LDH (p = 0.951).
Mean and Standard Deviation of Measurements of the Thawing Methods
A general linear model for a split-unit design was applied to calculate p-values.
Significant p-values (p < 0.05) were marked in bold.
TRT, 30 minutes at room temperature thawed; TWB, 3 minutes at 25°C tempered water bath thawed.
Comparison of combined freezing and thawing methods with baseline
The six combined freezing and thawing methods in plasma for the 10 parameters were compared with unfrozen baseline measurements to evaluate the alterations in concentration and activity introduced through freezing–thawing. The six tested combinations were “boxfreeze” and thawing at RT (BF/TRT) or in water bath (BF/TWB), “snapfreeze” in liquid nitrogen and thawing at RT (SF/TRT) or in water bath (SF/TWB), and freezing under “biobank” condition with RT (BB/TRT) or water bath (BB/TWB) thawing approaches. A general linear model of baseline against the end result comparison, adjusting for pool effects, was applied and revealed statistically significant differences for potassium (p = 0.002), sodium (p = 0.045), LDH (p < 0.001), lipase (p < 0.001), uric acid (p = 0.039), albumin (p = 0.022), and CRP (p < 0.001). No influence of combined freezing and thawing approaches compared with the concentration or activity values in freshly analyzed plasma aliquots was observed for calcium, ALAT, and total protein (all p > 0.05). Results are shown in Table 4. Overall, absolute changes between freeze–thawed samples and baseline were diagnostically negligible. Statistically significant changes between baseline and all six conditions were, nevertheless, seen for LDH, lipase, and CRP. Concentrations of lipase (max. −5.5% in BB/TWB) and CRP (max. −6.3% in SF/TWB) decreased after treatment, but did not exceed the MU range of the baseline measurement (Fig. 2). LDH concentrations increased after each treatment (max. +8.0% in SF/TRT) compared with baseline and exceeded the MU range of baseline measurements. Potassium decreased slightly under all conditions (max. −1.4% in BF/TRT), but was only statistically altered in five out of six experiments with BB/TWB not showing any significant difference to baseline. Sodium concentrations decreased by a maximum of only −0.7% in SF/TRT compared with baseline. Nevertheless, the changes were significant for SF/TRT, SF/TWB, and BB/TRT. Concentrations of uric acid decreased maximally −0.7% after BF/TRT treatment and were statistically significant changed after BF/TRT, BF/TWB, and SF/TWB. For albumin, the highest deviation from baseline measurements was observed after BB/TRT (−2.3%), which was also the only significant comparison. Measurements for sodium, uric acid, and albumin were all within the MU range of their corresponding baseline results for each tested condition. Overall, of the 10 analyzed parameters 6 significantly differed compared with baseline after SF/TWB and BB/TRT treatment, 5 analytes after BF/TRT, BF/TWB, and SF/TRT, and only 3 analytes changed after BB/TRT treatment.
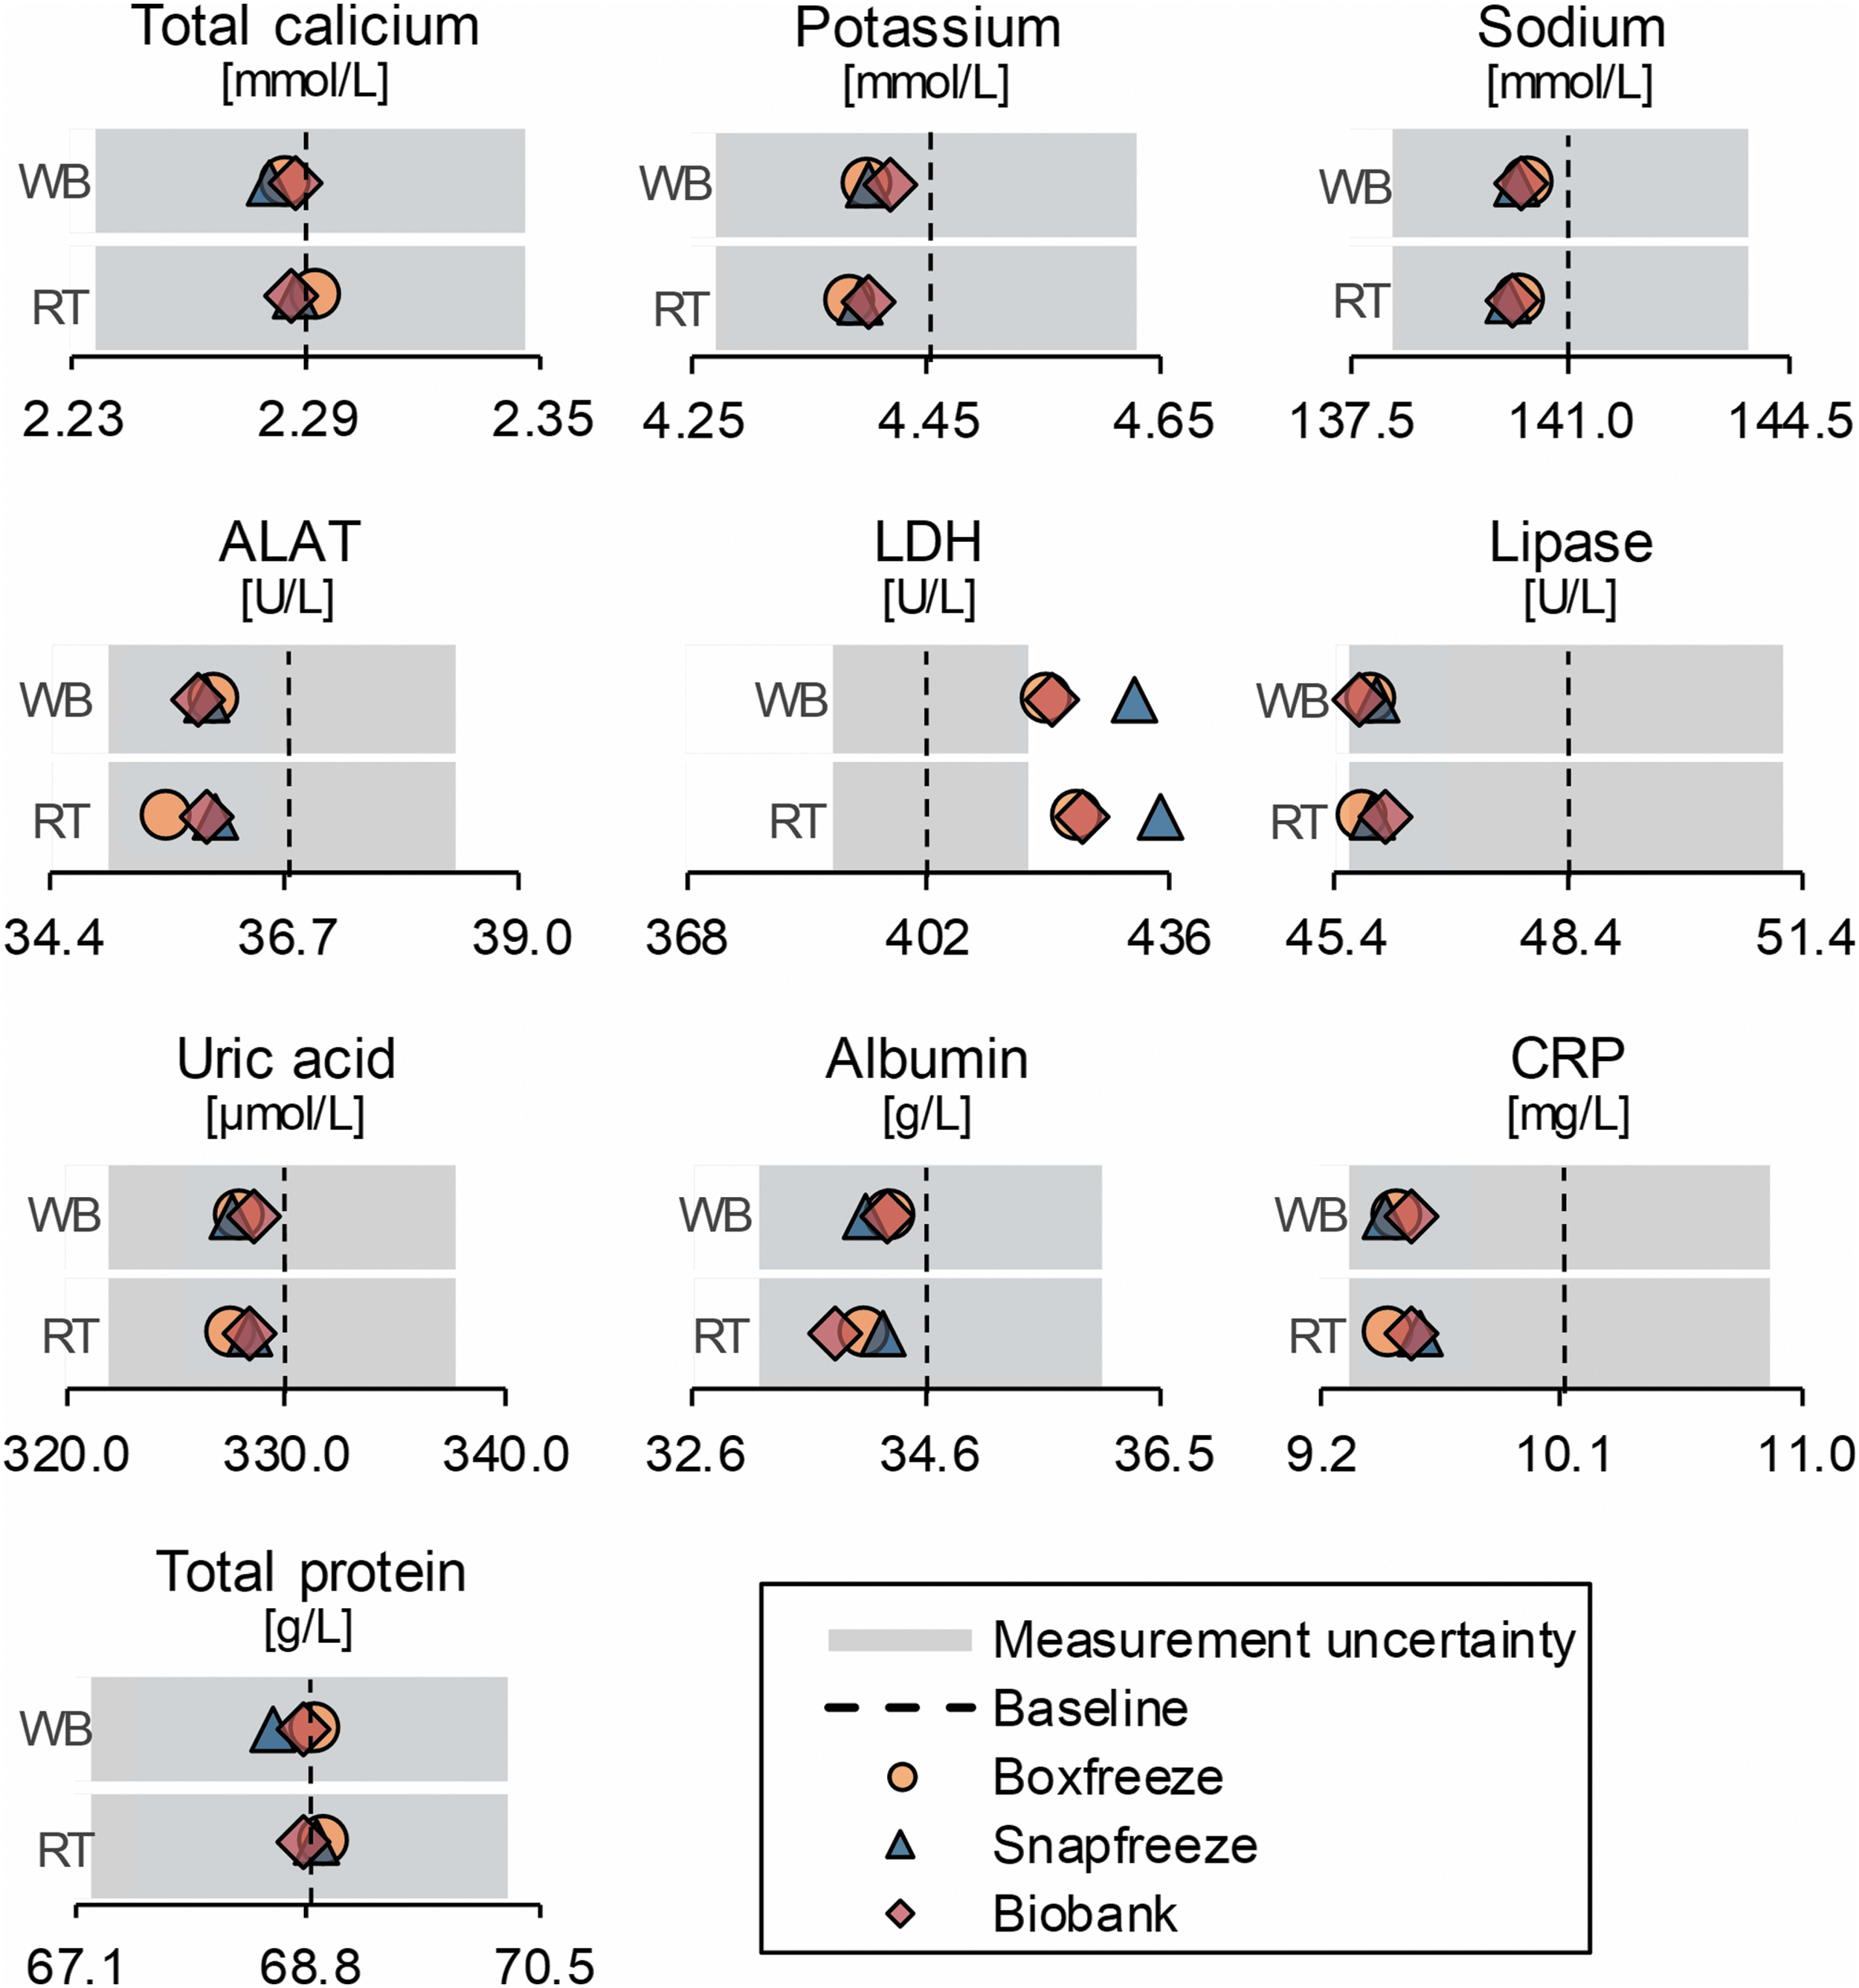
Analysis results of the tested conditions compared with baseline. ALAT, alanine aminotransferase; CRP, c-reactive protein; LDH, lactate dehydrogenase; RT, thawing 30 minutes at room temperature; WB, thawing 3 minutes at 25°C tempered water bath.
Mean and Standard Deviation of Measurements (n = 12)
A general linear model was applied to calculate the overall p-value. Dunnett post hoc tests were applied to evaluate statistically significant differences (p < 0.05) between baseline and applied freezing–thawing method.
Significant p-values (p < 0.05) are marked in bold.
BB, biobank.
Discussion
Two preanalytical factors, which have so far been poorly investigated in the context of biobank sample quality, are the freezing and sample thawing conditions. Prior studies have shown that freeze–thaw cycles might be detrimental for sample quality.30–32 However, with the evolution of faster potentially better sample processing preservation techniques, for example, total laboratory automation or CRF, the influence of different freezing methods (e.g., snap freezing, freezing in a carton box, or CRF) and thawing (at RT or within a temperate water bath) can now be investigated (and with the latest Standard PREanalytical Code (SPREC) update for freezing even be recorded, see Betsou et al.). 7
In our study of 10 clinical chemistry parameters, we did not observe any significant differences among three commonly applied freezing procedures: (1) freezing the samples immediately in liquid nitrogen, (2) storing the samples in a carton box in a −80°C freezer, or (3) using the controlled rate freezing protocol of the local biobank.
Also, no significant differences were observed between two protocols with different thawing rates for the studied analytes: (1) either slowly thawed for 30 minutes at RT or (2) rapid thawing for 3 minutes in a water bath at 25°C. The only thawing affected parameter was LDH, which is known for its freeze–thaw sensitivity. 16
We observed, however, several significant differences between measurements of unfrozen baseline and frozen samples. Only calcium, ALAT, and total protein were now sensitive to each of the applied freeze–thaw procedures, whereas the remaining tested parameters significantly changed after at least one treatment. Each tested treatment led to changes in analyte concentration or activity compared with the unfrozen state of the sample in at least 3 of the 10 tested parameters. The least significant differences across all measured analytes compared with the unfrozen baseline measurements were observed with the protocol consisting of slow freezing using CRF and fast thawing in the water bath. These findings are in line with a previous study reporting identical effects of freezing and thawing rates for LDH, catalase, and alcohol dehydrogenase (ADH). 25 Cao et al. tested the effect of freezing and thawing rates on the activity of the enzymes in five different buffered solutions with fast freezing (60°C/min) showing more deviations than slow freezing (0.8°C/min), and slow thawing (<10°C/min) causing more damage to the proteins than fast thawing (>10°C/min). It remains to be noted that the LDH activity in our study increased after each freeze–thaw treatment, which is in contrast to the findings of Cao et al. This effect could have been due to the increased matrix complexity of blood plasma compared with a buffered solution.
Our results are also in line with findings for freezing–thawing experiments with living cell cultures. Previous studies showed that living cells also benefit from slow and controlled cooling rates due to less amorphous ice structure formation and the fact that fast thawing minimizes the ice recrystallization and protects the cells from damage. 26,27,33
As a limitation of our study, it remains to be stated that the effect size of analytical changes in concentration or activity were comprehensively in a very narrow range (<8%) and were not diagnostically meaningful. The statistical results indicate a slight improvement of freeze–thaw effects compared with unfrozen samples if slow CRF and fast thawing were applied to lithium heparinized plasma; however, the effects of 9 out of 10 tested parameters were within the MU range.
The observed changes between baseline and frozen samples may have been affected by daily calibration of the analytical instruments within a wide range of allowable variability. The intraday variability of the analytical instrumentation is so low that daily calibration according to the accreditation guidelines is introducing observable bias in the form of a higher interday variability. This might be a threat especially for large-scale epidemiological studies, which are measured batchwise on consecutive days. Several solutions to this problem might be reasonable: First is to measure, whenever possible, all samples in one series or batch. Second is to calibrate within a range predefined by the actual technical variation of the measurement instrument. In contrast, what appears as a potential problem is also an impressive proof of technical advancements, with instruments much more stable than required by the guidelines. As a further limitation, pooling of patient samples only yielded, for eight tested parameters, values within reference range. Albumin concentration was slightly below and CRP concentration above reference values. However, both parameters were still within the validated measurement range. An analyte-specific concentration dependency of the susceptibility to preanalytical disturbances should be assumed, especially for analytes influencing the concentration of others, as for example, albumin as a carrier molecule. However, this was not in the focus of our study and indicates the need for subsequent investigations.
Our results are an important indication of the importance of freezing and thawing rates for clinical chemistry parameters, and emphasize the use of slow freezing and fast thawing approaches to minimize the introduced variability.
For our study of 10 clinical parameters in lithium heparinized plasma, we focused on routine clinical chemistry analyses, as these are relatively low cost, widely available, and already measured as “covariates” in many biobanks. Although we observed only minor effects of thawing and freezing conditions for these routine analytes, we hypothesize that freezing and thawing biases may be more problematic for studies using highly sensitive “omics”-technologies, such as proteomics and metabolomics, and thus should be assessed in future studies.
Footnotes
Authors' Contributions
All the authors have accepted responsibility for the entire content of this submitted article and approved submission.
Acknowledgments
We gratefully thank the personnel of the Center of Laboratory Medicine and the Liquid Biobank Bern from the Bern University Hospital (Inselspital) for assistance.
Author Disclosure Statement
No competing financial interests exist.
Funding Information
No funding was received for this article.