




Abstract
The human microbiome encompasses a variety of microorganisms that change dynamically and are in close contact with the body. The microbiome influences health and homeostasis, as well as the immune system, and any significant change in this equilibrium (dysbiosis) triggers both acute and chronic health conditions. Microbiome research has surged, in part, due to advanced sequencing technologies enabling rapid, accurate, and cost-effective identification of the microbiome. A major prerequisite for stool sample collection to study the gut microbiome in longitudinal prospective studies requires standardized protocols that can be easily replicated. However, there are still significant bottlenecks to stool specimen collection that contribute to low patient retention rates in microbiome studies. These barriers are further exacerbated in solid organ transplant recipients where diarrhea is estimated to occur in up to half the patient population. We sought to test two relatively easy sample collection methods (fecal swab and wipes) and compare them to the more cumbersome “gold” standard collection method (scoop) using two different sequencing technologies (16S ribosomal RNA sequencing and shotgun metagenomics). Our comparison of the collection methods shows that both the swabs and the wipes are comparable to the scoop method in terms of bacterial abundance and diversity. The swabs, however, were closer in representation to the scoop and were easier to collect and process compared to the wipes. Potential contamination of the swab and the wipe samples by abundant skin commensals was low in our analysis. Comparison of the two sequencing technologies showed that they were complementary, and that 16S sequencing provided enough coverage to detect and differentiate between bacterial species identified in the collected samples. Our pilot study demonstrates that alternative collection methods for stool sampling are a viable option in clinical applications, such as organ transplant studies. The use of these methods may result in better patient retention recruitment rates in serial microbiome studies.
Introduction
The human microbiome is a complex and dynamic ecosystem, which comprises a variety of microbes in direct contact with the human body. There is increasing evidence that the microbiome plays an important role in the maintenance of homeostasis in health. It is a critical component of nutrition, early childhood and development,1,2 evolution of the immune system,3,4 infectious diseases, 5 and both acute and chronic health conditions. 6 Although it was commonly thought that the number of resident bacteria in the human body outnumbers human cells by a factor of 10, recent thorough review of the literature have revised this number to being closer to 1:1. 7 While these numbers have been revised, it does not take away the importance of the role the microbiome plays in influencing the health of the host.
A recent study has established that there are ∼2000 species of bacteria in the human gut. 8 Such studies created an early “blueprint” of the human gut that led to a better understanding of health and can better guide the diagnosis and treatment of diseases. In most cases, there is a symbiosis or equilibrium between the host and its microbiome, but a significant change in this equilibrium, known as “dysbiosis,” triggers disease or can be triggered by disease. While it was previously thought that the resident microbes in the human body were just innocent bystanders, there is a now a better understanding of their roles in influencing human health and behavior.
Conversely, the microbial populations in our body are also influenced by our health, nutrition, behavior, and lifestyles, leading to a complex, but interactive ecosystem that is in danger of dysbiosis by changes to any of these factors. In the last 20 years, there has been a 10-fold increase in the number of microbiome-related studies. Interest in studying the microbiome has surged, primarily due to availability of advanced technologies, especially in the realm of sequencing, which have enabled rapid, accurate, and cost-effective identification of the constituents of the microbiome. 9 A major prerequisite for the incorporation of fecal (stool) sample collections into longitudinal prospective studies requires the standardized protocols that can be replicated easily without the introduction of bias in downstream analyses.
However, there are barriers to stool specimen collection and return that lead to high attrition rates in microbiome studies. A major limitation is the “ick” factor, or the embarrassment of fecal sample collection, especially with standard collection methods that require the use of a plastic toilet hat for collection of stool and then scooping samples into a collection vial, which is cumbersome and intimidating for many patients. Earlier studies have looked at the effects and the patient perspective of sample collection and motivation to complete a stool sample for health screening and have found additional factors affecting the successful completion of a stool sample collection.10–12 These include feeling healthy, fear of test results, lack of time, concerns of mailing samples, and misinterpretation of sample collection instructions. Collection issues are further complicated in solid organ transplant recipients where diarrhea is estimated to occur in up to 50% of patients.13–16
In this pilot study, we sought to test three different fecal sample collection methods by (i) a standard collection kit using a toilet hat and scoop for fecal collection (standard collection/scoop), (ii) fecal swabs (swab), and (iii) moist wipes (wipe), which all differ in ease of sample collection. All samples were collected into DNA/RNA shield fecal stabilization liquid. The resulting microbiomes were compared using both 16S rRNA (ribosomal RNA) sequencing, restricted to bacteria and archaea, as well as the more comprehensive shotgun metagenomics sequencing, which offers unrestricted sequencing of all representative genomes in a sample. We hypothesized that the data from fecal swabs and wipes would be comparable in quality and replicate the standard scoop collection, thereby potentially increasing patient compliance for stool sample collection and lower attrition rates in gut microbiome studies in solid organ transplant populations.
Another question that we wanted to address is what additive information shotgun sequencing adds, which cannot be addressed by 16S sequencing. This is important, especially in the context of the higher costs and complexities in data analysis that are associated with shotgun sequencing. Therefore, all samples in the study were sequenced and analyzed using both the 16S and the metagenomic sequencing pipelines.
Materials and Methods
Study subjects
The pilot study collected six fecal samples from four healthy volunteers (three male and one female), and from one kidney transplant recipient (male) and one liver transplant recipient (female). Informed consent was obtained from all subjects in the study as per IRB protocols and under the auspices of the Scripps Clinic Biorepository (IRB-14-6499).
Kit assembly
Volunteers and patients were provided kits with the following components for fecal sample collection: two counts fecal swabs in 2 mL DNA/RNA shield, two counts fecal scoop in 9 mL DNA/RNA shield, and two counts sterile dry wipes and 15 mL wide mouth tube filled with 5 mL DNA/RNA shield. The kit also contained two counts alcohol sterilization wipes, two counts nitrile gloves, and a sterile toilet hat for collection of stools. A total of 36 samples were collected [6 subjects × 3 collection methods × 2 (duplicate) samples]. Sample collection protocol is shown in Supplementary Data. A picture of the collection kit and its components are shown in Supplementary Figure S1.
DNA extraction
Fecal samples were resuspended in Zymo DNA/RNA shield by tube inversion and vortexing. Two hundred microliters of each sample was taken in to the Qiagen DNeasy Powersoil Pro kit for DNA extraction. After extraction, samples were quantified for concentration of double-stranded DNA by the Qubit hsDNA assay. Extractions were performed in four batches (randomized to include both volunteer and patient samples).
16S rRNA sequencing
16S rRNA sequencing was performed using the Bioo Scientific NEXTflex 16S V4 Amplicon sequencing kit 2.0. Briefly, 14 ng of each sample was amplified with 16SV4 PCR I Primer mix, for eight cycles. They were then purified with Ampure XP Magnetic Beads. The purified products were then amplified with NEXTflex PCR II Barcoded Primer mix, 13 cycles. They were once again purified with Ampure beads and quantified using the Qubit assay. Samples were then pooled and loaded on an Illumina MiSeq v3, 2 × 300 cycle kit for sequencing on an Illumina MiSeq sequencer.
Shotgun metagenomic sequencing
Library preparation for shotgun sequencing was done using the NEBNext Ultra II DNA Library Prep Kit for Illumina. Briefly, 10 ng of each sample was added in a reaction for end-repair, A-tail, and ligating the Illumina universal adaptor. Ampure XP Magnetic Beads were used to size select a 400–500 bp insert. The insert was taken into 10 cycles of polymerase chain reaction (PCR) amplification using the Kapa Biosytems Library amplification ready mix. Products were cleaned once again using Ampure XP Magnetic Beads and quantified using the Qubit dSDNA HS Assay Kit. Pooled samples were loaded on an Illumina NextSeq 500 Flowcell v2.5 and sequenced at 2 × 75 bp reads lengths.
Statistical analyses
FastQ files from both 16S and metagenomic shotgun sequencing were analyzed using the proprietary software package from CosmosID. Briefly, the software uses a high-performance data-mining k-mer algorithm that rapidly disambiguates millions of short sequence reads into the discrete genomes engendering the sequences. The pipeline consists of two different comparison modules: the first consists of a precomputation phase for reference databases and the second is a per-sample computation. The input to the precomputation phase is through databases of reference genomes, virulence markers, and antimicrobial resistance markers that are continuously curated by CosmosID scientists. The second comparison is a per-sample computational phase that searches millions of short sequence reads, or alternatively contigs from draft de novo assemblies, against the fingerprint sets. This enables both sensitive and precise detection and taxonomic classification of the microbial sequencing reads. Relative abundance of bacterial species was calculated based on the number of organism specific k-mers and their observed frequency in each sample, which was then normalized to represent the abundance of each organism. Of note, the cosmosID methodology for bacterial detection using both 16S as well as metagenomic sequencing uses the kmer algorithm, which can identify 16S sequencing down to the species level, but cannot identify strains accurately, and therefore, we refer to the 16S results identified as species. 16S samples were normalized by subsampling at 125k reads per sample as determined by sample read distribution. Metagenomics reads were subsampled at 20M reads per sample. Clustering analysis, venn diagrams, and heat maps were generated using the Partek Genomics Suite software version 7.0.
Results
16S rRNA sequencing
Out of the potential 36 samples, 33 had adequate DNA to be sequenced (12 scoop, 11 swab, and 10 wipe). The median number of reads for all samples was 239,061, and sample reads ranged from 42,000 to 337,000. Data normalization was done by subsampling using a cutoff of 125,000 reads, which was chosen based on the distribution of reads across samples. All samples were subsequently subsampled at 125,000 reads. After subsampling, one sample (Volunteer 4 wipe) was excluded as it was detected as both an outlier using a principal components analysis (PCA) as well as having low counts. Therefore, a total of 32 samples were used for final analysis (12 scoop, 11 swab, and 9 wipe).
Figure 1a shows the PCA plot for the samples based on patient ID, where both patient samples clearly separate from the volunteer samples. In addition, all patient and volunteer samples cluster quite distinct from each other. Figure 1b shows the PCA plot for all the samples based on the collection method used. Duplicate collections clearly clustered together showing that the collections were robust. The only wipe collected from volunteer 4 clustered separately from the rest of the volunteer 4 samples. Bacterial abundances were calculated based on identification at the species level based on operational taxonomic units (OTU) relative abundances. Of a total of 238 bacterial species that were identified, many of them had very few counts leading to a low relative abundance. We therefore used a filter for a minimum of at least 1% abundance across all samples, which resulted in a filtered list of 65 bacterial species that mapped to 54 genera.
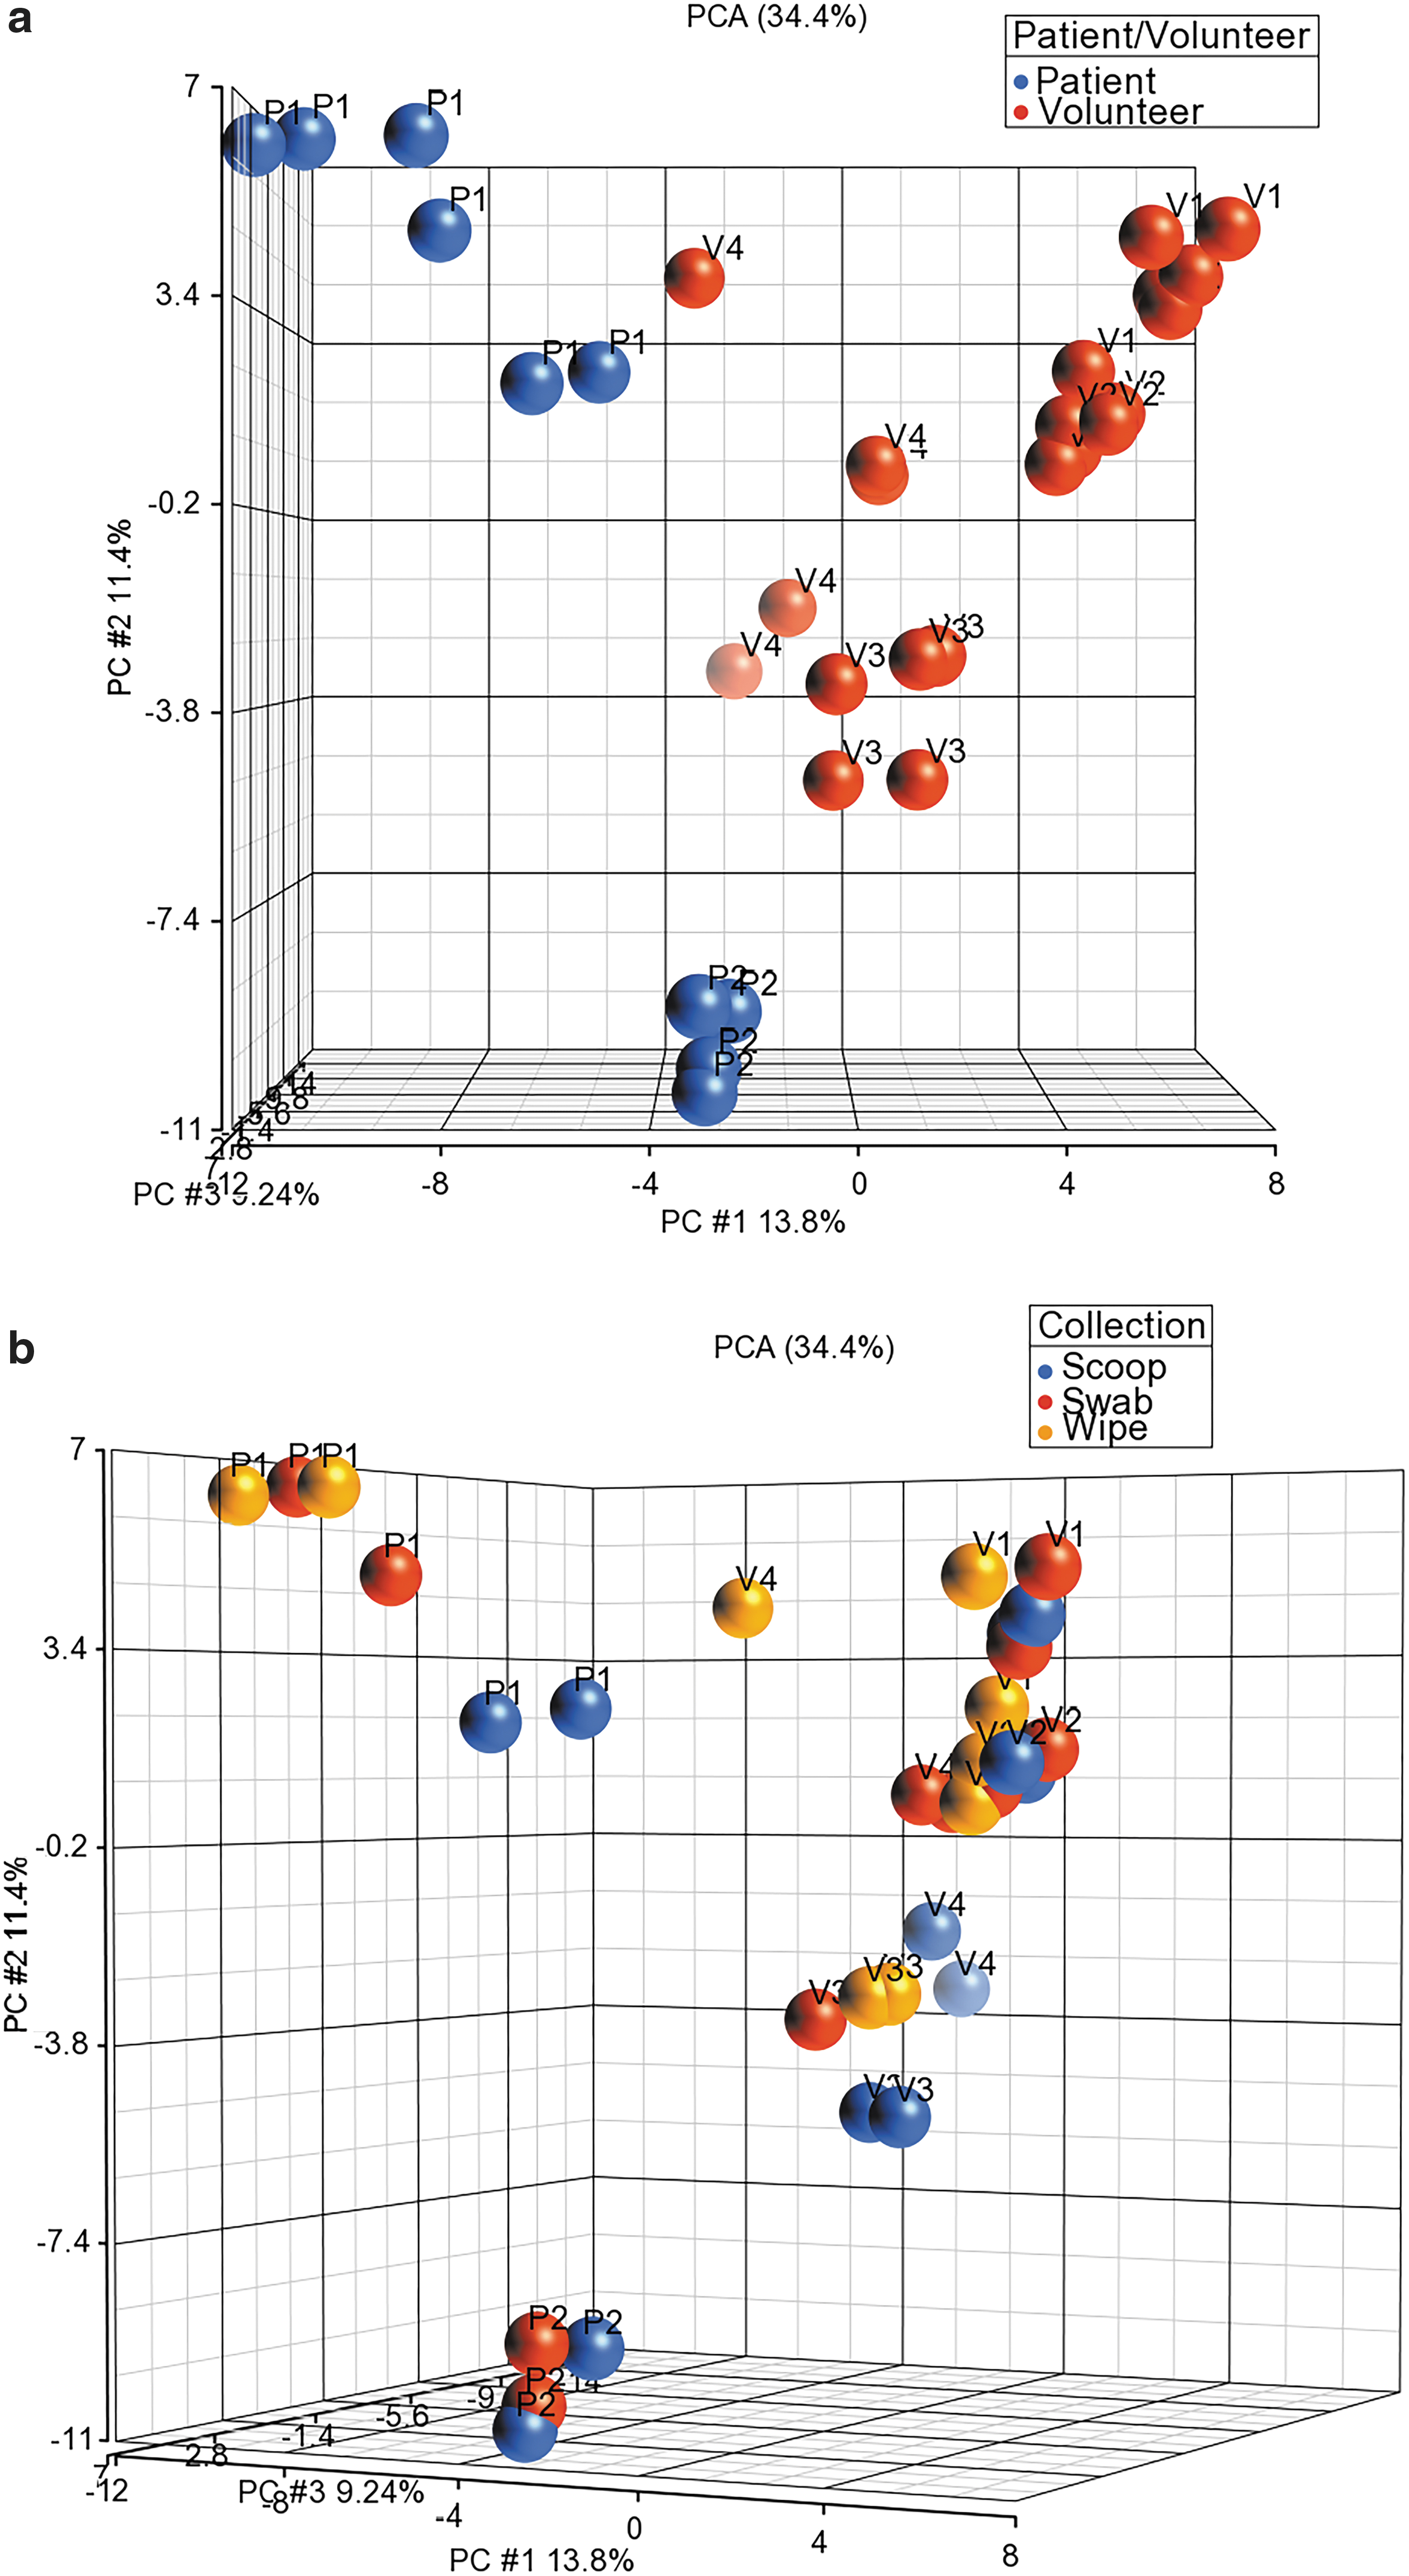
Figure 2 shows the heat map of the 65 bacterial species. It is evident that the profiles of the two patient samples are dissimilar to that of the volunteers. In addition, there is a degree of heterogeneity in the bacterial profiles among the volunteers. To summarize the diversity in the population, we used the Shannon index, which is commonly utilized to look at population diversity in microbial samples. 17

Heat map of the 65 bacterial species identified by 16S sequencing after filtering reads for abundance.
Figure 3a shows the dot plots of alpha diversity from the three sample collection methods, where all methods seem to capture the population diversity similarly, with the exception of the swab from patient 1, which shows a higher amount of diversity compared to the other two collection methods. The boxplots of the Shannon diversity index shown in Figure 3b suggests that the swab and the wipe are diverse in their populations compared to the scoop, but these differences were not statistically significant. We also wanted to look at the beta diversity, which shows how different these collection methods are and calculates the distance or dissimilarity between each sample pair. This is done by creating a principal coordinate analysis plot (PCoA) using the Bray-Curtis method, which takes abundance into account for the visualization of the data in a 3D matrix. The distances between the samples give an estimate of how different or how connected they are. Samples closer to each other suggest similarity between those samples.
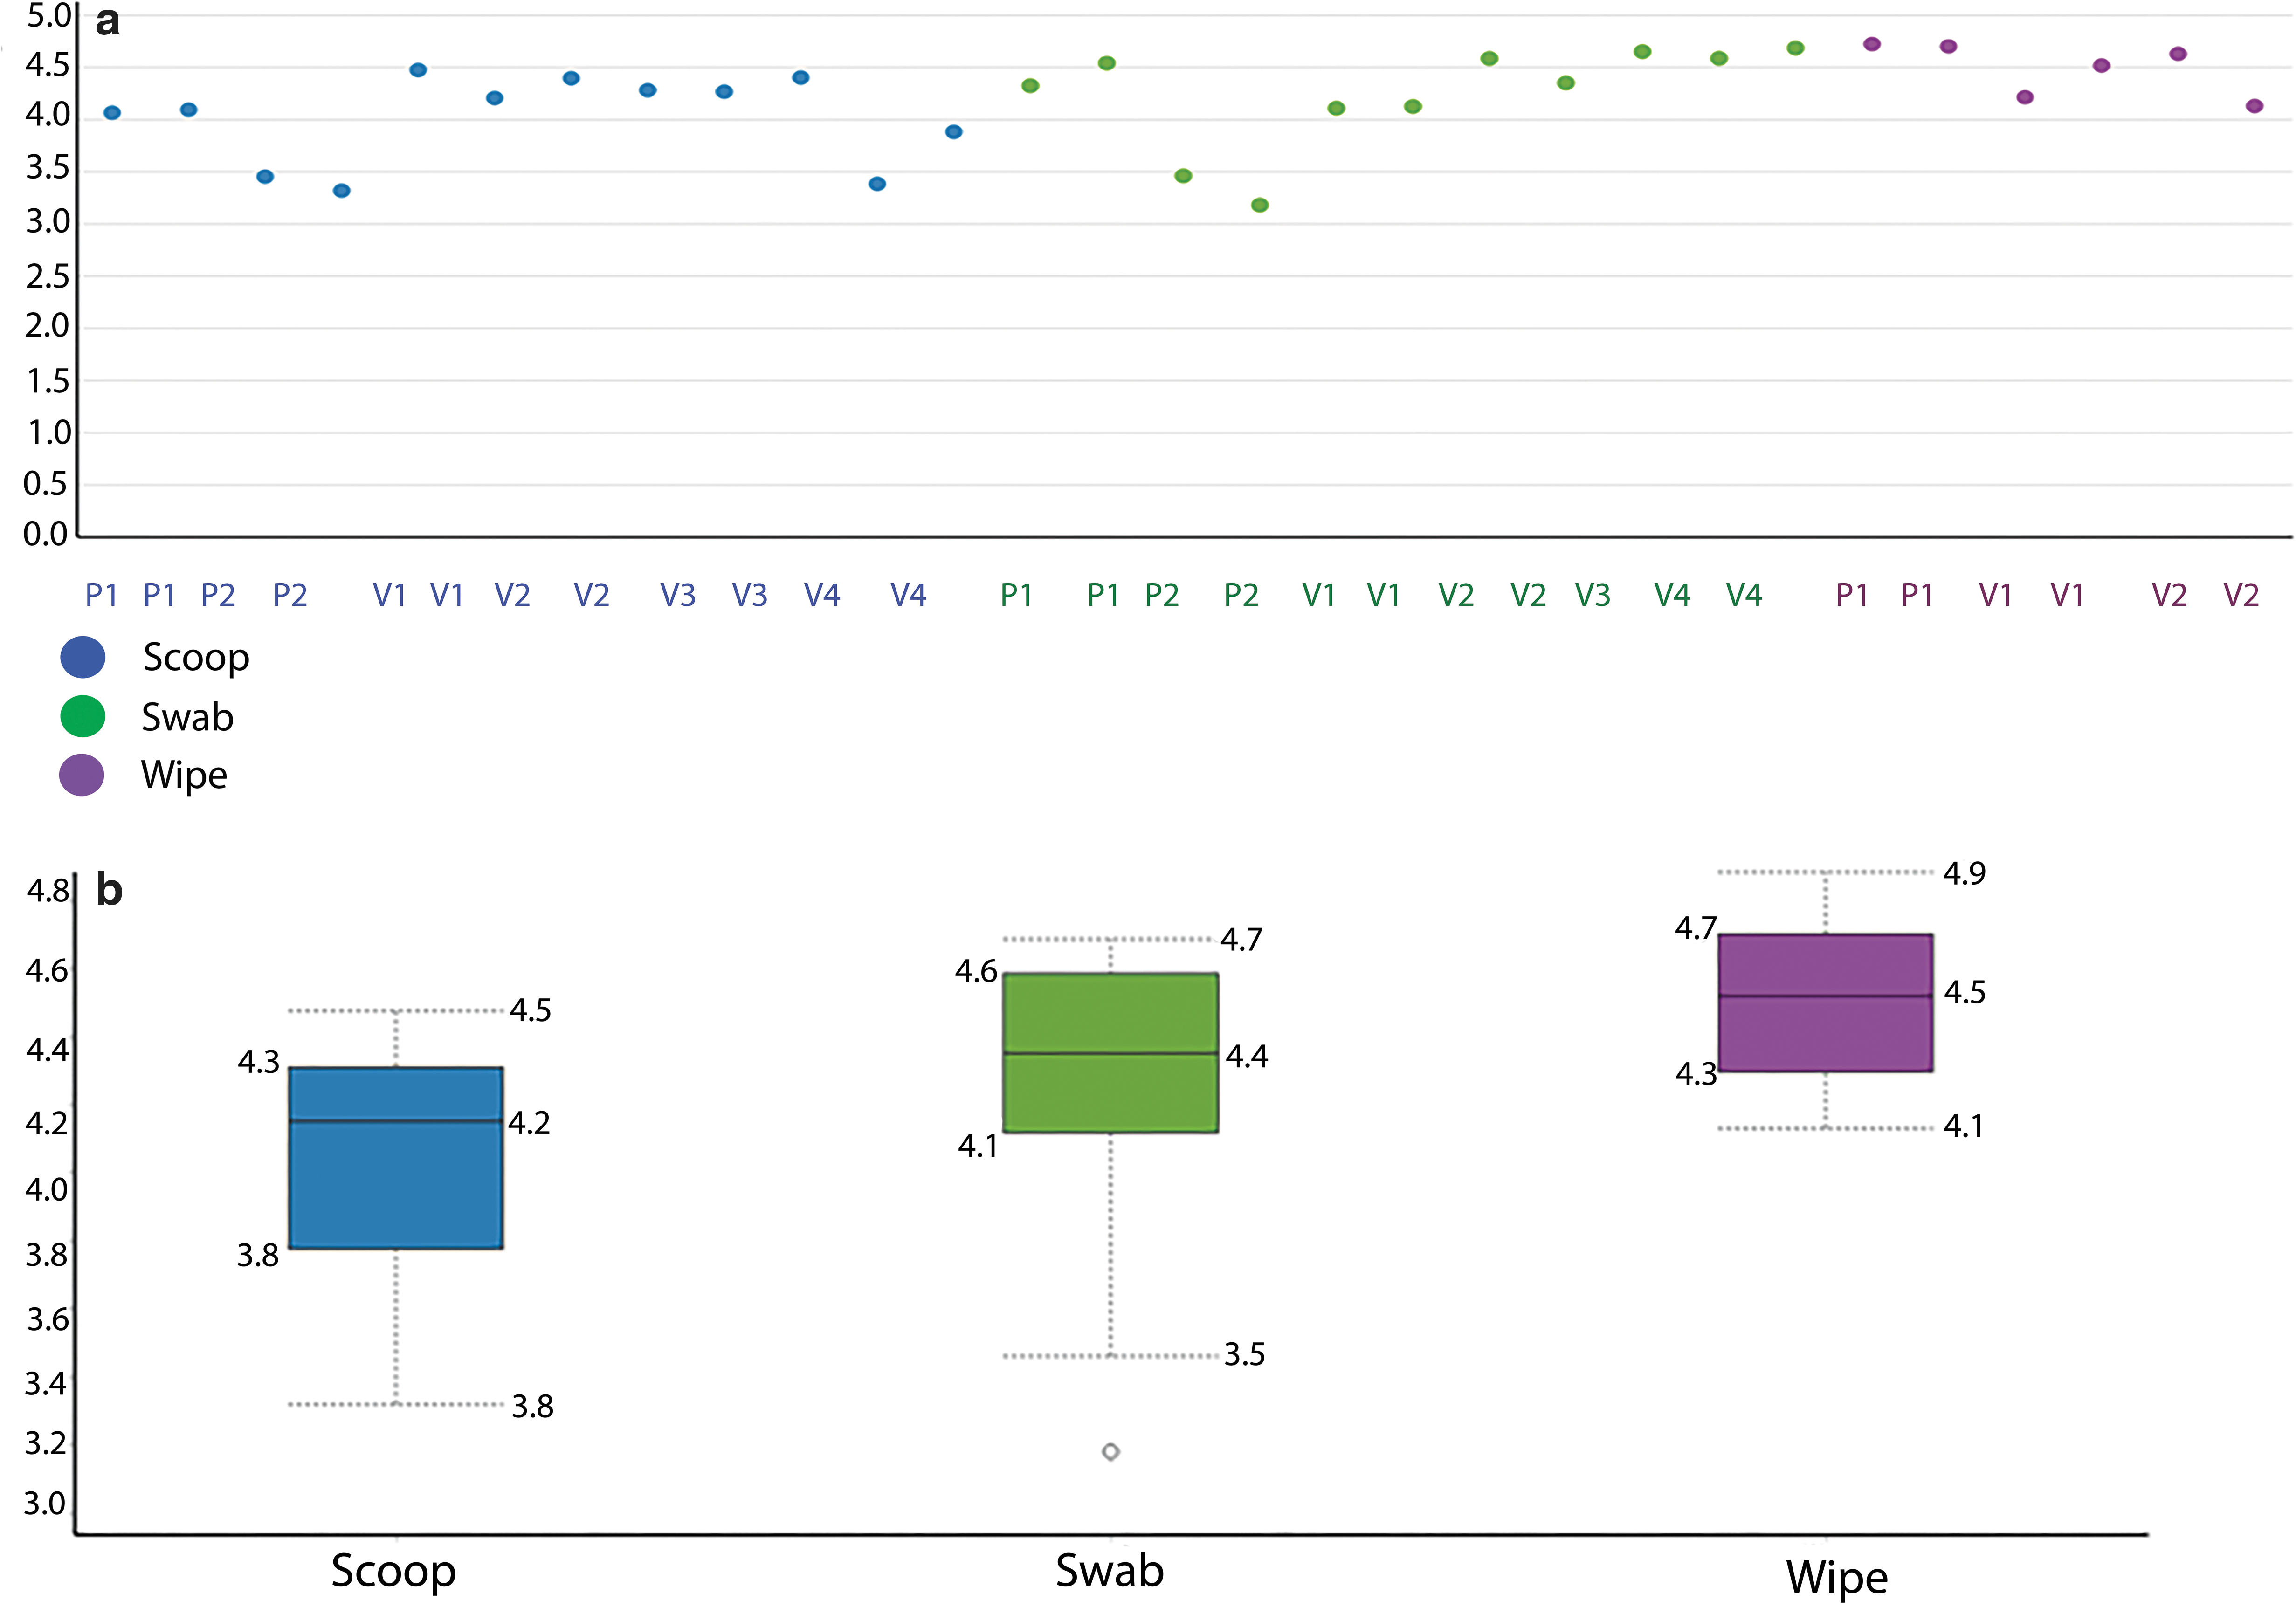
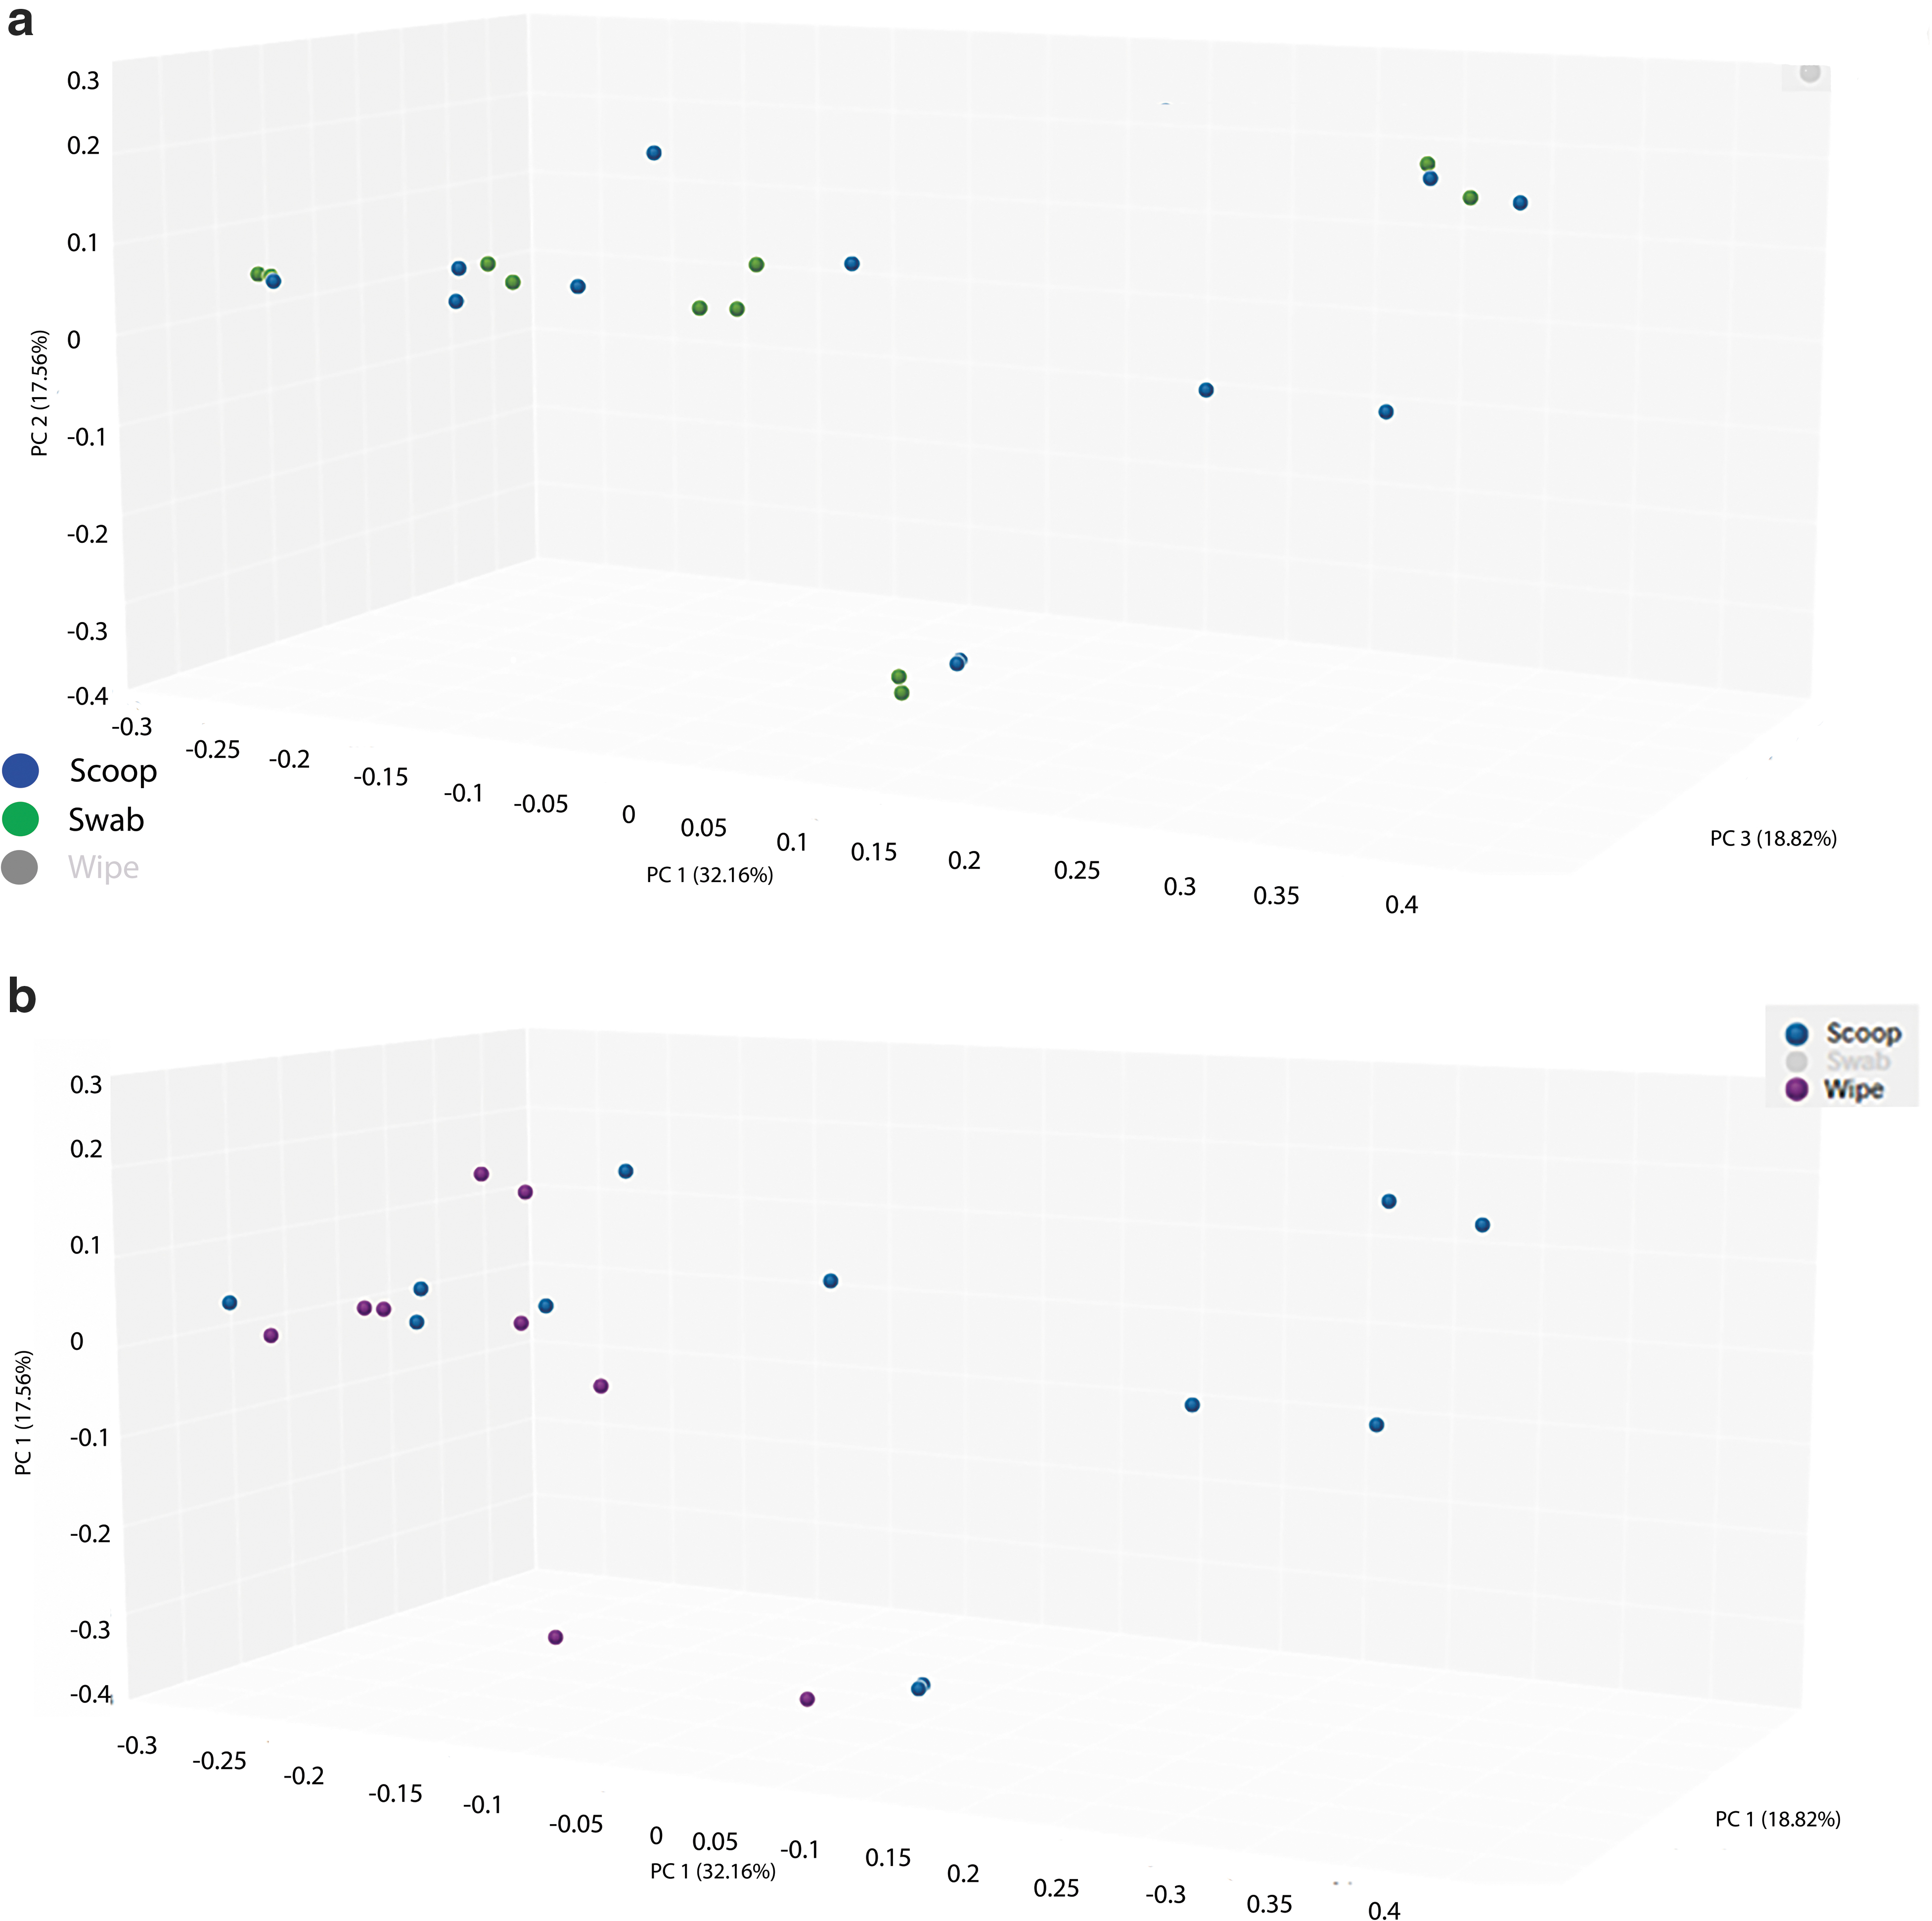
Figure 4a shows the PCoA of the scoop and swab collection methods and Figure 4b shows the PCoA of the scoop and wipe methods. We also calculated the Bray-Curtis dissimilarity distance and is shown in Table 1 when the three collection methods were compared. Again, the swab collection method was closer to the scoop than the wipe collection method (smaller numbers mean more similarity compared to larger numbers). Supplementary Table S1 shows the same metrics grouped by individual patient/volunteer and collection type.
Overall Bray-Curtis Dissimilarity Matrix for the Three Sample Collection Methods Using 16S Ribosomal RNA Sequencing
Shotgun metagenomics sequencing
Of the potential 36 samples, 34 samples had adequate DNA to be shotgun sequenced (12 scoop, 12 swab, and 10 wipe). Both wipes from patient two failed to yield any usable DNA. The median number of reads for all samples was 29 × 106, and sample reads ranged from 22.7 to 32.3 × 10⁶ reads. Data normalization was done by subsampling using a cutoff of 20 × 106 reads based on the distribution of reads across samples. Figure 5a shows the PCA plot for the samples based on patient ID, where both patient samples again separate from the volunteer samples. In addition, all patient and volunteer samples cluster quite distinctly from each other. Figure 5b shows the PCA plot for collection method using shotgun sequencing. Most duplicate collections clearly clustered together showing that the collections were robust, and the only outlier was volunteer 4 where both collections using the wipe clustered away from each other. Using the filter for a minimum of at least 1% abundance of all samples resulted in a list of 132 bacterial species that mapped to 56 genera. Of the 65 and 132 bacterial species identified by 16S and shotgun sequencing, there were 35 species (57%) that were identified by both methods (Supplementary Table S2).
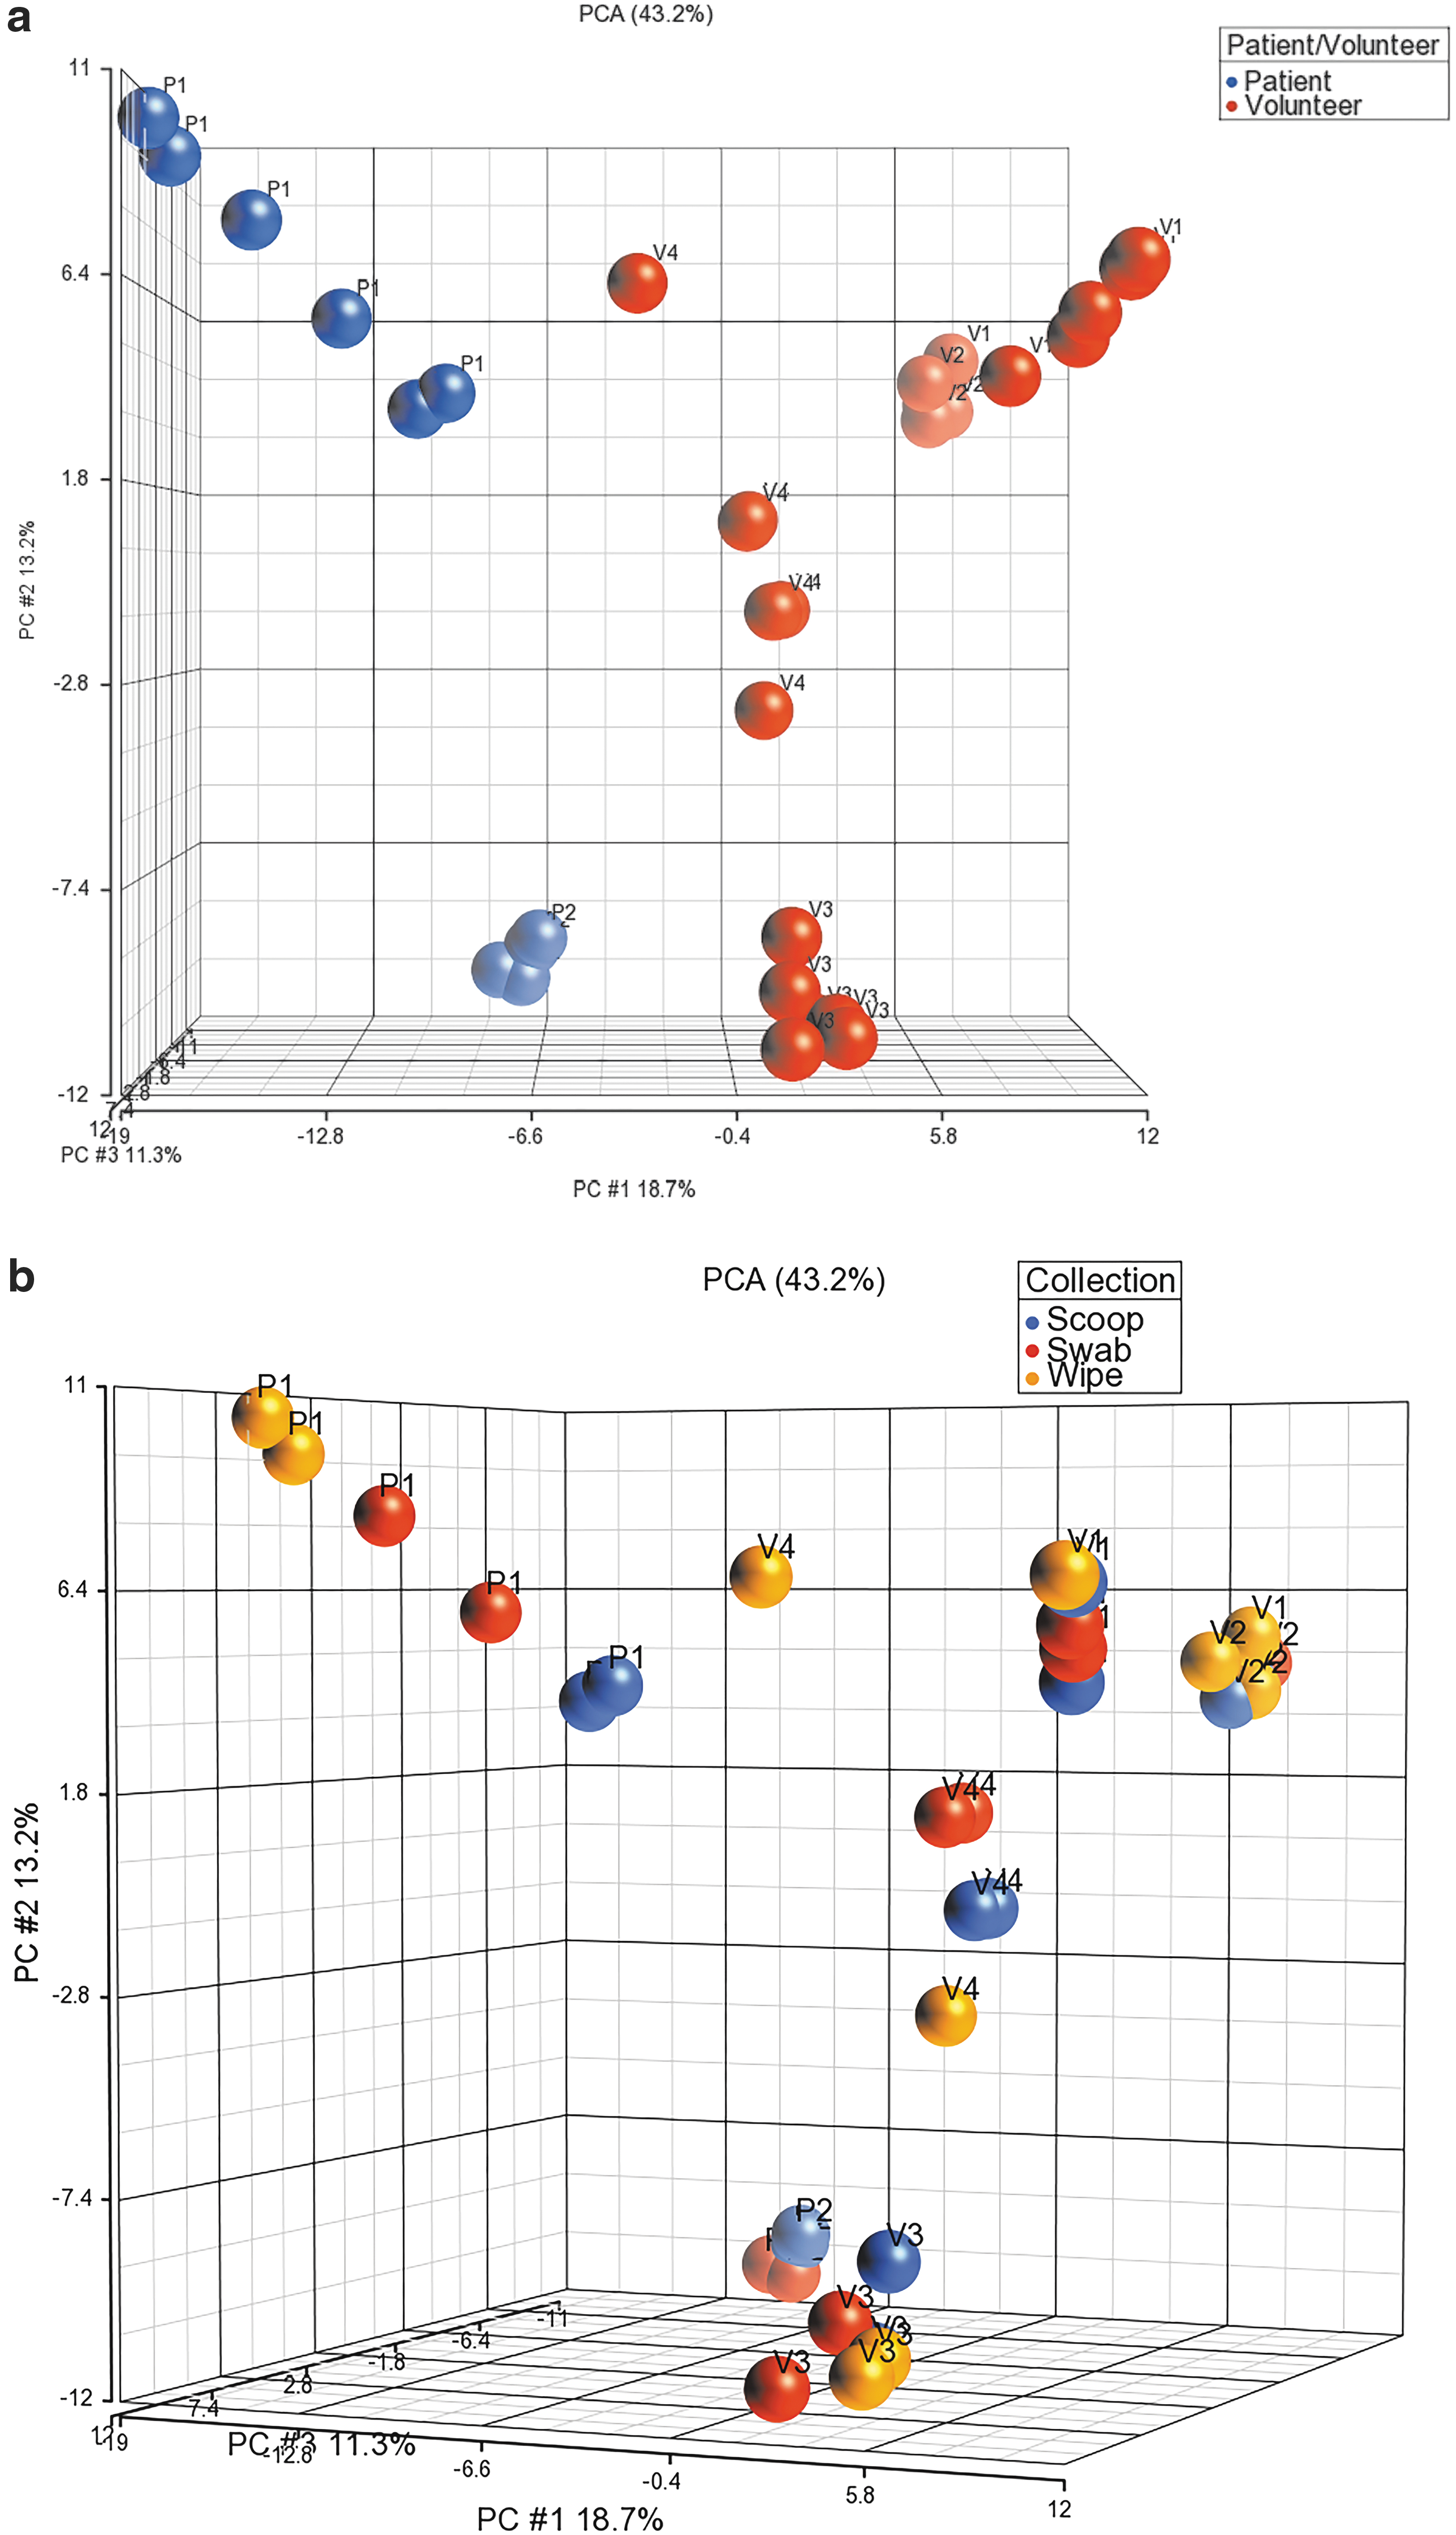
Figure 6 shows the heat map of the 132 bacterial species. It is evident again that the profiles of the patient samples are dissimilar to that of the volunteers, and the heterogeneity in the bacterial profiles among the volunteers is again captured. Figure 7a shows the dot plots of the alpha diversity from the three sample collection methods where all methods seem to capture the population diversity similarly. The boxplots of the Shannon diversity index shown in Figure 7b suggest that the swab and the wipe are diverse in their populations compared to the scoop, but these differences were not statistically significant like the 16S sequencing.
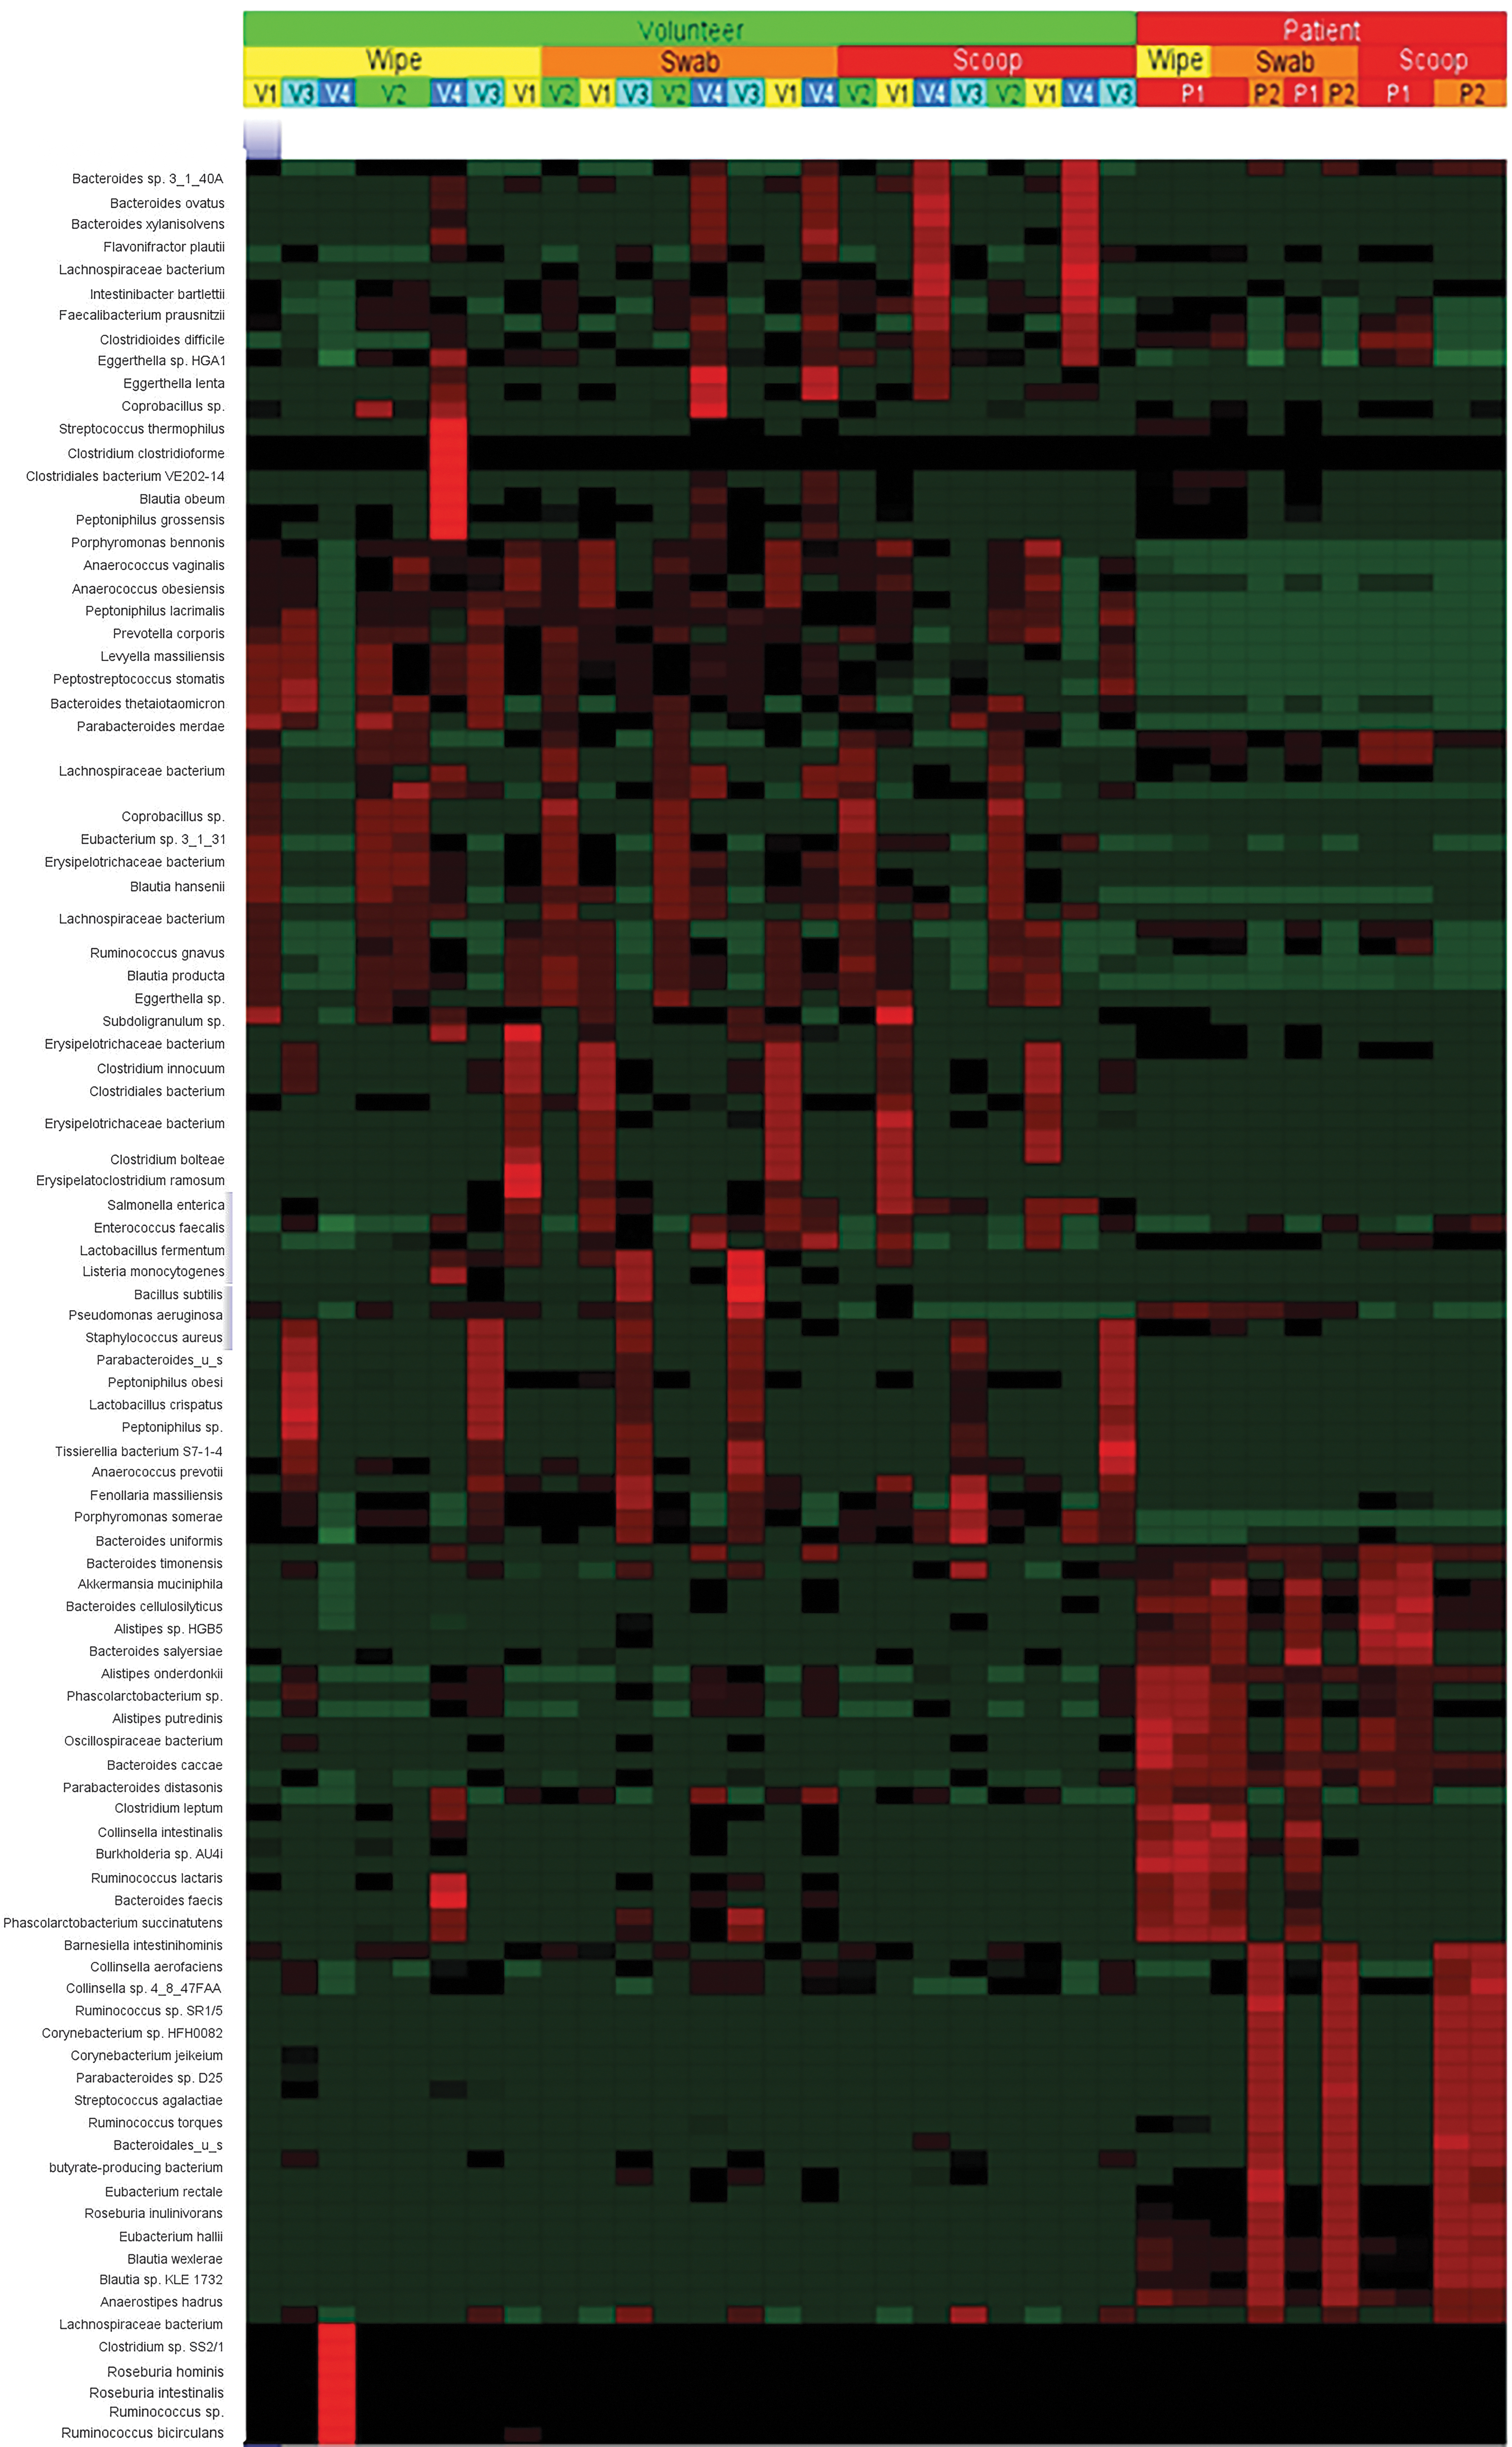
Heat map of the 132 bacterial species identified by shotgun metagenomics sequencing after filtering reads for abundance.
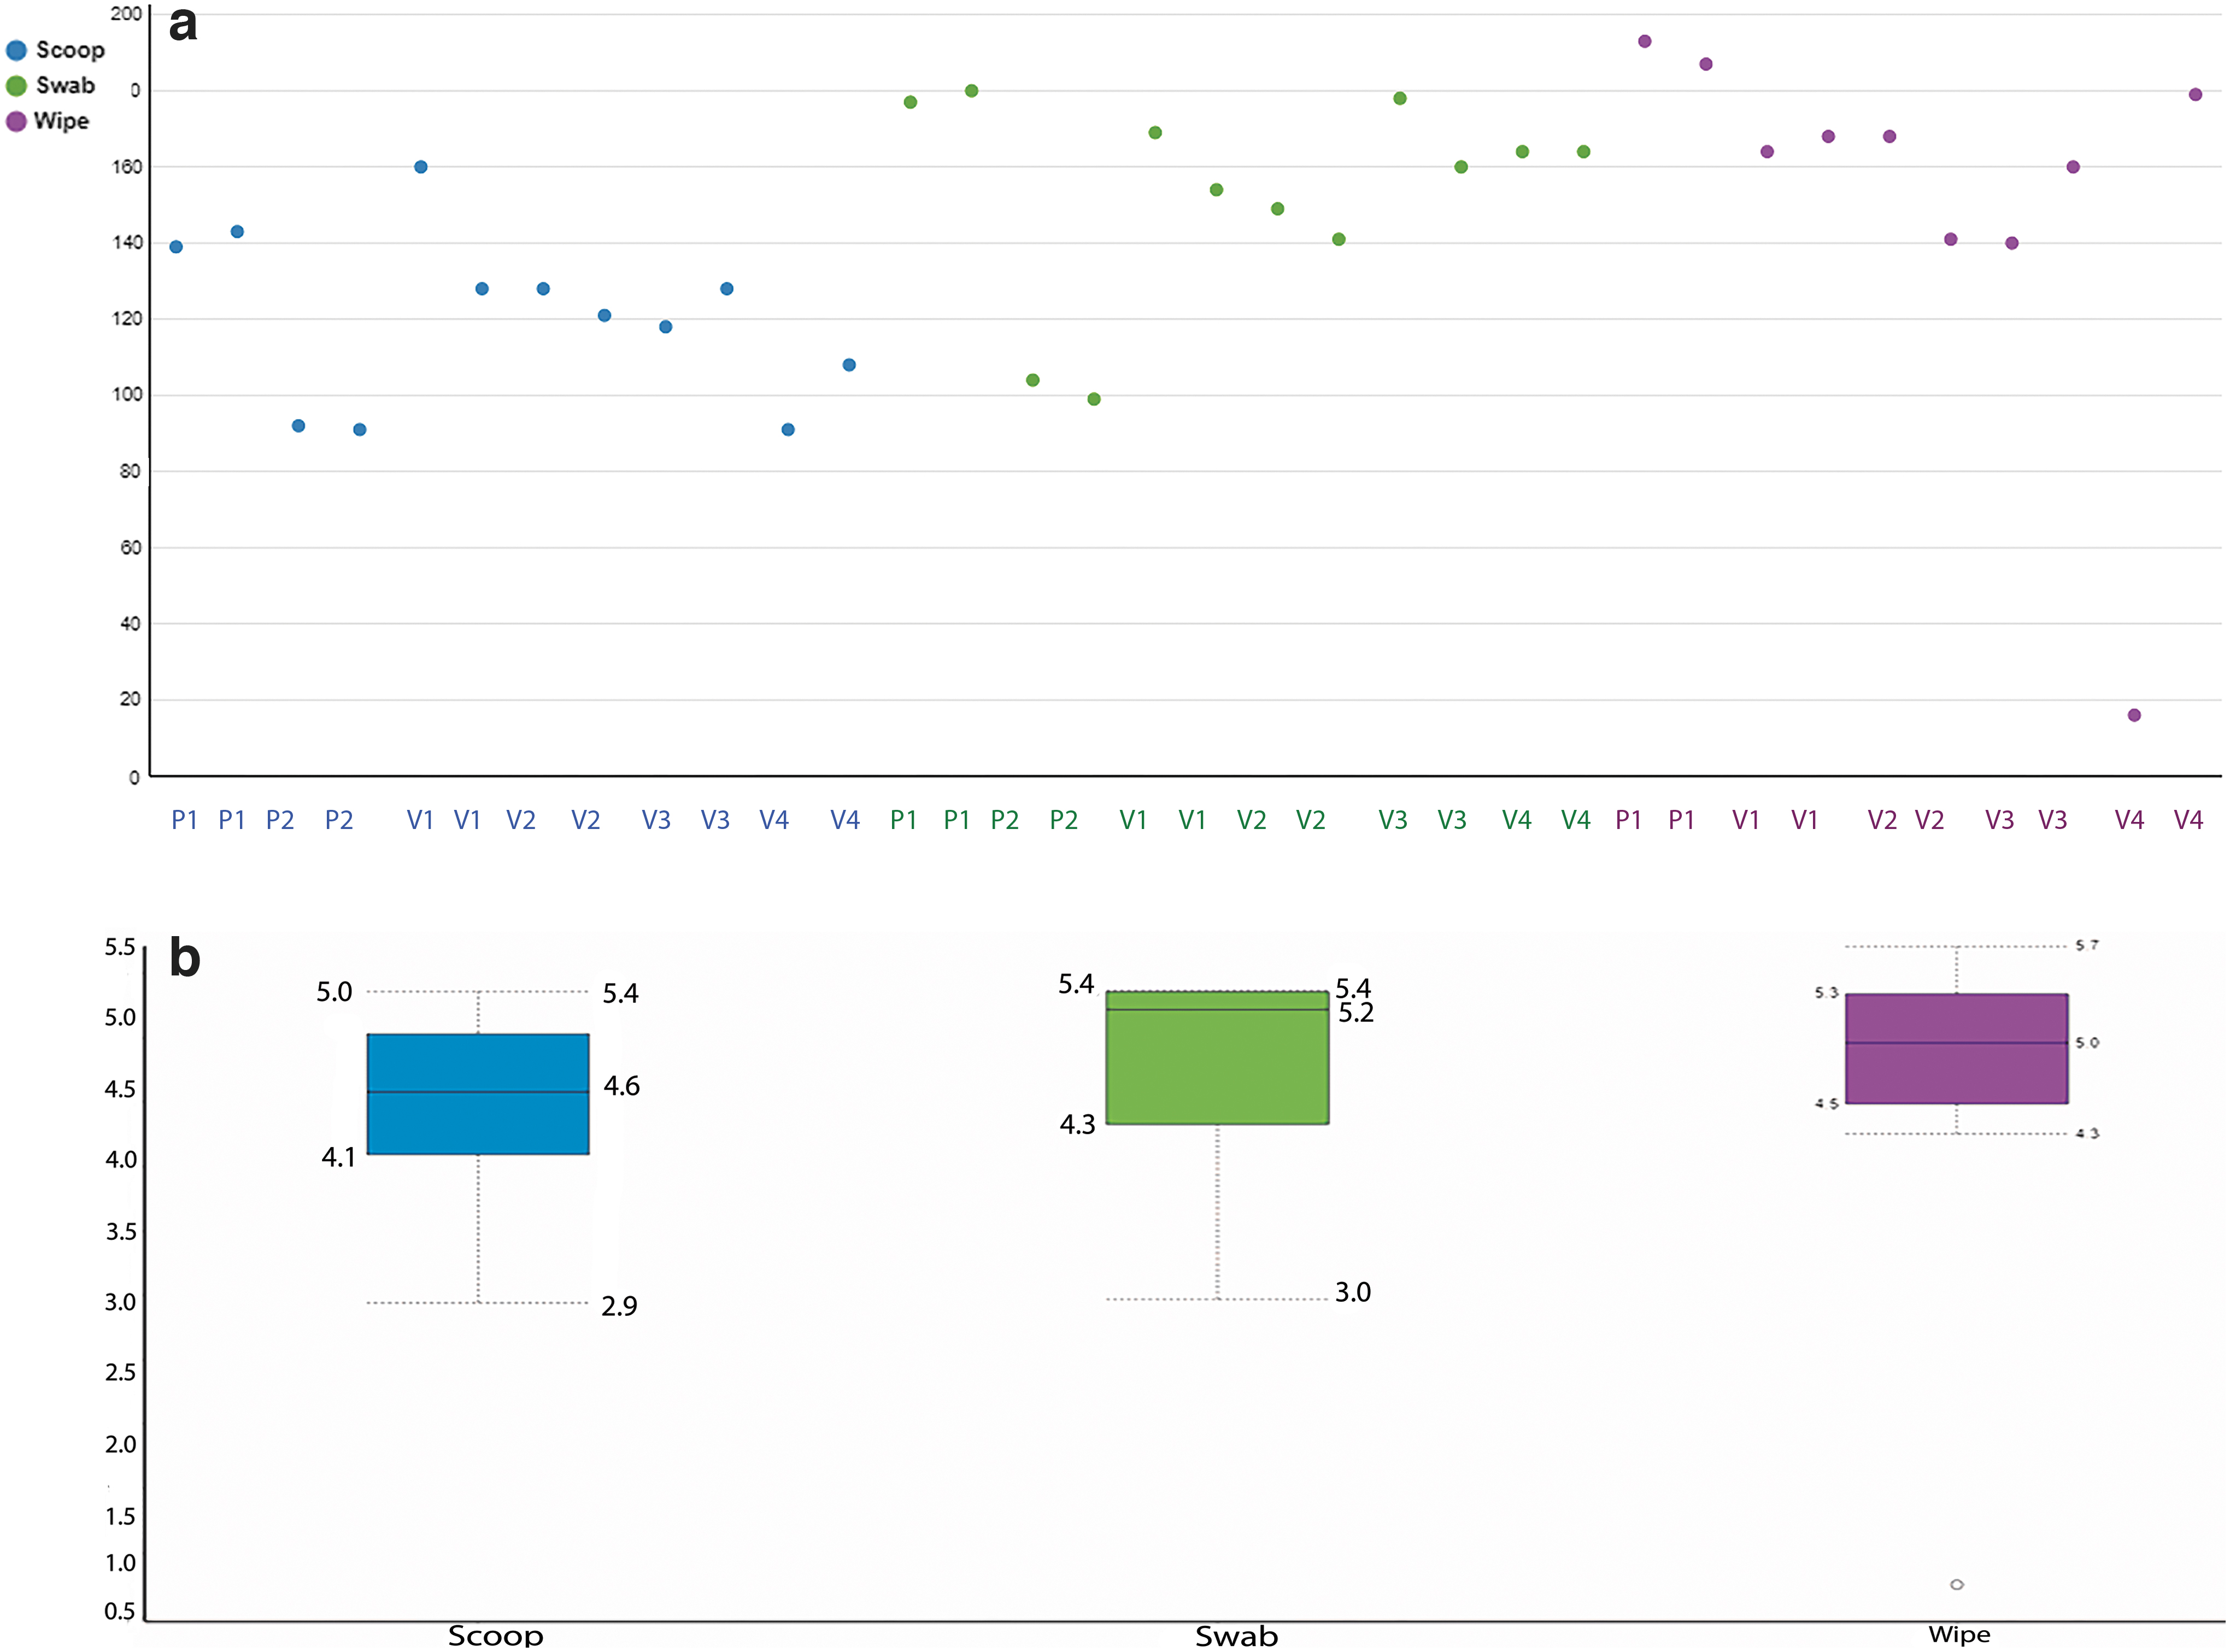
Figure 8a shows the PCoA of the scoop and swab collection methods using the metagenomics data and Figure 8b shows the PCoA of the scoop and the wipe method. Table 2 shows the Bray-Curtis dissimilarity distance matrix grouped by collection method and the numbers again demonstrate that the scoop and the swab methods were similar compared to the wipe collection method. Supplementary Table S3 shows the distances by patient/volunteer and collection type.

Overall Bray-Curtis Dissimilarity Matrix for the Three Sample Collection Methods Using Shotgun Metagenomics Sequencing
16S rRNA versus shotgun metagenomics sequencing
Since the 16S sequencing and the shotgun metagenomics sequencing use different pipelines and databases for alignment of the sequencing reads, a direct comparison is not easy. So, we chose to compare the 65 bacterial species identified by the 16S sequencing to that of the 132 bacterial species identified by shotgun sequencing. Over 75% of the species identified using 16S sequencing were also identified using the metagenomics methodology at the genus and species level. As an alternative strategy, we also looked at 7 abundant bacterial species identified in the 16S sequencing from our data set and calculated the percentage of reads from each sample that comprises these bacteria. We also wanted to compare directly the alpha diversity of the two sequencing technologies at the individual subject level. Therefore, we created dot plots comparing the 16S and metagenomics Shannon alpha diversity for each patient and volunteer studied to make a direct comparison of the two methods for each study individual (Fig. 9).
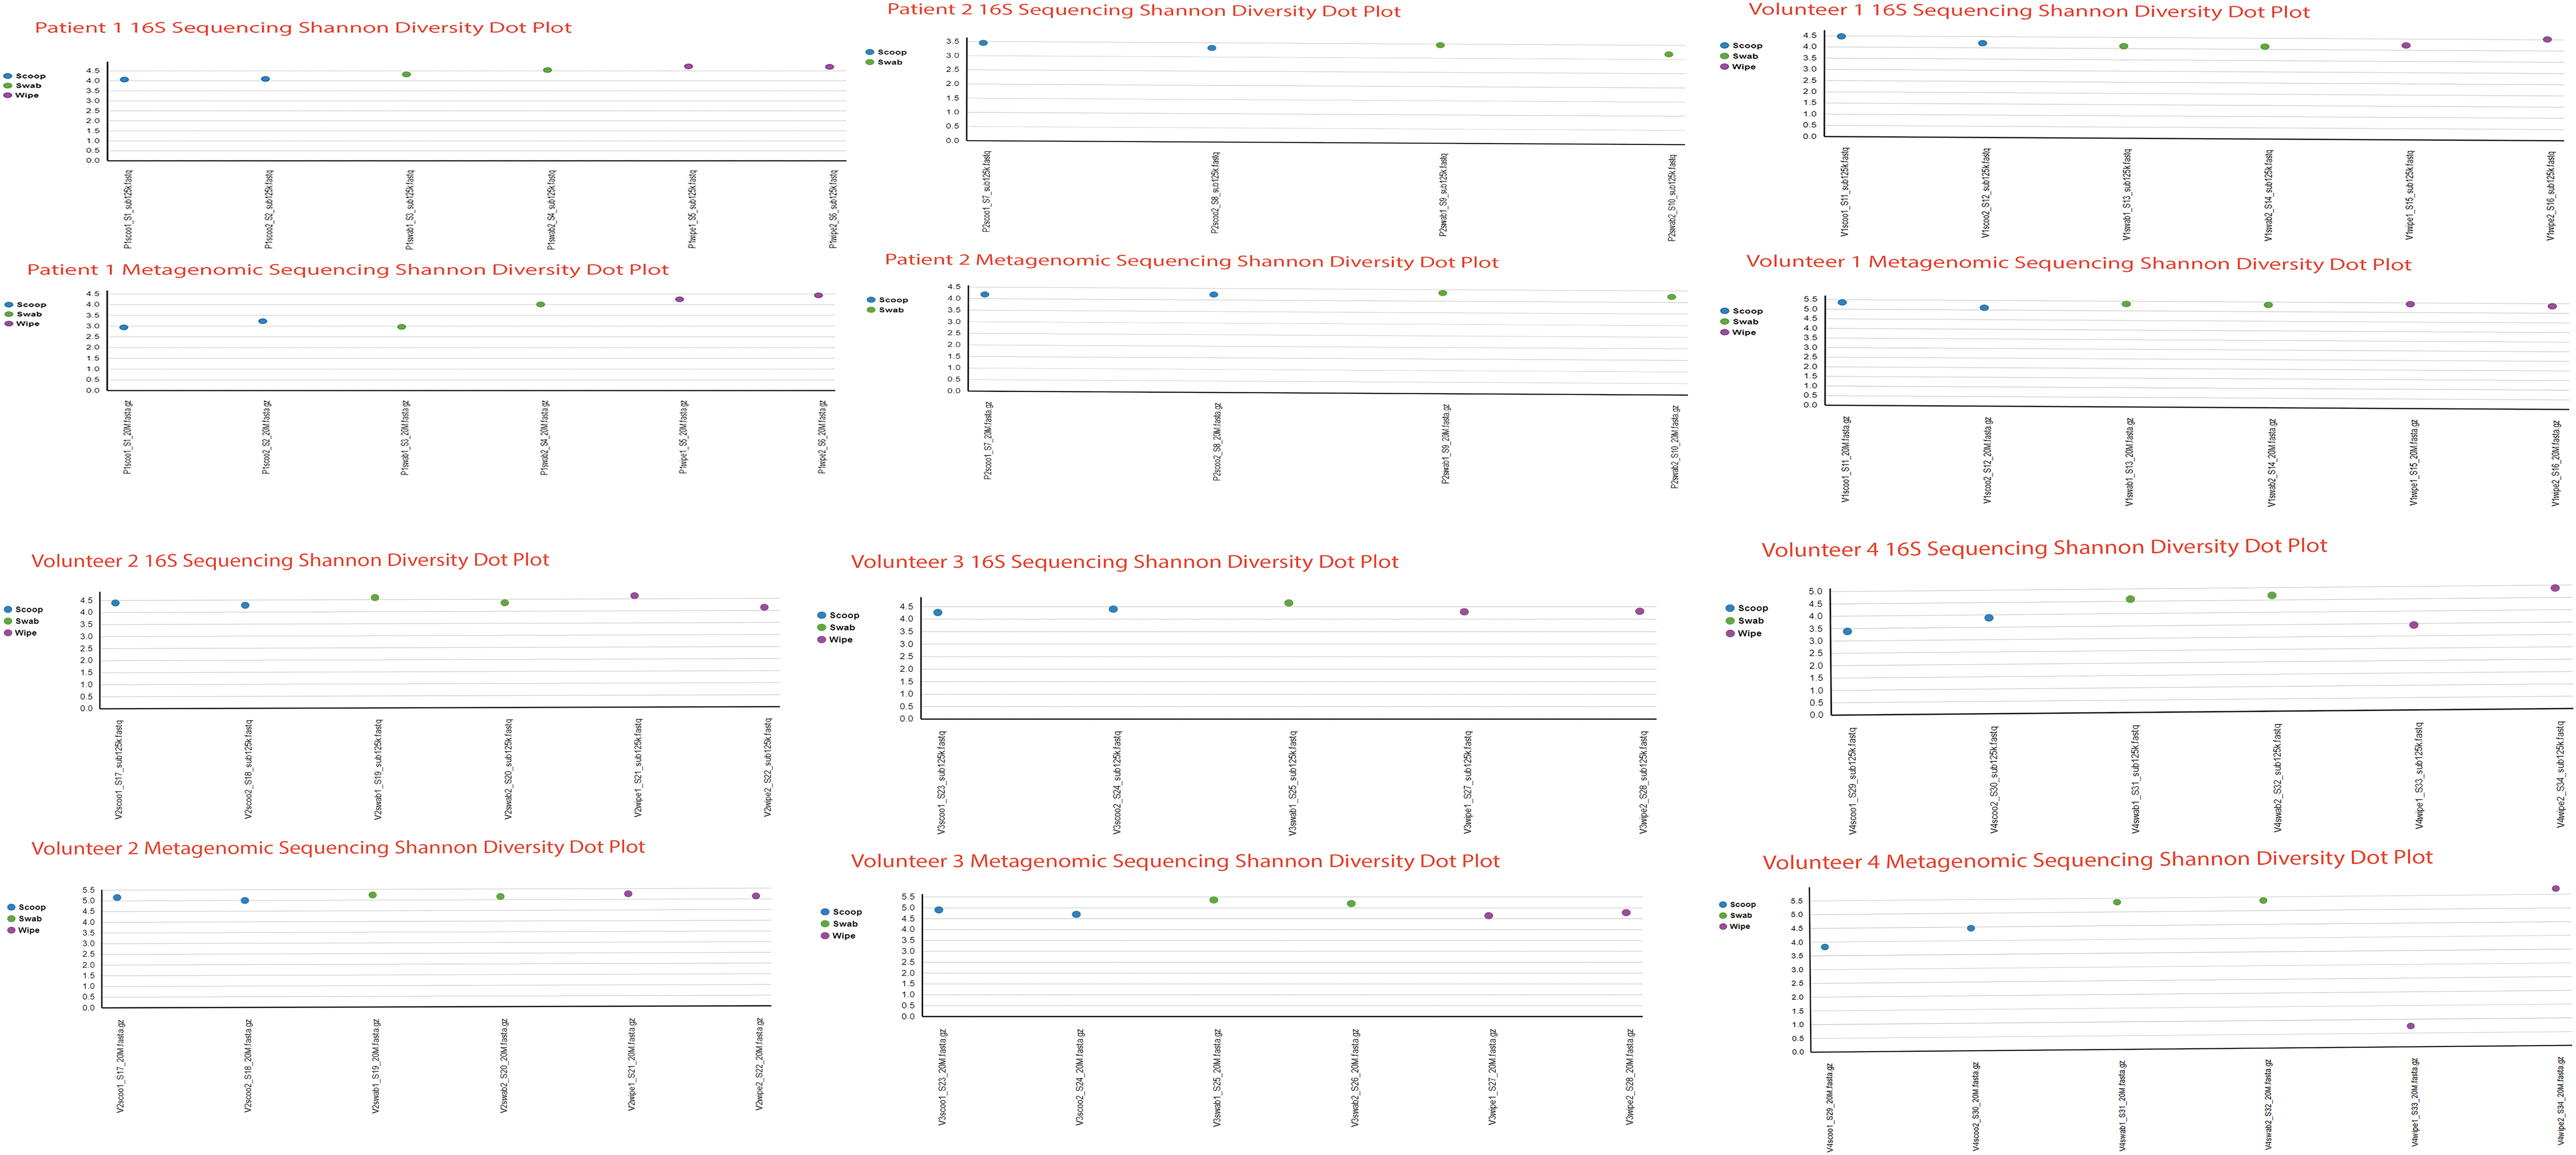
Dot plots comparing the 16S and metagenomics Shannon alpha diversity for each patient and volunteer in the study.
Figure 10 shows the results of the comparison that looks almost identical using both sequencing technologies. For example, Faecalibacterium prausnitzii, which was identified abundantly in patient 1 using 16S sequencing in all three collection methods, was faithfully reproduced using the shotgun sequencing method. Similarly, two bacterial species, Akkermansia muciniphila and Bifidobacterium adolescentis, identified as being abundant by all three collection methods using 16S sequencing in volunteer 4 were also identified as the dominant species using shotgun sequencing. There was more alpha diversity seen using shotgun sequencing compared to 16S (Fig. 10), and the collection method alpha diversity was more pronounced in the shotgun method, perhaps due to the higher number of bacterial species identified by shotgun sequencing. Table 2 shows the Bray-Curtis dissimilarity distance matrix grouped by collection method for the metagenomic sequencing.

Three-dimensional column plots showing the comparison of 16S sequencing and shotgun metagenomics of the percentage of reads of seven abundant bacterial species.
Skin contaminants
We wanted to evaluate if the bacteria detected in the swab and wipe were primarily originating from the anal skin rather than the rectal region, given both these methods are prone to skin contamination. We therefore investigated the presence of predominant skin commensals such as Corynebacterium, Staphylococcus, and Streptococcus shown to be abundant in skin.18,19 We wanted to estimate if they were more abundant in the swab and wipe samples compared to the scoop samples. The results show that for both the 16S and the metagenomics sequencing, there were no significant differences for these genera and their representative species (Table 3).
Comparison of Predominant Skin Commensals (Corynebacterium, Staphylococcus, and Streptococcus) by 16S and the Metagenomics Sequencing
rRNA, ribosomal RNA.
Discussion
Standard collection methods for fecal sampling involving direct collection of fecal material into a preservation solution and/or freezing medium have a considerable discomfort factor for patients and make it very difficult for patient retention in microbiome studies, especially in those studies where serial sampling is warranted. Simpler methodologies, such as using a swab, have been tested in the field and have been more widely accepted because of their user friendliness as participants only have to dip a swab into the feces and then immediately put it into a vial of stabilization material, thus making it more amenable for the patient.18,20,21 Although there are certain drawbacks to this methodology, especially regarding amounts of collected sample, there has been some pushback to use these methodologies. However, the technologies for sequencing have vastly improved and the input amounts necessary for sequencing are as little as nanogram amounts of DNA for most sequencing pipelines.
There have been other studies that used fecal swabs and standard collection methods in kidney transplantation,22–24 but they used samples that were either collected at home and kept at 4°C rather than using a preservation solution or preserved in RNA later, which has been shown to have decreased DNA purity25,26 and was poor at maintaining microbiota composition by 16S sequencing. 27 Our pilot study differs in a couple of aspects. First, we used the NEXTFLEX 16S V4 & 18S ITS Amplicon kit that generates libraries that cover both the V4 hypervariable domain of the 16S rRNA genes present in microbial populations and the 18S ITS regions that can identify fungal and microeukaryotic organisms in a single library preparation. The value of the V4 hypervariable region of the 16S rRNA gene over other hypervariable regions has been demonstrated. An in silico study of the 16S rRNA hypervariable gene regions showed that the V4–V6 regions might be the most optimal subregions for the design of universal primers for superior phylogenetic resolution for bacterial phyla. 28 Similarly, a recent study evaluated the performance of both various preservation solutions, as well as three hypervariable regions of the bacterial 16S rRNA gene by 16S sequencing. 27 The results showed that the preservation solution used, as well as the 16S rRNA gene primer pair were critical determinants of microbiota profiling. Specifically, reads generated using the V4 primer pair showed higher alpha diversity of the gut microbial community. Second, we did not use dry swabs/wipes or swabs/wipes in RNA later, but rather used the DNA/RNA shield solution that prevents the growth of gut bacteria, thereby allowing the resulting samples to be handled safely, and does not change the composition of the bacteria postcollection. Interestingly, it was shown that the DNA/RNA shield solution performed well in microbiota preservation and disinfection, but showed increased relative abundance of Faecalibacterium. 27 However, in our dataset, we saw a significant abundance of F. prausnitzii only in patient 1 using both sequencing technologies.
Discordance between fecal swabs and stool samples collected using a standard collection method has previously been reported, 29 with the authors suggesting higher relative abundances of members of bacterial species that were present in skin in the swab samples. This is not surprising because swab samples may have relatively more contamination with epithelial cells from the rectal area. A recent study that compared a standard stool sampling technique and fecal swabs showed that fecal swabs reliably replicate both the bacterial composition and diversity in the collected stool samples if the swabs were processed within 2 days of collection. 21 Our methodology differed slightly in that the swabs were immediately immersed in a DNA/RNA shield solution that preserves the DNA intact without any further bacterial growth. Another study from the CDC showed that bacterial community structure was preserved and similar between freshly passed stool samples and fecal swabs collected over various time points from patients at the short-stay acute care hospital. 20 The study also showed that the intersubject variability was larger than the within subject variability, assuring that the collection methods were truly comparable and could be swapped. Similarly, deep fecal swabs were shown to be consistent and a good surrogate for microbiome sampling and analysis, given its practical advantages of collection, easy timing, transport, and storage. 18 There was, however, a relatively high abundance of putative skin commensals in the patient cohorts in that study. In our study, there was, however, no evidence for increased abundances of predominant skin commensals such as Corynebacterium, Staphylococcus, and Streptococcus between the three collection methods used, suggesting that swabs and, to a lesser extent, wipes, could be used for microbiome estimation and investigating microbial diversity instead of the standard collection method. Our data suggest that the swabs and wipes are acceptable alternatives to overcome the hesitancy and stigma for stool collection from patients, especially solid organ transplant patients who are already burdened by immunosuppression and other medications and often have episodes of diarrhea and other gastrointestinal problems. The swab most faithfully replicates the standard scoop collection method, while the wipes show more variation. We therefore think that even though the wipe methodology may be useful, there is clearly more variation in terms of diversity among the bacterial species identified, and additionally, the wipes also may have the propensity to collect more skin contamination, given the very design of the collection. We would therefore suggest that the swab is the most appropriate methodology that closely approximates the standard scoop collection. Another disadvantage of using the wipe would be that the skin contamination not only is a problem but also takes up valuable sequencing space, which increases the cost of sequencing as well as the need for additional bioinformatics pipelines to remove the contaminating sequences. The wipe may be considered an alternative collection method only within the context of the disadvantages of using the wipe as mentioned above.
The merits and demerits of 16S and metagenomics sequencing of the microbiome have been published. The common sequencing approach to analyze the microbiome is the amplicon analysis of the 16S rRNA gene.30,31 Its limitations are primarily that the annotation is based on putative association of the 16S rRNA gene with a taxon defined as an OTU, and that the resolution of the microbiome is usually only accurate at the genus level. The alternative approach is whole-genome shotgun sequencing or shotgun metagenomics, which was developed initially as culture-independent sequences of the entire metagenome (collection of genomes) of the Sargasso Sea by obtaining ∼1 million kilobase of nonredundant sequence. 32 This method has advantages that the taxa can be more accurately defined at the species level and sometimes even at the strain level. Shotgun sequencing is more expensive and often requires deeper (more sequences) sequencing and more extensive data analysis pipelines.33,34 However, a recent study cautions against the dogma that mid-depth shotgun recovers more diversity than amplicon-based approaches. 35 When amplicon and shotgun methods were compared on water samples across four of Brazil's major river floodplain systems, <50% of phyla identified by amplicon sequencing were recovered from shotgun sequencing. The authors suggest that, while both amplicon and shotgun sequencing methods have their own advantages, amplicon sequencing was clearly superior for the goals of microbial DNA community ecology and the results also depend on the databases used for sequence alignment where the 16S method has a clear advantage. 36
Our data show that most genera and species identified by 16S were also identified by shotgun sequencing, and although shotgun sequencing offered additional species diversity, the value of this additional information comes with the tradeoff needing deep sequencing and higher costs. The choice of sequencing technology will ultimately depend on the objective of the study. If the objective is to identify novel microbes and novel genes, and/or to resolve microbial populations with high sensitivity and specificity, then shotgun sequencing is warranted. However, if the objective is to monitor population changes and for detecting changes in abundance, 16S sequencing may be the ideal low-cost and more rapid approach. Although the 16S rRNA and the shotgun sequencing methods show the same “trends” in dissimilarities, the distances in the dissimilarity matrices are more pronounced with the shotgun method. This suggests that the shotgun method could be more sensitive and specific in detecting dysbiosis based on the degree of richness. Shotgun sequencing would be an obvious choice if not cost prohibitive or bioinformatically tedious to conduct such studies. Therefore, we would suggest using the 16S sequencing as a pilot to determine if there are interesting differences in studies looking at dysbiosis, and once identified, a deeper dive can be taken using the shortcut sequencing technology.
In conclusion, our pilot study demonstrates that alternative collection methods for stool sampling using a swab or wipe preserved immediately in a stabilizing solution are a viable option in clinical applications in general, and specifically in solid organ transplant studies, compared to standard cumbersome collection methods. Using these alternative methods may result in higher patient retention and patient recruitment rates for large-scale serial microbiome studies. Our analysis of the two different methods of sequencing technology (16S rRNA sequencing and shotgun metagenomics) shows that both technologies are complementary, but 16S sequencing should provide enough sequence coverage to make reliable calls on microbial diversity from clinical samples.
Footnotes
Acknowledgments
We gratefully acknowledge the Fred and Betty Farago Research Fund for providing partial funding of this work. We also thank the Scripps Clinic Biorepository for providing some of the samples used for this study.
Author Disclosure Statement
No conflicting financial interests exist.
Funding Information
This study was also partially funded by a Scripps Health Research and Innovation Award (Grant #14520009034; 18-001 awarded to Sunil M. Kurian).

References
Supplementary Material
Please find the following supplemental material available below.
For Open Access articles published under a Creative Commons License, all supplemental material carries the same license as the article it is associated with.
For non-Open Access articles published, all supplemental material carries a non-exclusive license, and permission requests for re-use of supplemental material or any part of supplemental material shall be sent directly to the copyright owner as specified in the copyright notice associated with the article.
