
Abstract
Background:
Liquid biopsies offer a minimally invasive approach to patient disease diagnosis and monitoring. However, these are highly affected by preprocessing variables with many protocols designed for downstream analysis of a single molecular biomarker. Here we investigate whether specialized blood tubes could be repurposed for the analysis of an increasingly valuable biomarker, extracellular vesicles (EVs).
Methods:
Blood was collected from three donors into K3-EDTA, Roche, or Streck cell-free DNA (cfDNA) collection tubes and processed using sequential centrifugation either immediately or after storage for 3 days. MicroEV were collected from platelet-poor plasma by 10,000 g centrifugation and NanoEVs isolated using size exclusion chromatography. Particle size and counts were assessed by Nanoparticle Tracking Analysis, protein quantitation by bicinchoninic acid assay (BCA) assay, and dot blotting for blood cell surface proteins.
Results:
MicroEVs and NanoEVs could be isolated from plasma collected using all three tube types. Major variations were seen with delayed time to processing. Both MicroEV particle number and protein content increased with the processing delay. The NanoEV number did not change with the time-delay but their protein quantity increased. EV-associated proteins predominantly arose from platelets (CD61) and erythrocytes (CD235a). However, leukocyte marker CD45 was only increased in NanoEVs from ethylenediaminetetraacetic acid (EDTA) tubes, suggestive of stabilization of nucleated cells by the specialized blood tubes. Epithelial cell surface marker EpCAM, often used as a marker of cancer, remained the same across conditions in both MicroEV and NanoEV preparations indicating that these EVs were stable with time.
Conclusions:
Specialized cfDNA collection tubes can be repurposed for MicroEV and NanoEV analysis; however, simple counting or using protein quantity as a surrogate of EV number may be confounded by preanalytical processing. The EVs would be suitable for disease selective EV subtype analysis if the molecular target of interest is not present in blood cells.
Introduction
Clinical care is embarking on the age of the liquid biopsy, use of minimally invasive blood samples for use in improved diagnosis, and in monitoring for treatment response and recurrence of many different diseases. Multiple clinical research studies are underway on the hunt for biomarkers for disease, with efforts investigating all types of molecules in the blood.1,2 Two areas of significant research interest are cell-free DNA (cfDNA) and circulating membrane-bound extracellular vesicles (EVs), also called exosomes and microparticles.3–6 The analysis of multiple complementary biomarkers offers a greater potential for discovery of the most accurate and sensitive markers for each clinical scenario. For biobankers a challenge is posed in how to collect and process blood plasma samples that are fit for downstream analysis of these multiple forms of molecular biomarker. The appropriate preprocessing that is suitable for a breadth of marker subtypes is essential to consider progress of the future of personalized medicine.
The analysis of cfDNA has prompted the development of new blood collection tubes that are reported to stabilize nucleated cells, likely through membrane fixation, 7 to avoid lysis and release of their normal genomic content that can dilute the disease-associated DNA present in the plasma. Analysis of cfDNA is like looking for the proverbial needle in a haystack and therefore, limiting contaminant germline DNA is essential. 8 For EVs there are guidelines regarding the most appropriate ways to collect and process plasma for the downstream analysis of EV characteristics.9–11 It should be appreciated that EVs in the blood are a complex soup of particles derived from all cells in the body including a significant proportion arising from blood cells and platelets themselves. Indeed, platelet dust, EVs released from activated platelets, was one of the first reported forms of EV. 12 Therefore, for the analysis of EVs in plasma as disease biomarkers, avoidance of contaminant blood cell lysis and activation before and during processing is also essential.
In an ideal situation, a biobanker would be able to collect multiple tubes of blood, processed quickly to generate stored plasma suitable, each for a defined downstream purpose. For example, red top serum is commonly used for protein markers,13–16 cfRNA tubes are available for the analysis of plasma RNAs,16–18 and as noted, a number of cfDNA stabilizer tubes also exist for biomarker analysis. In reality this can be a challenge. Accessing patient samples from rural donors or those outside of the hospital system also poses challenges for the equitable provision of health care and research opportunities. Stabilizer blood tubes offer convenience, allowing a delay to processing; however, not all tubes have been tested for suitability for alternative biomarker types. In an age where cfDNA is a key clinical and research focus here we questioned whether specialized stabilizer tubes would also be suitable for analysis of EVs.
In this study we have compared standard ethylenediaminetetraacetic acid (EDTA) vacutainers with specialized Roche and Streck cfDNA blood collection tubes processed for plasma within 1 hour and at 3 days postcollection. We assessed the number, size, and protein content of larger microparticles (MicroEVs) and NanoEVs in each condition and identified that all blood cells contributed to increased numbers and associated protein amounts of MicroEV during delayed processing. The quantity of NanoEVs remained stable; however, an increase in the amount of protein associated with them was seen in the samples stored for 3 days. Although platelet and erythrocyte lysis or activation was evident in all blood tubes, stabilization of CD45 protein positive nucleated cells was seen in the specialized blood collection tubes relative to EDTA vacutainers.
Materials and Methods
Donors and ethical approval
Self-reported healthy, nonfasting donors provided written informed consent before phlebotomy using project ethical approval from the New Zealand Health and Disability Ethics Committee (14/NTA/138). Phlebotomy was performed using a 21 g butterfly needle to sample peripheral blood and filled tubes were inverted as per manufacturer's instructions before transfer to the laboratory for processing. K3EDTA BD Vacutainer® tubes, Streck Cell-Free DNA BCT®, and Roche Cell-Free DNA Blood Collection Tubes® were used for the sample collections.
Plasma processing
All plasma was processed 1500 g 10 minutes, with a slow deceleration, followed by 10,000 g 10 minutes at room temperature. Test plasma, used for the EV isolation trials, was processed within 1 hour of phlebotomy into EDTA vacutainers (n = 3). The tube trial donors (n = 3) were processed within 1 hour or tubes stood at room temperature with daily rotation for 3 days and then processed in the same manner. The 10,000 g spin pellet was retained for microparticle analysis (MicroEV). Plasma was frozen at −80°C before processing for NanoEVs. Two milliliters plasma was isolated for NanoEVs using size exclusion chromatography (SEC) after defrosting and a further 10,000 g 10 minutes spin. The main study schematic is shown in Figure 1.
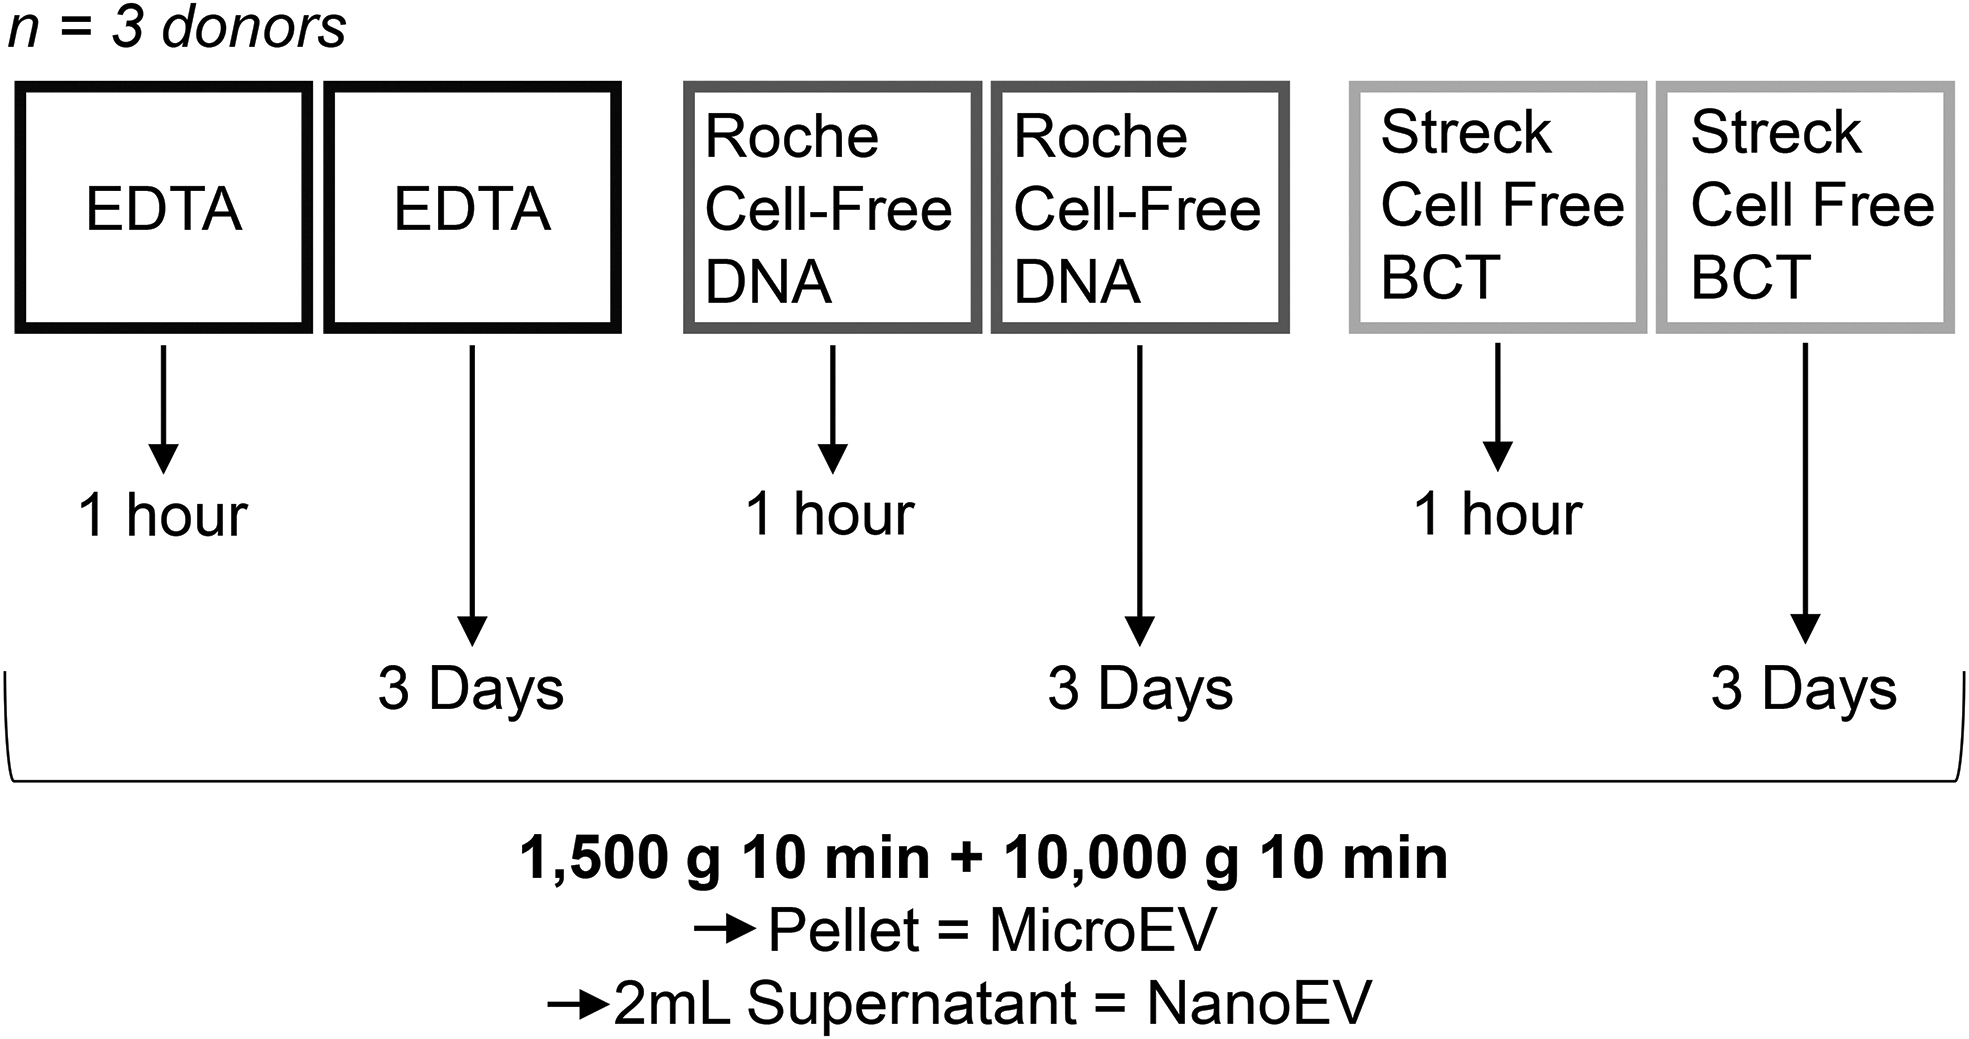
Summary of the study design. Blood was collected from three donors into three types of filled blood tube. Platelet-poor plasma was processed 1500 g for 10 minutes at room temperature with a slow deceleration either within 1 hour or 3 days postphlebotomy. Microvesicles were isolated by centrifugation at 10,000 g for 10 minutes. NanoEVs were then isolated using SEC using 2 mL of plasma. EVs, extracellular vesicles; SEC, size exclusion chromatography.
NanoEV isolation
qEV2 size exclusion columns and an automated fraction collector (AFC; Izon Science, New Zealand) were used as per the manufacturer's instructions. Briefly, the column was loaded into the AFC and flushed with phosphate-buffered saline (PBS) before sample loading. Two milliliters of plasma sample was then loaded into the column and flushed through with PBS. The AFC was programmed to elute the first 6 × 2 mL fractions as discarded void volume and to collect the following 20 × 2 mL fractions.
Transmission electron microscopy
Fractions F8 and F9 were washed in ultrapure water and concentrated using Vivaspin 500, 100 KDa Molecular Weight Cut-Off (MWCO) (Sartorius) to ensure crystalline structures did not form during the staining process. Negative staining of isolated F8 and F9 were conducted by adsorption onto Formvar-coated copper grids for 2 minutes. Excess liquid was removed with filter paper and then the copper grid was transferred to 20 μL of 2% uranyl acetate for 2 minutes. Excess liquid was removed with filter paper and the grid was allowed to dry for 10 minutes before visualization on a Tecnai G2 Spirit TWIN (FEI, Hillsboro, OR) transmission electron microscope (TEM) at 120 kV accelerating voltage. Images were captured using a Morada digital camera (SIS GmbH, Munster, Germany).
Nanoparticle Tracking Analysis
Pooled F8/9 were diluted 1:5 in PBS and their particle size and number were analyzed using a Nanosight NS300 system (Malvern Instruments Ltd). The NanoSight was cleaned with MilliQ water between each sample, with each sample being syringed into the machine at a constant flow rate of 50 AU. Each sample was recorded in triplicate, each consisting three videos at 30 seconds each, with a 5 seconds delay between each video. Camera level and screen gain remained at a constant 7 and 2, respectively. For analysis of recordings, detection threshold and screen gain were kept at a constant 5 and 10, respectively. Each replicate result was then combined for analysis.
Protein concentration assay
MicroEV, pooled NanoEV F8/9, and F17 protein content was determined using Pierce™ BCA Protein Assay Kit (Thermo Scientific) as per the manufacturer's instructions. NanoEV fractions underwent a slightly modified protocol whereby 5 μL 10% sodium dodecyl sulfate (SDS) was added to the sample and incubated for 2 hours at 37°C for high sensitivity protein detection.
Dot blot to assess the cellular origins of EVs
Nitrocellulose membrane was prewet with 1 × MQ water and loaded into the biodot apparatus (BioRad). MicroEVs were diluted 1:50 in 1 × PBS (total 50 μL), loaded into wells, and vacuum applied. About 200 μL of pooled F8/9 NanoEVs were loaded into each well. Each well was washed twice with MQ water. The membrane was blocked in blocking buffer (Abcam) for 1 hour at room temperature. Primary antibody, CD61 (ab75872, clone EPR2417Y; abcam), EpCAM (ab213500; abcam), CD45 (LCA-L-CE; Leica), and CD235a (349104, clone HI264; Biolegend), was incubated overnight at 4°C or for 1 hour at room temperature in blocking buffer. The membrane was washed 3 × 5 minutes and incubated with secondary conjugated HRP antibody (Anti-Rabbit 111-035-144 and Anti-Mouse 115-035-003; Jackson ImmunoResearch Laoratories) for 1 hour at room temperature. The membrane was washed and protein was detected using GE ECL on BioRad ChemiDock. Densitometry of the spots was performed using FIJI software.
Hemolysis assay
Hemolysis was detected using 100 μL plasma, read in Synergy 2 (BioTek, Agilent) plate reader at 414 nm. Readings were normalized to the lowest sample value.
Statistical anyalysis
Visual representation and data analysis were performed using GraphPad Prism (version 8.3.0). Two-way analysis of variance was performed with a post hoc Sidak test.
Results
NanoEV isolation from plasma
To assess whether tube type and processing delay affect MicroEV and NanoEV characteristics in the main study (schematic in Fig. 1) we first optimized the method of NanoEV purification from trial plasma samples (n = 3). SEC methodology (qEV) was shown to be reproducible for isolation of NanoEVs and for the removal of substantial amounts of contaminant free protein (Fig. 2A—representative sample shown). Characterization of the isolated NanoEVs by Nanoparticle Tracking Analysis (NTA) confirmed the size is exosome-like with a peak at 100 nm (Fig. 2B). TEM further confirmed the morphology of NanoEVs and their approximate size (Fig. 2C). From these optimizations we pooled F8 and F9 as the NanoEV rich fraction and F17 for the protein-rich, EV-poor fraction for analysis in the rest of the study.
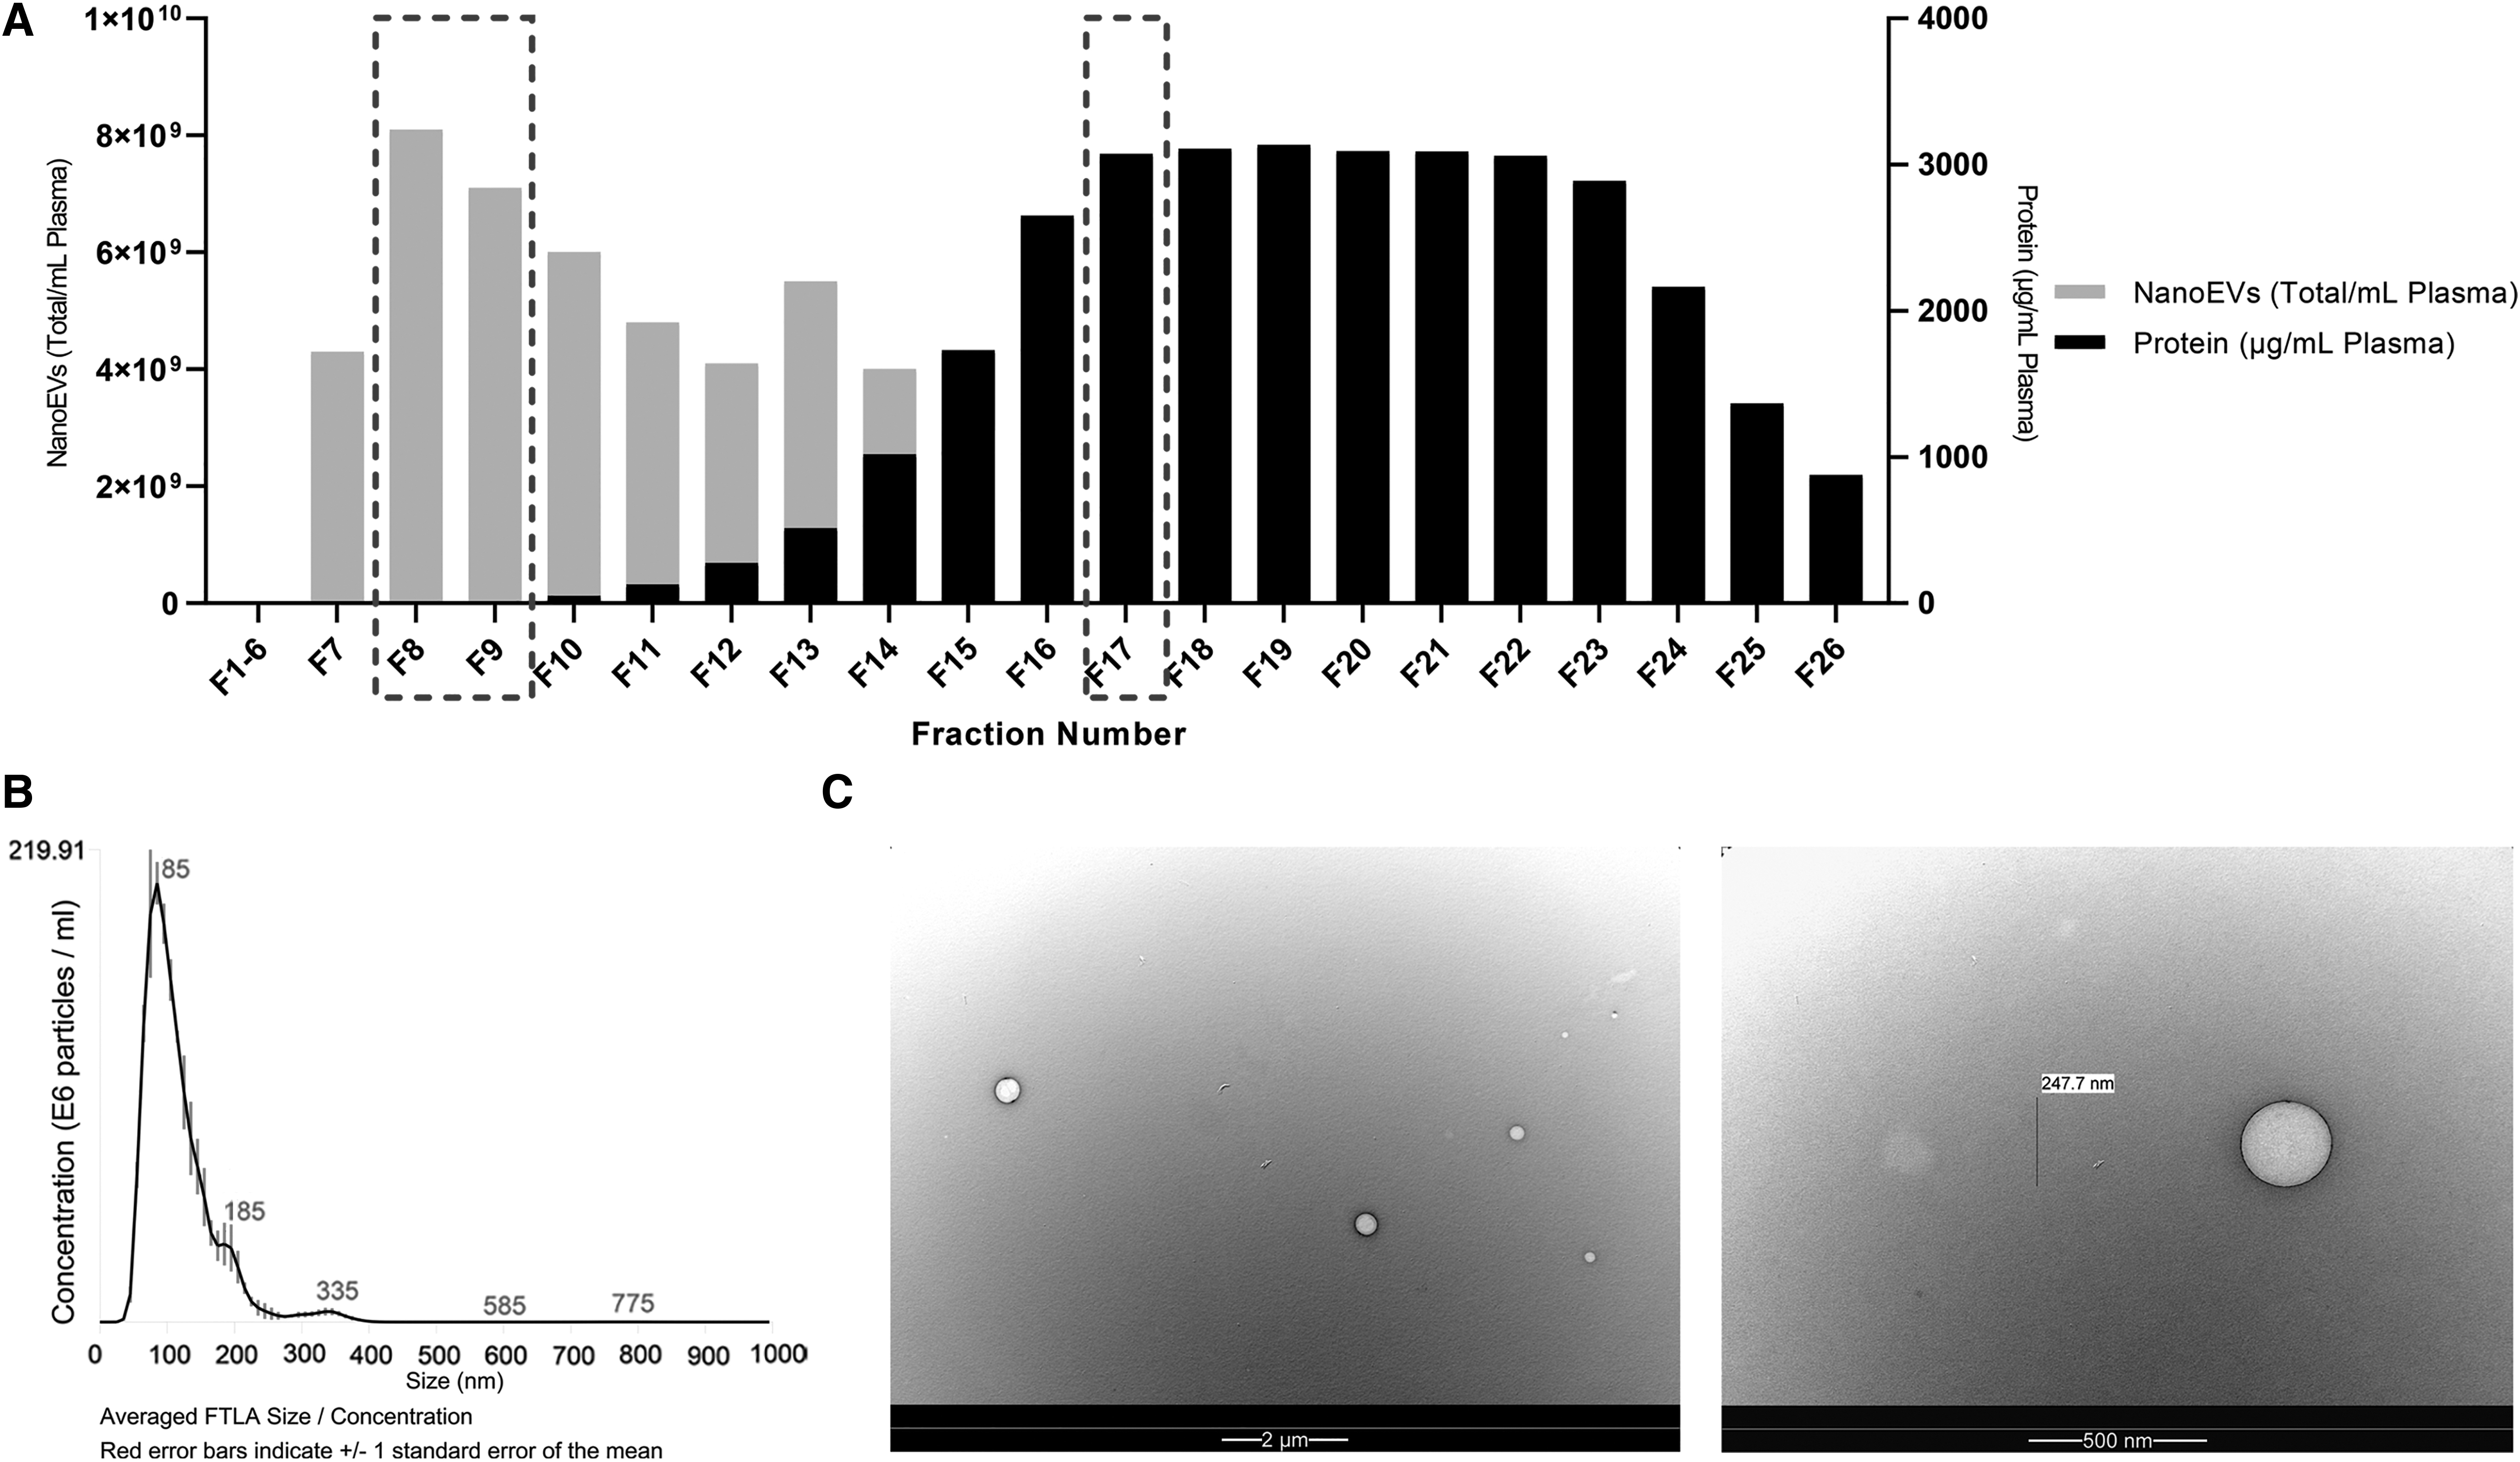
Representative plasma NanoEV isolation by SEC.
Hemolysis of blood tubes
In the main experiment (Fig. 1), we first assessed erythrocyte stability using a simple plasma hemolysis assay (Fig. 3). At the 1 hour processing timepoint there was minimal difference between tube types for hemolysis. At 3 days, chosen to model the time that it may take for a blood sample to be delivered to an analysis laboratory from a rural location, both the EDTA and Roche tubes showed an increase in hemolysis, while the Streck tube had no change after 3 days of storage although none were statistically significant. To note, after a 3-day processing delay, the volume of recoverable plasma was noted to decrease (∼5%) but only in the EDTA vacutainer.
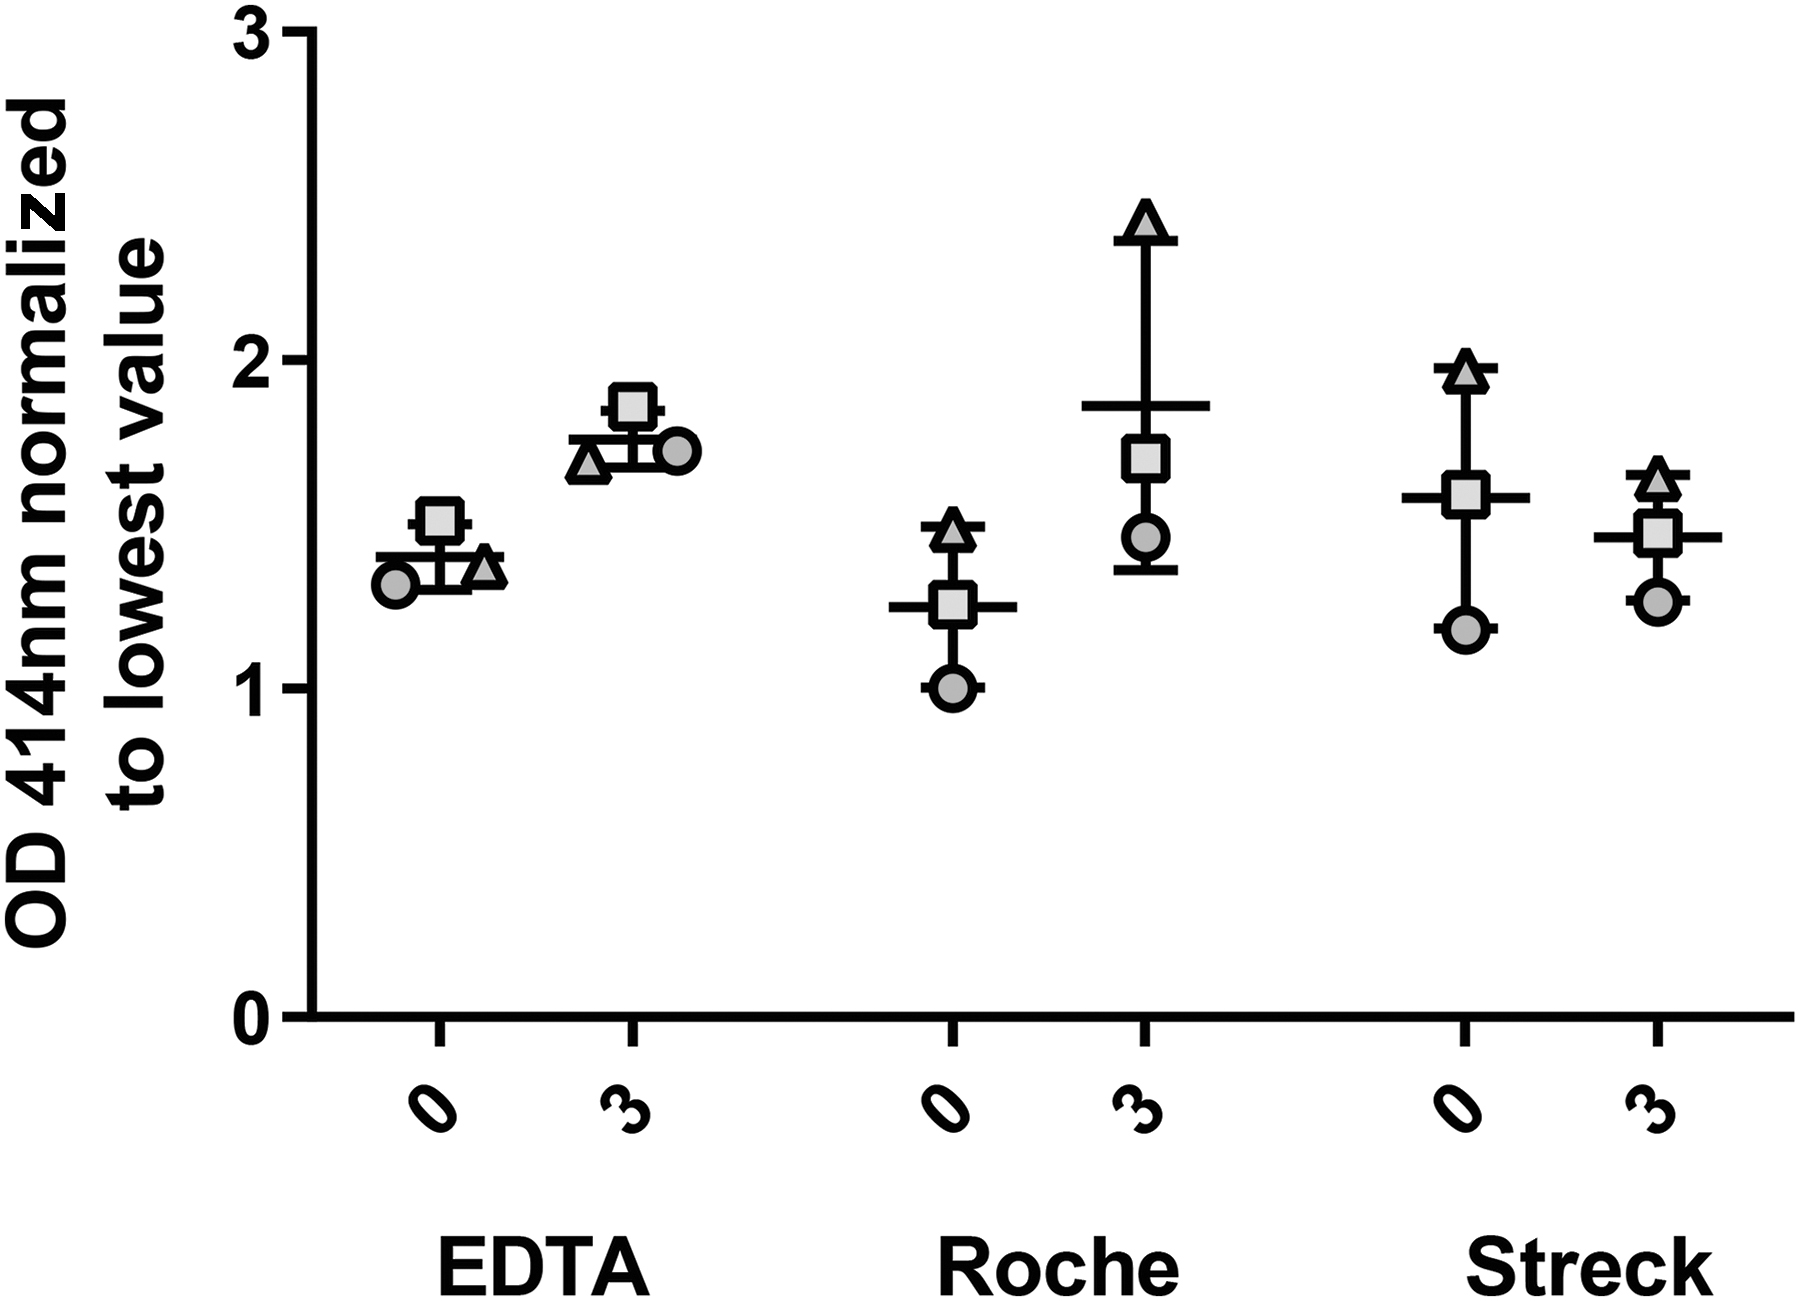
Streck tubes minimized hemolysis during whole blood storage. Graph of plasma 414 nm plate reader data. Data normalized relative to the lowest reading. X axis shows time (Day 0 and 3) and collection tube type.
Effect of blood processing conditions on NanoEVs
EVs were analyzed for particle number, size, and protein content. These features were used to assess whether there was an increase in number or type of EVs during processing or storage. We hypothesized that the 1 hour tubes would have equivalent numbers of EVs and that differences between tube types would be evident upon storage for 3 days. However, the number of NanoEVs from 3-day tubes were comparable to immediately processed tubes, with the count dependent on the individual donor more than the storage time or tube type (Fig. 4A). Interestingly though, the protein content of the NanoEV fractions from 3-day stored tubes increased, although not significant due to individual variation. This effect was particularly seen for the EDTA and Roche tubes, suggesting that free protein becomes associated with the surface of the NanoEVs (Fig. 4A). This pattern matches the increased levels of hemolysis in the same conditions (Fig. 3). Free protein amounts in representative protein-rich qEV F17 (Supplementary Fig. S1) showed that delay to processing increased the quantity of free protein in the EDTA tubes but levels decreased in the Roche and Streck tubes, suggestive of cellular stabilization or adherence of free protein to the NanoEVs collected in fractions 8/9.
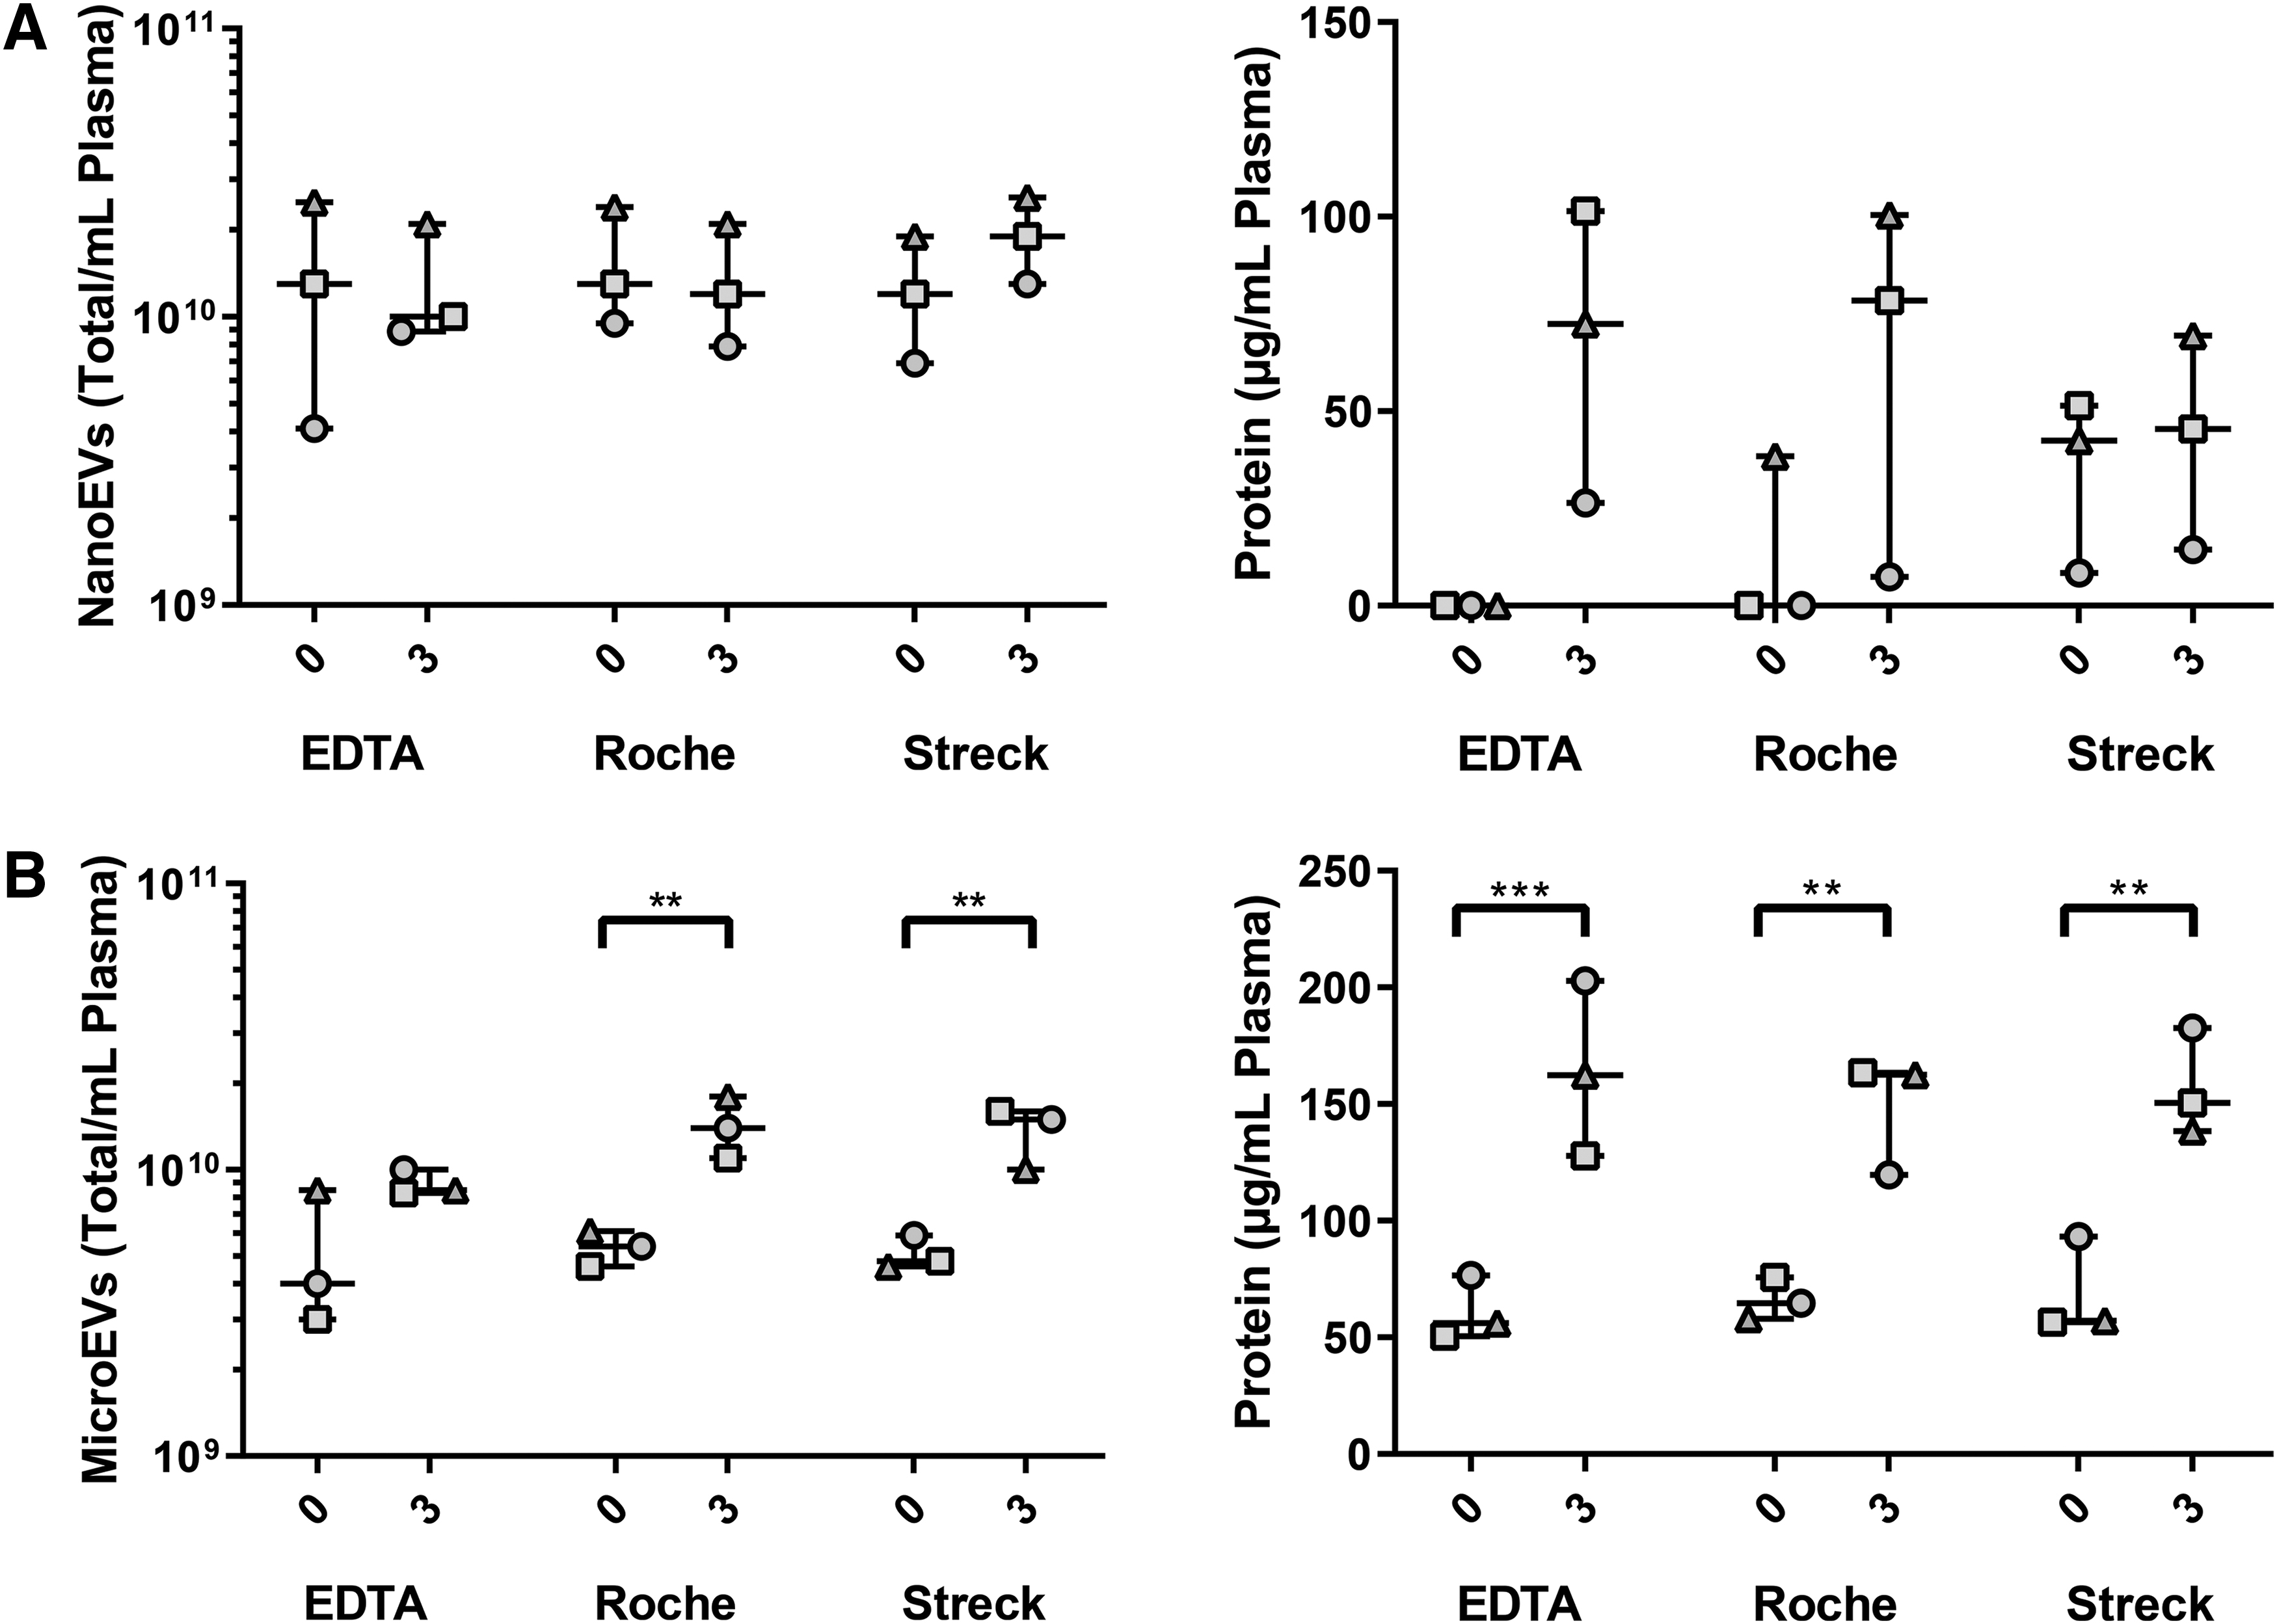
MicroEV and NanoEV protein and particle analysis based on different blood collection tubes and preprocessing time. (
Effect of blood processing conditions on MicroEVs
With the known effects of delayed storage on microparticle production19,20 we also assessed the particle number, size, and protein yields from the 10,000 g pellet (Fig. 4B). We note that the processing protocol was designed to produce platelet-poor plasma before isolation of the MicroEV pellet, however, there may be some cellular contamination within these MicroEV samples. Similar to the NanoEVs there was increased protein amount after 3-day plasma processing, this time significant. However, we also noted a matched increase in the MicroEV particle counts suggestive of microparticle production from blood cells during storage.
Cell origins of EVs
To assess the cellular origins of the MicroEVs and NanoEVs and their associated proteins, we performed immunoblotting for red blood cells (RBC, erythroid precursors, and erythrocytes CD235a—glycophorin A), platelets, megakaryocytes, and platelet thrombi (CD61), hematopoietic cells (CD45), and epithelial cell (EpCAM) surface markers. These proteins have all been shown to be associated with EVs previously.21,22
For the MicroEVs, although visible trends are seen, particularly with an increase in blood cell proteins with delay to processing, few of the changes were significant (Fig. 5 and Supplementary Fig. S2). It is clear that a major source of MicroEVs and their associated proteins in the blood are CD61+ and CD235a+ cells. We also tested for EpCAM, an epithelial cell membrane protein with the hypothesis that these cells are not normally present in blood and therefore levels should not increase with storage time. This was confirmed for all samples except for one tube that we hypothesize could have been contaminated by skin cells during phlebotomy.

Quantitated dot blot for MicroEV and NanoEV markers of epithelial cells (EpCAM), red blood cells (CD235a), leukocytes (CD45), and platelets (CD61). Densitometry performed in FIJI software. X axis depicts delay time to processing (Day 0 and 3) and blood tube type (E, EDTA; R, Roche; S, Streck). Two-way ANOVA performed with post hoc Sidak test *p < 0.05, **p < 0.01, ***p < 0.001.
Despite the low protein yields from the NanoEV population as seen in the bicinchoninic acid assay (BCA) (Fig. 4), by utilizing dot blot apparatus, we were able to load a large volume (200 μL) of pooled NanoEV fractions to detect membrane markers (Fig. 5). Significant changes in blood cell derived protein markers with the delay to processing were detected for CD61, in all tube types and for CD45, in EDTA tubes only. This suggests that the specialized blood tubes are able to stabilize nucleated hematopoietic cells but not suppress platelet activation/lysis.
In summary, the dot blot data suggest that the majority of MicroEV protein arises from platelets whereas RBC are the main donor for NanoEV associated protein in the day 0 samples. Delay to processing leads to significant increases in platelet derived protein CD61 associated with NanoEVs, irrespective of the collection tube type.
Discussion
In an age of liquid biopsies and an overwhelming number of options for sample collection, tissue bankers face the challenge of standardizing protocols to ensure that they are fit for downstream purpose, even when it is unknown at the time of collection. This crystal ball gazing approach to protocol design futureproofs to ensure that multipurpose samples are collated during research studies. Many clinical studies are not, however, designed with the eye of a tissue banker and therefore specific, single purpose protocols and specialized blood collection tubes are increasingly being used. In light of this, we assessed the feasibility of repurposing cfDNA stabilizer tubes for the analysis of another valuable liquid biopsy biomarker, EVs.
Our approach assessed two forms of cfDNA tubes from Roche and Streck against a gold standard multipurpose EDTA vacutainer using a double spin processing protocol that is often used for cfDNA research.23,24 A double spin protocol is also suitable for EVs where sequential centrifugation is commonplace retaining the MicroEV in a 10,000 g pellet and the NanoEVs remaining in the subsequent plasma supernatant.9,25,26 Both cfDNA and EV protocols aim to do the same thing, remove cellular material that can contaminate the markers that could dilute a rare disease associated signal with normal blood cell derived molecules. Delays in processing are a challenge for both cfDNA and EVs as cell lysis releases unwanted material into the subsequent plasma. To buy time for processing, cell stabilizer tubes, like those used here from Streck and Roche, are often used in clinical studies.27,28 These provide convenience for shipping to a central site before processing and therefore allow improved equity for rural community testing. The stabilizers are, however, proprietary and therefore it is not fully known if they are able to stabilize all cells or only the nucleated cells as claimed in their marketing material. This is important for EVs as the major donors in blood are platelets and RBCs, both of which can cause issues due to activation and lysis leading to EV production.29,30
In this study we were first able to show that sequential centrifugation and SEC was appropriate to remove significant quantities of contaminant plasma protein from the NanoEV preparations. From the data herein it was clear that at an optimal timepoint, processing within 1 hour of phlebotomy, tube type has minimal effects on the NanoEV and MicroEV numbers present within the plasma. The major differences in particle counts at this timepoint were seen between donors. Recoverable NanoEV numbers from plasma were generally consistent across tubes and timepoints, however, the protein content considerably increased with a delay in processing arising from multiple blood cell types. A delay to processing has previously been reported to lead to hemolysis, even in specialized cfDNA blood tubes, a finding supported from our own data, with an associated increase in RBC-derived miR-451a in stored samples, 31 an effect most prominent in Streck tubes in their study. That study also trialed two further specialized cfDNA tubes (PAXgene and Norgen cfDNA tubes) that were shown to stabilize RBCs. They are therefore worthy of inclusion in a future EV study to assess whether they can limit preprocessing EV contamination through reduction of cell lysis. Another study found an increased stability of nucleated cells (assessed by cellular DNA release) and non-nucleated RBC (assessed by hemolysis) in Roche tubes when compared to Streck or EDTA tubes during storage. 32 They also noted that nucleated cells and RBCs had nonsynchronous lysis during storage. It was interesting to note that here, we also found that the levels of NanoEV associated “blood cell derived” proteins, in particularly CD45 and CD235a, were marginally lower in the Roche tubes further supporting that they may be more superior in stabilizing lysis and cell activation than the other tubes trialed.
Returning to the question of whether specialized blood collection tubes can be used for EV analysis, this study has supported the feasibility but provides a warning that simple counting of plasma MicroEVs as a marker of disease state can be confounded by processing conditions. In contrast, the number of NanoEVs were stable, even with a 3-day delay to processing but their associated surface proteins increased through contaminant cell lysis. Therefore similarly, the NanoEV total protein amount is not a suitable surrogate for EV quantity in these samples. If repurposing plasma samples, selective analysis of proteins that are specific for disease state, if known, is recommended rather than using global analysis. Many selective approaches focus on the analysis of a disease-specific subpopulation of plasma EVs commonly through the use of surface proteins not otherwise found on blood cells, 33 therefore removing some of the issues with variability in preprocessing protocols. For example, EpCAM+ EVs, derived from epithelial cells and often elevated in number in cancers, were detectable and stable for abundance in all conditions trialed here. 34
In summary, we have shown that specialized cfDNA tubes can be repurposed for use for EV analysis, however, cautioning that platelet activation and RBC lysis can contribute to an increase in contaminant EVs and surface proteins. With this knowledge we advise that simple whole population EV counting is not appropriate on this stored material. However, selected populations of EVs, for example EpCAM+ EVs remain stable in quantity and therefore valuable for use in disease biomarker analysis.
Footnotes
Acknowledgments
We would like to thank the blood donors and the Auckland Regional Biobank, particularly Alice Rykers for recruiting donors for phlebotomy. We would like to thank the Hub for Extracellular Vesicle Investigations for access to equipment for EV isolation and analysis.
Author Disclosure Statement
No conflicting financial interests exist.
Funding Information
Funding was provided for this study from the Translational Medicine Trust, University of Auckland.
References
Supplementary Material
Please find the following supplemental material available below.
For Open Access articles published under a Creative Commons License, all supplemental material carries the same license as the article it is associated with.
For non-Open Access articles published, all supplemental material carries a non-exclusive license, and permission requests for re-use of supplemental material or any part of supplemental material shall be sent directly to the copyright owner as specified in the copyright notice associated with the article.