
Abstract
Objective:
Inappropriate handling of cells can generate modifications in the genomic DNA. The additional risk is cross-contamination. Isoenzyme analysis with gel agarose electrophoresis is a known, fast, and cheap technique for detection of species-specific isoforms of intracellular enzymes. The aim of the experimental work was to check if variations in the cell growth conditions can affect morphology and/or nuclear anomalies including micronuclei (MN) in the L929 cells; and to define how sensitive and selective is the classic gel agarose electrophoresis for analysis of isoforms of the selected enzymes to detect cross-contamination of L929 cultures with HeLa cells or with the related species, such as CHO-K1 cells, in the case of unavailability of the commercial kits.
Methods:
The experiments were done with use of the National Collection of Type Cultures clone 929 (L929)—mouse fibroblasts from subcutaneous connective tissue; HeLa—human cervix adenocarcinoma; and CHO-K1—epithelial-like hamster ovary cells. Cell morphology was evaluated with a light/fluorescence microscope. MN were determined with the cytokinesis-block micronucleus assay, and the isoenzyme analysis was performed using gel agarose electrophoresis.
Results:
As shown, the overgrown cultures result in a significant increase of the MN in the L929 cells. The band patterns for lactate dehydrogenate, glucose-6-phosphate dehydrogenase, or malate dehydrogenase allow identification of the single L929, HeLa, or CHO-K1 cell line and to detect the cross-contamination, even up to 0.4%.
Conclusions:
There can be no exceptions from the recommended cell culture conditions in the passage scheme. The sensitivity of the gel agarose separation depends on the cells and on the type of enzyme tested and seems to be sufficient in a quick screening of the CHO-K1, L929, or HeLa cell cultures through the possible mutual contamination.
Introduction
The European norm EN ISO 10993 and the guidelines of the Organization for Economic Co-operation and Development (OECD) concerning biomedical research in vitro clearly define the type and quality of the cells required for the tests. One of the cell lines recommended by the guidelines is mouse fibroblasts—National Collection of Type Cultures (NCTC) clone 929 (L929). For example, according to the norm EN ISO 10993-5, 1 which concerns the biological evaluation of medical devices, it is important to check cells regularly (e.g., morphology, doubling time [DT], modal chromosome number) because sensitivity of the tests can vary with cell passage number. This is related to the dependence between the age of cell cultures and occurrence of phenotypic as well as genotypic changes. It is well documented 2 that cell characteristics can change when cell lines are cultivated for extended periods. The other problems with cell cultures used in the biomedical sciences are misidentification, cross-contamination, and mycoplasma infections. 3
According to the American Type Culture Collection (ATCC), 2 cell growth during the exponential/log phase is fairly constant and reproducible for a given set of growth conditions. DT is reported as one of the representative features of cell stability in vitro. 4 The micronuclei (MN) and other nuclear anomalies, such as nucleoplasmic bridges (NPBs) and nuclear buds (NBUDs), which are reported as biomarkers of genotoxic events and chromosomal instability, may be detected with the cytokinesis-block micronucleus assay (“cytome” assay), which makes it possible to detect the above damages simultaneously.4–7
According to the ICH guideline, 8 isoenzyme analysis, although a little obsolete, is still sufficient to confirm the species of origin for cell lines derived from human or animal sources. The additional advantage of this technique is that it is relatively cheap, easily performed, robust, and returns rapid results. These are the features that encouraged us to reactivate that method for laboratory use for detection of cross-contamination in the cell cultures we studied, especially when the commercial, and dedicated to this purpose, AuthentiKit™ is unavailable. The key issue arises: is this classic version of that method sensitive enough?
The aim of the work was as follows: to check if any alterations of the cell growth conditions can affect phenotypic and/or genotypic stability in L929 cells; and to determine the usefulness and sensitivity of the isoenzyme analysis (lactate dehydrogenate [LDH]; and using glucose-6-phosphate dehydrogenase [G6PD] and malate dehydrogenase [MDH]) for the detection of L929 cross-contamination with CHO-K1 or HeLa cells.
The research encompassed the following:
Studies on the impact of high-density cell cultures (passages every 96 hours minimum instead of the recommended every 48 or 72 hours) or use of an expired growth medium on cell morphology, DT, proliferation rate (PR), and genetic stability measured as MN, NBUD, or NPB formation. The verification of LDH, G6PD, and MDH profiles in the L929, HeLa, and CHO-K1 cells with agarose gel electrophoresis and determination of the limit of detection (LOD) of cross-contamination with HeLa or with CHO-K1 cells in L929 cell cultures.
Methods
Ethical statement
The conducted research did not require the consent of the Ethical Committee. No procedure involved human participation or the use of laboratory animals.
Cells
Cells were purchased from ATCC (USA): NCTC clone 929 (L929)—mouse areolar fibroblasts from subcutaneous connective tissue (ATCC-CCL-1, USA); HeLa—human epithelial cervix adenocarcinoma (ATCC-CCL-2); and CHO-K1—epithelial-like hamster ovary cells (ATCC-CCL-61).
Cells were cultured in a humidified incubator at 37°C in 5% CO2 in Eagle's minimum essential medium with
All cell cultures used in this experimental study were confirmed to be mycoplasma free as tested according to our in-house quantitative polymerase chain reaction (PCR) protocol.
Cell morphology, DT, and PR
To define how and if the modified culture conditions affect L929 cells in regard of DT, PR, or cell morphology, the cells were seeded in five Nunc flasks, 25 cm2, at the same cell density, that is, 3 × 10⁵ cells per flask. Each 24 hours, the cells from one Nunc flask were trypsinized, resuspended in phosphate-buffered saline (PBS; IITD, Wroclaw, Poland), and automatically counted using a Coulter Z2 (Coulter Corporation, Miami, FL). The initial point was the 24-hour cell culture and the next as follows: 48, 72, and 96 hours. Cell morphology was evaluated at each time point with the use of a fluorescence microscope Eclipse TS 100F (Nikon, Tokyo, Japan). DT and PR values were calculated on the basis of the cell number measurements, according to the following formulas provided by ATCC
2
:
T is the incubation time.
Xb is the cell number at the beginning of the incubation time.
Xe is the cell number at the end of the incubation time.
The cytokinesis-block micronucleus assay
For this test, L929 cells were passaged using 75 cm2 cell culture flasks (Nunc) at a density of 2 × 10⁶ cells per flask and maintained until reaching 90% confluence. Cell dissociation was routinely achieved in the presence of trypsin–ethylenediaminetetraacetic acid (EDTA) (0.5%). Trypsinized cells were resuspended in the culture medium and seeded into a new flask. Twenty-four hours prior the treatment, the cells were seeded into 4-well Millicell® EZ slides (Merck Millipore, Darmstadt, Germany) at a density of 1 × 10⁵ cells/mL in a total volume of 1 mL/well and incubated at 37°C in 5% CO2.
For the purpose of the study, the test was performed in the short- and long-term variants, without metabolic activation. The testing methodology and assay criteria were in agreement with the OECD test guideline 9 and have been adapted to L929 cells by Drozd et al. 10
All of the above parameters, such as cell morphology, MN, NBUD or NPB formation, DT, and PR for L929 cells, were determined in the following variants of the cell growth conditions: after 3 months during which the cells were—subcultured every 48 and 72 hours (recommended scheme of passaging) and kept in the recommended conditions (the reference cultures) or—kept in the recommended conditions but passaged every 96 hours minimum (high-density cell culture).
After 3 months of cultivation, the cells were passaged properly but kept in the expired growth medium (FBS and antibiotics were used in the validity period).
All experiments were conducted in full twice.
Isoenzyme analysis
L929, HeLa, or CHO-K1 cells were seeded in 75 cm2 cell culture flasks (Nunc) at a density of 8 × 10⁵ cells per flask and kept in the recommended conditions for 48 hours. The cell extracts and agarose gel electrophoresis were performed according to Machado et al.11,12 Trypsinized cells were resuspended in PBS and centrifuged (150 g for 5 minutes) at 4°C. The cell pellets were washed with PBS and centrifuged twice. The cells were resuspended in 200 μL of extraction buffer (2% Triton X-100 in 50 mM Tris and 1 mM EDTA, pH 7.5) and maintained on ice for 20 minutes. The obtained lysates were centrifuged at 1900 g for 5 minutes at 8°C, and the supernatant was stored at −70°C. The electrophoresis was performed using 2% agarose gel in 0.375 M Tris buffer pH 8.8 and in 25 mM Tris/0.19 M glycine pH 8.3 as the electrophoresis buffer.
The cell lysates were applied to a gel with 0.06% bromophenol blue/10% glycerol at 3:1 proportion and run for 2 hours at 100 V and 4°C. The bands were revealed using the appropriate LDH stain solution (0.05 M Tris pH 7.5; 0.1 M sodium lactate; 1.5 mM β-nicotinamide adenine dinucleotide [β-NAD]; 0.24 mM 3-(4′-5′-dimethyl-2-thyazolyl)-2,5-dipheny2H-tetrazolium bromide [MTT]; 0.13 mM phenazine methosulfate [PMS]). The G6PD staining solution was composed of 2.5 mM glucose-6-phosphate, 0.05 M Tris pH 7.5, 0.01 M MgCl2·6H2O, 0.5 mM β-nicotinamide adenine dinucleotide phosphate (β-NADP), 0.24 mM MTT, and 0.13 mM PMS. For MDH, a combination of
The only difference in the experimental procedure used in our studies was the longer time needed for detection of the bands characteristic for LDH or G6PD, that is, up to 3 hours instead of ∼30 minutes. The shorter time of color development resulted in unsatisfactory resolution and low intensity of the bands, which was tested on the example of LDH analysis in the L929 cells. The volume of extracts loaded onto the gel was 6 μL, which was defined as the optimal to obtain the best intensity and resolution of the bands.
Cross-contamination
To confirm the usefulness and sensitivity of the isoenzyme analysis in the detection of cross-contamination with other cells kept in the same laboratory, the L929 cell extracts were mixed with cell extracts of HeLa or CHO-K1 creating contamination at the levels from 50% to 0.2%.
Results
Impact of the altered cell growth conditions on L929 cell cultures
L929 cells turned out to be less sensitive to exceeding the expiration date of the culture medium than expected. The cells cultured for 3 months in the medium expired by a year (except antibiotic and FBS used within the validity period) did not show any changes in morphology or the rate of growth (measured as DT and PR). Any increase in the MN formation or in the appearance of NPBs or NBUDs was also not noted (Supplementary Figs. S3 and S4). DT, PR, and percent of MN were comparable with the reference culture (DT ± SD: 26.60 ± 1.60 hours vs. 26.80 ± 3.20 hours, respectively; PR ± SD: 0.04 ± 0.00 for both; MN ± SD in short-term test: 3.85% ± 0.48% vs. 3.74% ± 1.37% and MN ± SD in long-term test: 5.07% ± 0.47% vs. 4.25% ± 0.67%, respectively).
The most changes in the L929 cells occurred in the high-density cultures, that is, passaged every 96 hours minimum, instead of 48 or 72 hours. First, we observed the increased number of cells with changed morphology, that is, the fibroblast-like, with an irregular shape or multinucleated cells, with abnormal appendages, intracytoplasmic granules, and well-visible vacuoles (Supplementary Fig. S5). Second, the cells showed the changed parameters of growth, that is, DT was 6 hours shorter and PR was higher than in the reference culture. The following results were presented including SD: that is, 20.45 ± 1.06 hours versus 26.80 ± 3.20 hours and 0.05 ± 0.00 versus 0.04 ± 0.00, respectively.
The most important result is that in the overgrown cultures of L929, there was observed the significant increase in MN number compared with the reference cultures, that is, in the short-term test 10.03% ± 1.29% versus 3.74% ± 1.37% (Student's t-test; p-value <0.05) and in the long-term test 13.43% ± 1.12% versus 4.25% ± 0.67% (Student's t-test; p-value <0.05), respectively. Apart from the higher number of MN, there were noted also other nuclear anomalies, such as NBUD-like forms (Fig. 1A–C).

L929 cultures conducted in the conditions as follows: in the recommended conditions (the reference culture), 40 × magnification with normal nuclei, long-term test
LDH, G6PD, and MDH isoenzyme profiles and detection of cross-contamination
Three bands characteristic for LDH were revealed in the L929 cells (Fig. 2A—a and Supplementary Fig. S1A—a). The most, that is, five bands, were revealed in the HeLa cells and only one band was shown in the CHO-K1 cells (Fig. 2A—b, c, and Supplementary Fig. S1A—b, c).
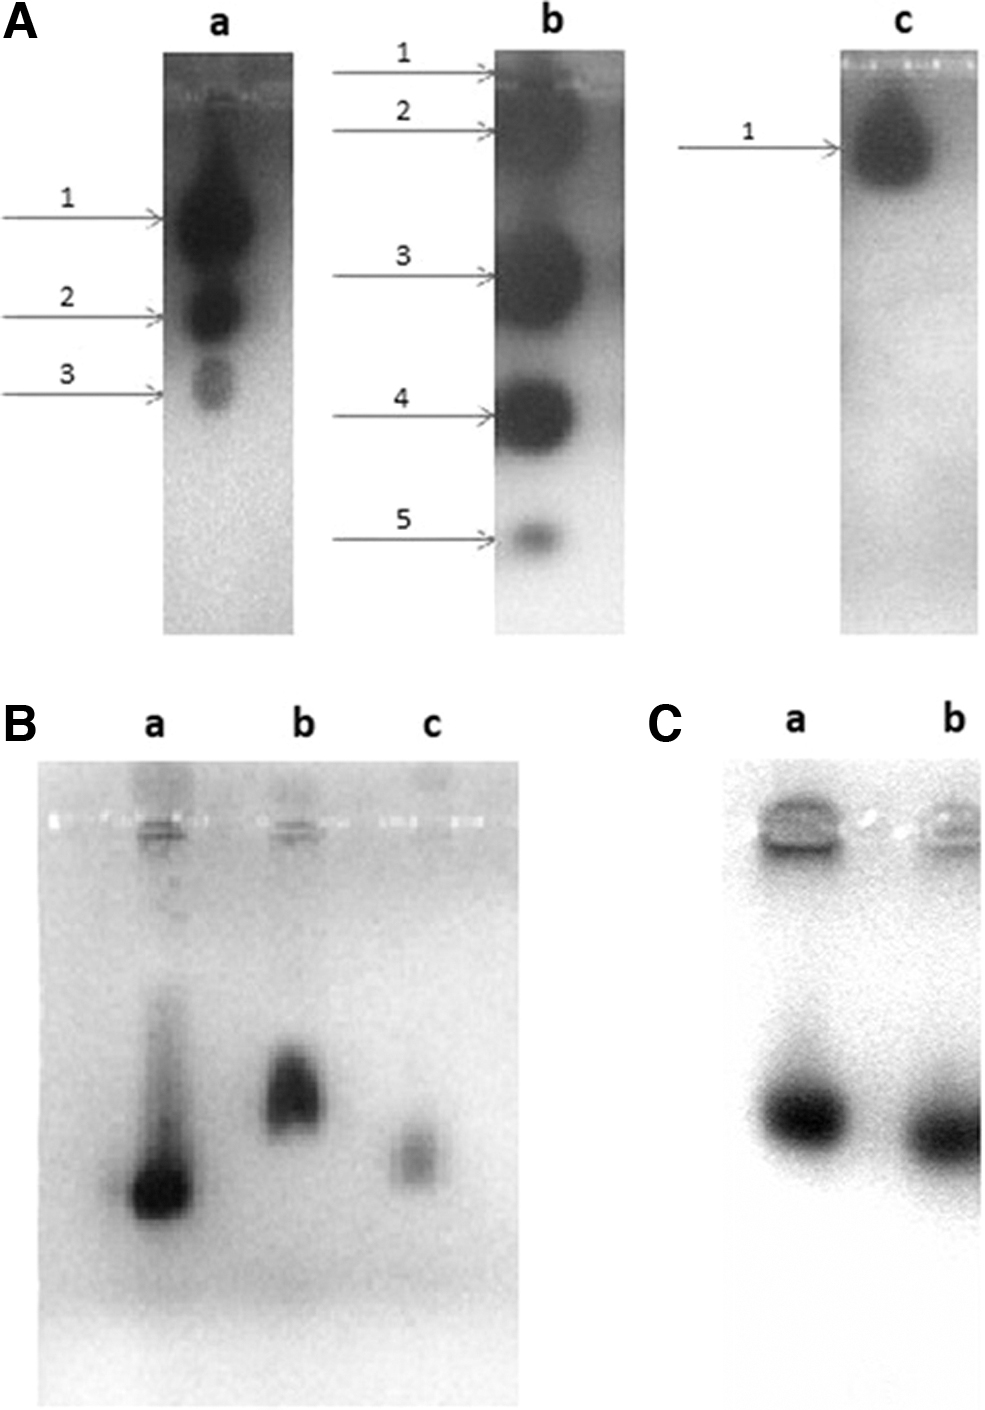
G6PD was represented by one band visualized in gel agarose electrophoresis in the cells of each of the cell lines tested (Fig. 2B—a–c).
To check the assay repeatability, five repetitions of each experiment were performed for both isoenzymes in each cell line. As shown in Table 1, for each isoenzyme, SDs from the average of the band migration distance values were relatively low. Otherwise, the band patterns for LDH and G6PD, characteristic for L929 and HeLa cells, varied greatly, whereas on the basis of the same isoenzymes, the contamination of the L929 cell cultures with other rodent cell lines, such as CHO-K1, could not be detected.
Migration Distance Values for Each of the Lactate Dehydrogenate, Glucose-6-Phosphate Dehydrogenase, or Malate Dehydrogenase Bands (n = 5)
NA, not applicable.
As shown in Figure 2A (a, c) and B (a, c) and Supplementary Figure S1A (a, c), the visualized bands obtained from CHO-K1 and L929 cells overlapped with each other. The band patterns characteristic for the other enzyme—MDH in the L929 as well as in CHO-K1 cells, were revealed as only one clear band with a slight but visible difference in the migration distance between these cell lines (Fig. 2C—a, b, and Table 1 and Supplementary Fig. S1C). A quite strong intensity was noted for almost all bands characteristic for LDH and G6PD in the case of all cell lines tested. Despite the same quantity of the loaded protein, the band for G6PD in CHO-K1 was poorly visible and not regular in shape (Fig. 2B—c).
To verify if the LDH or G6PD isoenzyme analysis can help to detect the potential cross-contamination of L929 cell cultures with human cells, the cell extracts of L929 cells were mixed proportionally with the cell extracts of HeLa. The L929 cell cultures were contaminated with HeLa cells from 50 down to 0.2%. Surprisingly, in our study, LDH isoenzyme electrophoresis has proved to be a very sensitive method to detect relatively low levels of cross-contamination of the L9292 cell cultures with HeLa cells. The LOD for contamination of the L929 cell cultures with HeLa cells was 0.4% (Fig. 3C—a–h). Below 0.4%, the bands specific for HeLa cells, which were visible on the gel, were too fuzzy even to suggest any contamination (Fig. 3C—f, g, and Supplementary Fig. S2C).
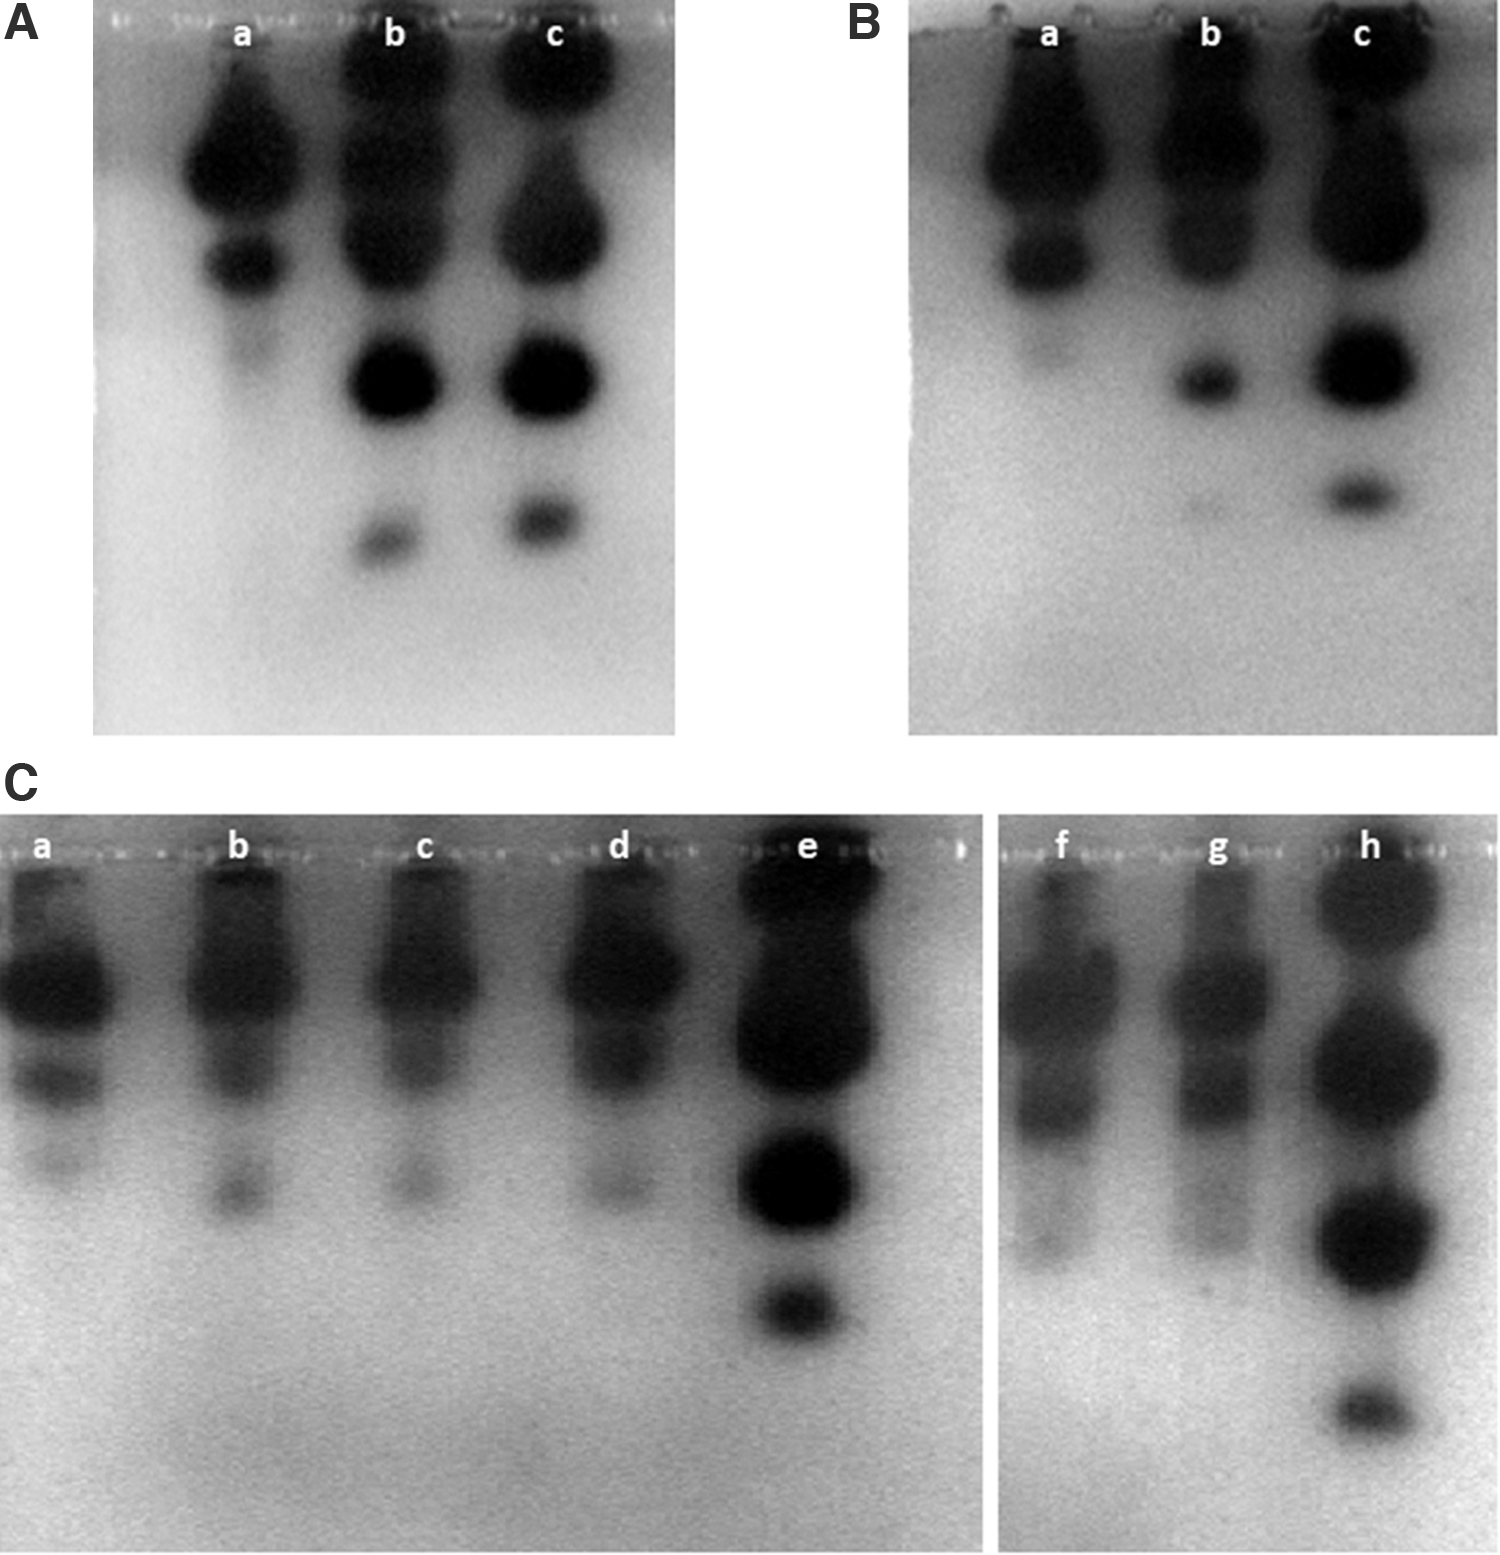
Gel agarose electrophoresis. Profiles of LDH isoenzymes in the cell extracts of pure L929 cells, pure HeLa cells, or proportional mixtures of the two cell extracts.
Clear detection of the cross-contamination of the L929 cell cultures with HeLa cells due to the G6PD isoenzyme profile was possible only at 20% or more contamination (Fig. 4A—a–e). The G6PD isoenzyme profile in the case of 10% or below of contaminating HeLa cells was useful only to suspect rather than to ascertain the presence of HeLa as contaminants (Fig. 4B—a–e).
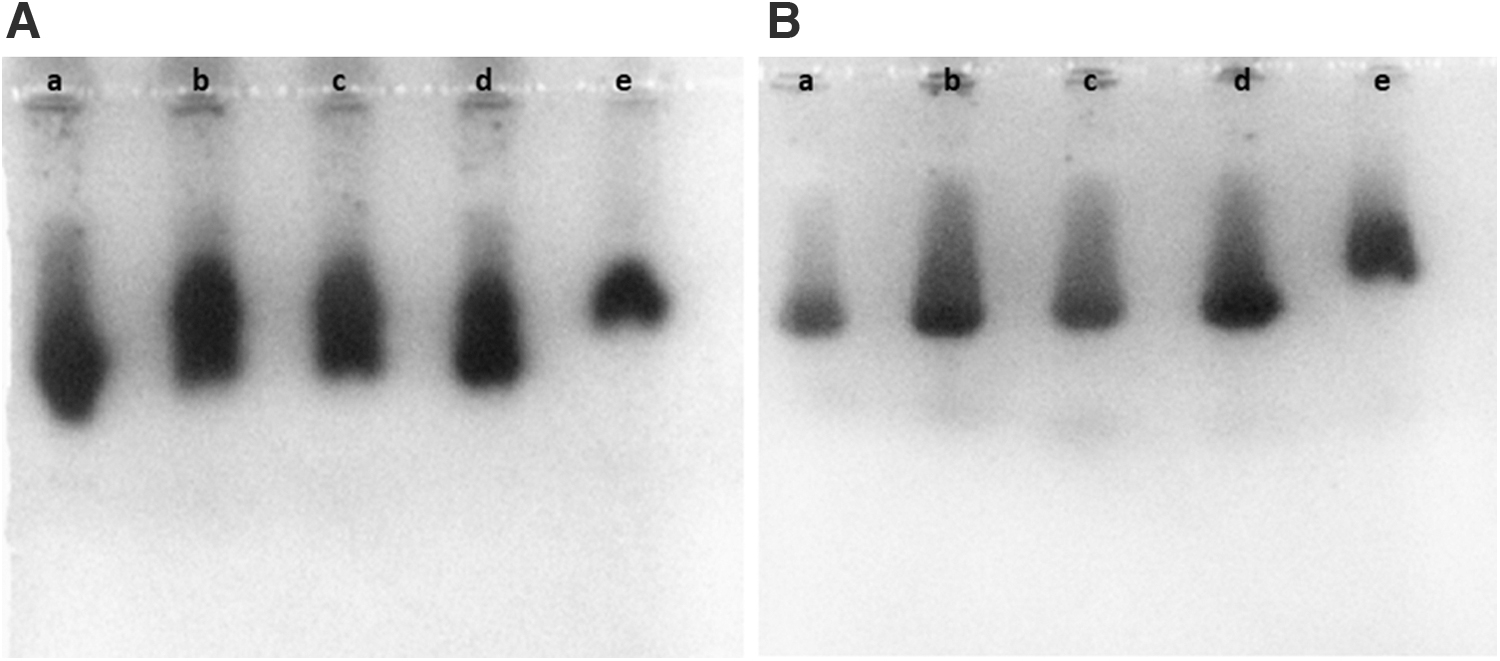
Gel agarose electrophoresis. Profiles of G6PD isoenzymes in the cell extracts of pure L929 cells, pure HeLa cells, or proportional mixtures of the two cell extracts.
To verify if the MDH analysis allows distinguishing cross-contamination of L929 cell cultures with CHO-K1 cells, the cell extracts of both were mixed proportionally. The L929 cell cultures were contaminated with CHO-K1 cells at the 50 down to 0.4% level. The contamination of the L929 cell cultures with CHO-K1 cells was detectable up to 10% (Fig. 5b–d). Below 10%, the MDH pattern on the gel was too fuzzy even to suggest contamination (Fig. 5e, f).
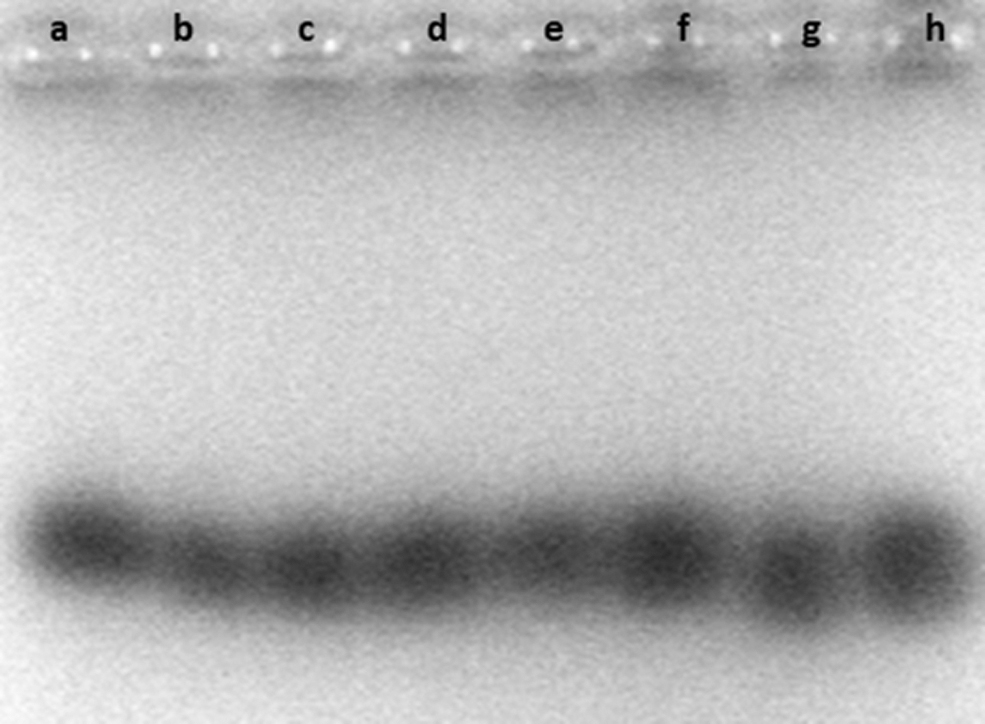
Gel agarose electrophoresis. Profiles of MDH isoenzymes in the cell extracts of pure L929 cells, pure CHO-K1 cells, or proportional mixtures of the two cell extracts: pure L929 cells (a, h); L929 cells with CHO-K1 cells (50%, 20%, 10%, 1%, and 0.4%, respectively) (b–f); and pure CHO-K1 cells (g). The results were obtained from five independent electrophoretic processes.
Discussion
According to the literature, the key point for consideration is the role of the cell culture conditions in the maintenance of stem or primary cell cultures. For the continuous cell lines, such as L929, only general recommendations are given. Jacobs et al. 13 suggested that the high levels of genome instability observed by many laboratories worldwide in the cells cultured in vitro require the development of optimal culture conditions, the key to solving this problem.
As shown, the results of the high-density L929 cell cultures, although not the use of the expired medium, may be the cell culture growth disturbance and MN overproduction, the marker of general unresolved DNA damage and chromosomal instability.14,15 These results are consistent with those obtained by Chow and Rubin 16 in long-term confluent mouse embryonic fibroblasts NIH 3T3. It is worth noting that in our study, the high-density cultures were maintained with the recommended medium refreshment, which excluded the influence of possible acidification of the medium on the cells.
The observed increase of the growth rate in the L929 cells kept at the prolonged confluence, and the noted changed morphology, may suggest a transformation process taking place in the cells, as shown by Chow and Rubin 16 or Pauwels et al., 4 or point to stress-induced aging processes occurring in the cells kept in nonoptimal culture conditions. 17 According to Geraghty et al., 3 the rodent cells, particularly mouse cell lines, readily become unstable and immortalize. The authors emphasize that these cells require constant monitoring and the recommended maintenance procedure should be provided. According to Ladeira et al., 14 the energy balance or growth rates should be taken into account as possible factors that affect cell division or the cell cycle.
Isoenzyme analysis is an efficient, fast, and cheap technique of electrophoretic separation of specific isoforms of intracellular enzymes, for example, LDH, G6PD, or MDH. Isoenzymes are different molecular forms of enzymes that display the same specificity for the defined substrate. Identification of the individual enzyme isoforms is based on analysis of the banding pattern and the relative migration distances for each of them. 18 Despite the poor sensitivity of isoenzyme analysis in comparison with other modern molecular methods, such as nested PCR, it continues to be a very useful and a relatively simple method for routine tests.12,18
In our studies, the isoenzyme profiles of LDH and G6PD in L929 and HeLa cells with regard to the number and intensity of the bands were fully consistent with those presented by Machado et al.11,12 although little shifts in the migration distances were observed. In the study of Nims et al., 18 in the CHO-K1 cells, LDH and G6PD were visualized each as a single band, and in the L929 cells, LDH as two poorly visible bands and G6PD as a one band, for which the authors used AuthentiKit. In this study, with the use of a similar method but not the commercial kit, we showed three bands instead of two, characteristic for LDH in the L929 cells, which suggests the superiority of the method used by us over the commercial kit. The band profiles for G6PD in the L929 and CHO-K1 cells were comparable.
The band patterns of MDH isoenzymes obtained for the L929 and CHO-K1 cells were compared with those visualized by Nims et al. 18 in the same cell lines with the use of AuthentiKit. However, our results were not the same. Nims et al. 18 detected two bands for MDH for each of the cell type and the differences between these patterns were practically unnoticeable. In our study, we detected one band per cell line, that is, L929 or CHO-K1, and the band characteristic for the CHO-K1 cells migrated quite a bit faster than that visible in the L929 cells. This is not fully in agreement with Nims et al. 18 who reported MDH isoforms as not specific for CHO-K1 cells.
In summary, in our study, isoenzyme profiles have proved to be a relatively sensitive marker of cross-contamination of the mouse cells with the human cells (an example of the L929 cells contaminated with the HeLa cells). Such contamination is one of the risk factors during laboratory work, that is, when the cell cultures of different origins are conducted at the same time in one laboratory and it requires minimalization. We fully agree with Nims et al. 18 who recommended the utility of the isoenzyme analysis with gel agarose electrophoresis for the detection of cross-contamination in cell cultures. Because an isoenzyme electrophoresis commercial kit known as AuthentiKit, which was used by the authors, was not attainable for our laboratory, we adapted the method according to Machado et al.11,12 who used it for authentication of the cell lines, as an alternative to karyotyping.
Surprisingly, in our studies, sensitivity of that method was much higher than the sensitivity of the commercial kit. As the authors concluded, the interspecies cross-contamination with isoenzyme analysis can be detectable at the level of 10% maximum.13,18 Also, Ramya et al. 19 submitted that the isoenzyme analysis fails to reveal the presence of the cross-contamination below 10% and suggested that the sensitivity of isoenzyme analysis may be less than the other methods used for the detection of mixtures of cells derived from other species. On the basis of this study, we cannot share this opinion.
We proved that LDH and G6PD electrophoretic patterns allow detection at 1.0% or below of interspecies cross-contamination as the example of HeLa cells contaminating the L929 cell cultures. Even though in the case of G6PD detection at the level of contamination below 10%, we preferably say about the suspicion of the presence of the other, although not strictly defined, cell line.
As we suggest, the huge difference in the sensitivity of the LDH/G6PD isoenzyme analysis compared with other authors could be explained by the longer time of color development, that is, ca. about 3 hours instead of 20–30 minutes practiced by both Machado et al.11,12 and Nims et al. 18 Consistent with other authors, we also confirmed that on the basis of LDH and G6PD isoforms, it is not possible to differentiate the rodent cell lines, such as L929 and CHO-K1. 18 Machado et al. 12 also proved that LDH isoforms do not distinguish the other hamster cell line—BHK-21 (Syrian hamster kidney cells) from the L929 cells. The authors noted that MDH separated on the agarose gel made it possible to differentiate L929 cells and the hamster cell line—BHK-21, similar to the results obtained in our study with L929 and CHO-K1 cells.
As shown by Machado et al., 12 the band from MDH was the only one for each of the cell lines, but in the case of the BHK-21 cells it migrated slower. 12 These results clearly prove that the efficacy of that method is higher, and a broader set of enzymes is controlled. According to Machado et al., 11 the accuracy of the results may increase further if two or more isoenzymes are verified. Of course, the verification of as many isoenzymes as possible gives more reliable results concerning the identification of cell contaminations.
Conclusion
On the basis of our study with the L929 cell cultures, it can be said that there can be no exceptions from the recommended cell culture conditions in the passage scheme, while the expiration date defined for the growth medium does not have to be strictly adhered to, at least for 1 year afterward. With regard to the results of other authors, we also proved that the isoenzyme analysis with gel agarose electrophoresis is still the method that can be an excellent alternative for the AuthentiKit.11,12,18 As shown in this study, excellent sensitivity (in some cases up to 0.4%) of the gel agarose electrophoresis seems to be sufficient in a quick screening of the used cell cultures, as CHO-K1, L929, or HeLa through the possible mutual contamination, and can be successfully included in the laboratory routine control procedures, on par with mycoplasma monitoring.
As shown, even a little change in the electrophoretic patterns may indicate that the checked cell culture should not be used for further studies. In this context, the goal of our study has been fully achieved. Another conclusion that clearly follows this study is that the sensitivity of the gel agarose separation depends on the type of cells and enzymes. Because of that, the recommended method should be validated whenever it is used for another cell line or another intracellular enzyme.
Footnotes
Author's Contributions
B.G.-B.: Developed the concept, designed the research, performed data analysis and interpretation, and editing and approving the final version of the article. Supervised the whole work. I.B., P.S., and J.P.: acquisition of the data. I.B. and J.P.: contributed to analysis and interpretation. J.P.: drafted part of the article. E.D.: acquisition of the data, and contributed to analysis and interpretation. Participated in the finalization of the article.
Author Disclosure Statement
No conflicting financial interests exist.
Funding Information
This work was supported entirely by the research fund from the Polish Ministry of Science and Higher Education (DS 6.42/2019).
References
Supplementary Material
Please find the following supplemental material available below.
For Open Access articles published under a Creative Commons License, all supplemental material carries the same license as the article it is associated with.
For non-Open Access articles published, all supplemental material carries a non-exclusive license, and permission requests for re-use of supplemental material or any part of supplemental material shall be sent directly to the copyright owner as specified in the copyright notice associated with the article.