
Abstract
One major goal of biobanks is to provide the best possible biospecimen quality for research use. This can be achieved, notably in accredited structures, by using standardized procedures for collection, processing, and storage of biosamples and associated data. Since tissue samples of a clinical biobank are commonly collected at surgical theaters in satellite locations or hospitals in remote areas, adequate temporary storage of the biosample is mandatory to maintain optimal sample quality. In cases where immediate snap freezing of the collected material is possible, interim storage of the samples in portable dewars filled with liquid nitrogen (LN2) is a widely used method. Therefore, the ideal dewar size and maximum storage time need to be considered to maintain an optimal biospecimen quality. In addition, the nature of the cryotube material is an important aspect for keeping the biosample safe while storing it in LN2. The objective of this study was to test different dewar vessels with respect to LN2 volume and consumption and to analyze the impact of LN2 contact on cryotube material through scanning electron microscopy.
Introduction
Biospecimens of patient tissue for clinical biobanks are an important prerequisite for current and future research projects, especially for translational research in the field of precision medicine. A large number of biospecimens originate from routinely obtained material during diagnostic or therapeutic procedures. Therefore, the importance of biobanks as storage locations for these samples has increased considerably during the last few years, although the establishment and operation of a biobank requires a large investment of resources, such as personnel and health care workers, storage facilities, and appropriate infrastructure. 1 To ensure the availability of appropriate specimens for various research purposes, fresh frozen tissue specimens are collected in clinical biobanks in addition to formalin-fixed paraffin-embedded specimens.
The collection of biospecimens is usually performed according to standard operating procedures (SOPs) to avoid interindividual, intraindividual, preanalytical, and analytical influences, which must be taken into account because of their relevant impact on sample quality and their consequences to the outcome and reproducibility of research experiments. 2 Regarding preanalytical variabilities, maintaining high biosample quality can be achieved by using the Sample PREanalytical Code (SPREC), which documents relevant parameters with potential influence on the biological quality of a tissue specimen.3,4 As one essential point to maintain high sample quality, the SPREC code includes the appropriate storage of the samples after surgery and before formalin fixation or its final storage in a freezer. In the era of genome, transcriptome, metabolome, and proteome analysis, and with regard to future research projects, freezing is considered the method of choice for a high number of analytical methods.3,5
Freezing tissue samples at the earliest possible time after surgical resection and storage of the samples in the vapor phase of liquid nitrogen (LN2)—even for very long periods—is currently considered the best approach, as it ensures the stability of proteins, DNA, and also highly sensitive structures such as small functional molecules and RNA.6–8
Clinical tissue biobanks are often connected to local pathology departments at or near the clinic. Therefore, biospecimens are typically transported from the surgical theater to the pathology department through internal transportation systems of the clinic or through external courier services, in cases where the samples are not collected at the main hospital but at external hospitals or satellite centers.9,10 This complicates standardization of the time point for snap freezing and maintenance of the best sample quality. As generally accepted, tissue evaluation by an expert pathologist is the best choice to store tissue samples with correct size and presenting best the patient's diagnosis. However, specific research projects might require the need of direct snap freezing due to the hypothesis that will be studied. Several studies have demonstrated that the time point of freezing and ischemia time affect metabolites, especially mRNA and miRNA.6,11,12
In such cases, a SOP should ensure correct sample handling by the surgical staff. Some biobanks bypass the problem of being a satellite location by placing a LN2 dewar at the nearest possible location to the operating theater. Samples that are not used for diagnostic routines can be frozen immediately after surgical excision. Depending on the available infrastructure, interim storage of frozen samples in the dewar can take place over a longer period of time. Thus, an adequate dewar size must be chosen according to the duration of interim storage.
Another important aspect is the quality of the materials and utensils used for biobanking procedures, especially the cryotubes in which the samples are stored in aliquots. The quality of the cryotube material may have relevant implications for biospecimen quality, since the material properties of the tubes can be a potential source of errors. In this context, leaching from plastics has been found to contaminate the sample inside of the tube, resulting in false data.13,14 In addition, LN2 can enter the cryotubes when they are stored in the liquid phase. This can cause further problems if the cryotubes break when removed from the dewar due to pressure differences in the tube. 15 Furthermore, Fountain et al. and Tedder et al. discussed cross-contamination that might occur when storing samples in the liquid phase of nitrogen, leading to many pitfalls when using the samples for molecular biological analyses.16,17
All these facts point out that the reproducibility of research experiments with stored tissue samples can be dependent on sample quality and preanalytical procedures, which include cryotube quality and LN2 volume in dewars used for interim storage. The Central Biobank Regensburg (ZBR), Germany, aims to optimize its infrastructure and all workflows dealing with banking of tissue biospecimens to reach the best possible sample quality. Therefore, we tested the adequate nitrogen dewar size for interim storage of samples in LN2 as a function of time. In addition, we analyzed the surface properties of cryotubes after snap freezing by use of scanning electron microscopy (SEM). The outcome of this study might help to give further evidence for improved sample management with respect to biospecimen quality.
Materials and Methods
Dewar flasks and cryotubes
In the present study, we used dewar flasks from KGW-ISOTHERM (KGW-Isotherm, Karlsruher Glastechnisches Werk–Schieder GmbH, Karlsruhe, Germany) to analyze their use as interim storage for biospecimens. For this purpose, we measured the consumption of LN2 over time with simulation of sample addition. The following dewar flasks were used in the present study: GSS 2000 - stainless steel dewar, max. volume: 2 L, inner Ø: 10.0 cm, inner height: 28.5 cm; DSS 1000 W - stainless steel dewar, max. volume: 1 L, inner Ø: 10.0 cm, inner height 15.6 cm; B28 - borosilicatglass dewar covered with metal, max. volume 3 L, inner Ø: 13.8 cm, inner height: 23.0 cm; B26 - borosilicatglass dewar covered with metal, max. volume 1 L, inner Ø: 10.0 cm, inner height: 15.0 cm (Fig. 1).

Dewar flasks used in the present study, from left to right: GSS 2000 - stainless steel dewar, volume 2 L; DSS 1000 W - stainless steel dewar, volume 1 L; B28 - borosilicatglass dewar covered with metal, volume 3 L; B26 - borosilicatglass dewar covert with metal, volume 1 L.
Measurement of LN2 level
To measure the LN2 level in different dewar flasks, we conducted two different experimental designs (summarized in Fig. 2).

Experimental design 1 and 2 of the studies without (1) and with (2) simulation of sample storage in the dewar flasks: For experimental design 1, LN2 level was measured inside the dewar every hour for a total of 12 hours (time points t1–t12). For experimental design 2, LN2 level was measured at t1, afterward two cryotubes were added into the LN2, the procedure was repeated until t5 ( = 10 cryotubes in total). Then LN2 level was measured further until t12. LN2, liquid nitrogen.
For experimental design 1, a cm scale was printed on a transparent film and fixed inside each dewar, starting directly at the top edge of the dewar and extending to the bottom. Each dewar flask was filled with LN2 up to ∼1 cm beneath the top edge of the dewar and closed with a lid after a short reaction time to let the dewar cool completely. A further period of at least 30 minutes for temperature adaption was held. After 30 minutes, the experiment started with time point t0. At this time, room temperature was noted (Celsius, C) and the height of the filling level inside each dewar was measured using the cm scale. Afterward, this was repeated every hour for a complete time period of 12 hours (time points: 1, 2, 3, until 12 hours). Experimental design 1 was conducted three times (N = 3) and a mean value was calculated for each time point (t1–t12).
In the experimental design 2, we mimicked cryotube storage inside the dewar. Experimental design 2 was prepared equal to experimental design 1. In addition, the storage of sample-containing cryotubes was simulated. Therefore, we used the FluidX 1.8 mL External Thread 2D-Coded Tubes (#65-7501; Brooks Life Sciences, Manchester, United Kingdom), which are used as cryotubes in the ZBR. At time point 1 (t1 = 1 hour after starting the experiment) the LN2 level was measured. Then, two cryotubes were added to the liquid. The procedure was repeated again at time points 2, 3, 4, and 5, and each time, two cryotubes were added after measurement of the filling level (t2, t3, t4, t5; in total 10 cryotubes; empty tubes were used). Afterward, the LN2 level was measured further without addition of cryotubes at time points t6 up to t12. Experimental design 2 was conducted three times (N = 3) and a mean value was calculated for each time point (t1–t12).
The experimental designs 1 and 2 are summarized in Figure 2.
SEM analysis of cryotube surface
In a further experimental design, SEM analyses were conducted to observe material quality of the FluidX cryotubes, that is, whether it was affected during short-term or long-term storage in LN2. Experimental design 3 is demonstrated in Figure 3. Dewars were prepared as described before. After 30 minutes temperature adaptation, two cryotubes were added into the LN2. After 5 hours, two more cryotubes were added into the LN2. After 15 minutes, all cryotubes were retrieved from the dewar and stored at room temperature (RT) for further analysis. Experimental design 3 was repeated three times in total (N = 3). Afterward, cryotubes were analyzed using SEM. Cryotubes from another supplier (#126263-2DG; Greiner Bio-One, Frickenhausen, Germany) and FluidX tubes were used without storage in LN2 to exemplify the general surface appearance of cryotubes. The SEM analysis was performed in cooperation with the Department of Conservative Dentistry and Periodontology, University Hospital Regensburg, which has great expertise in SEM-based material testing.
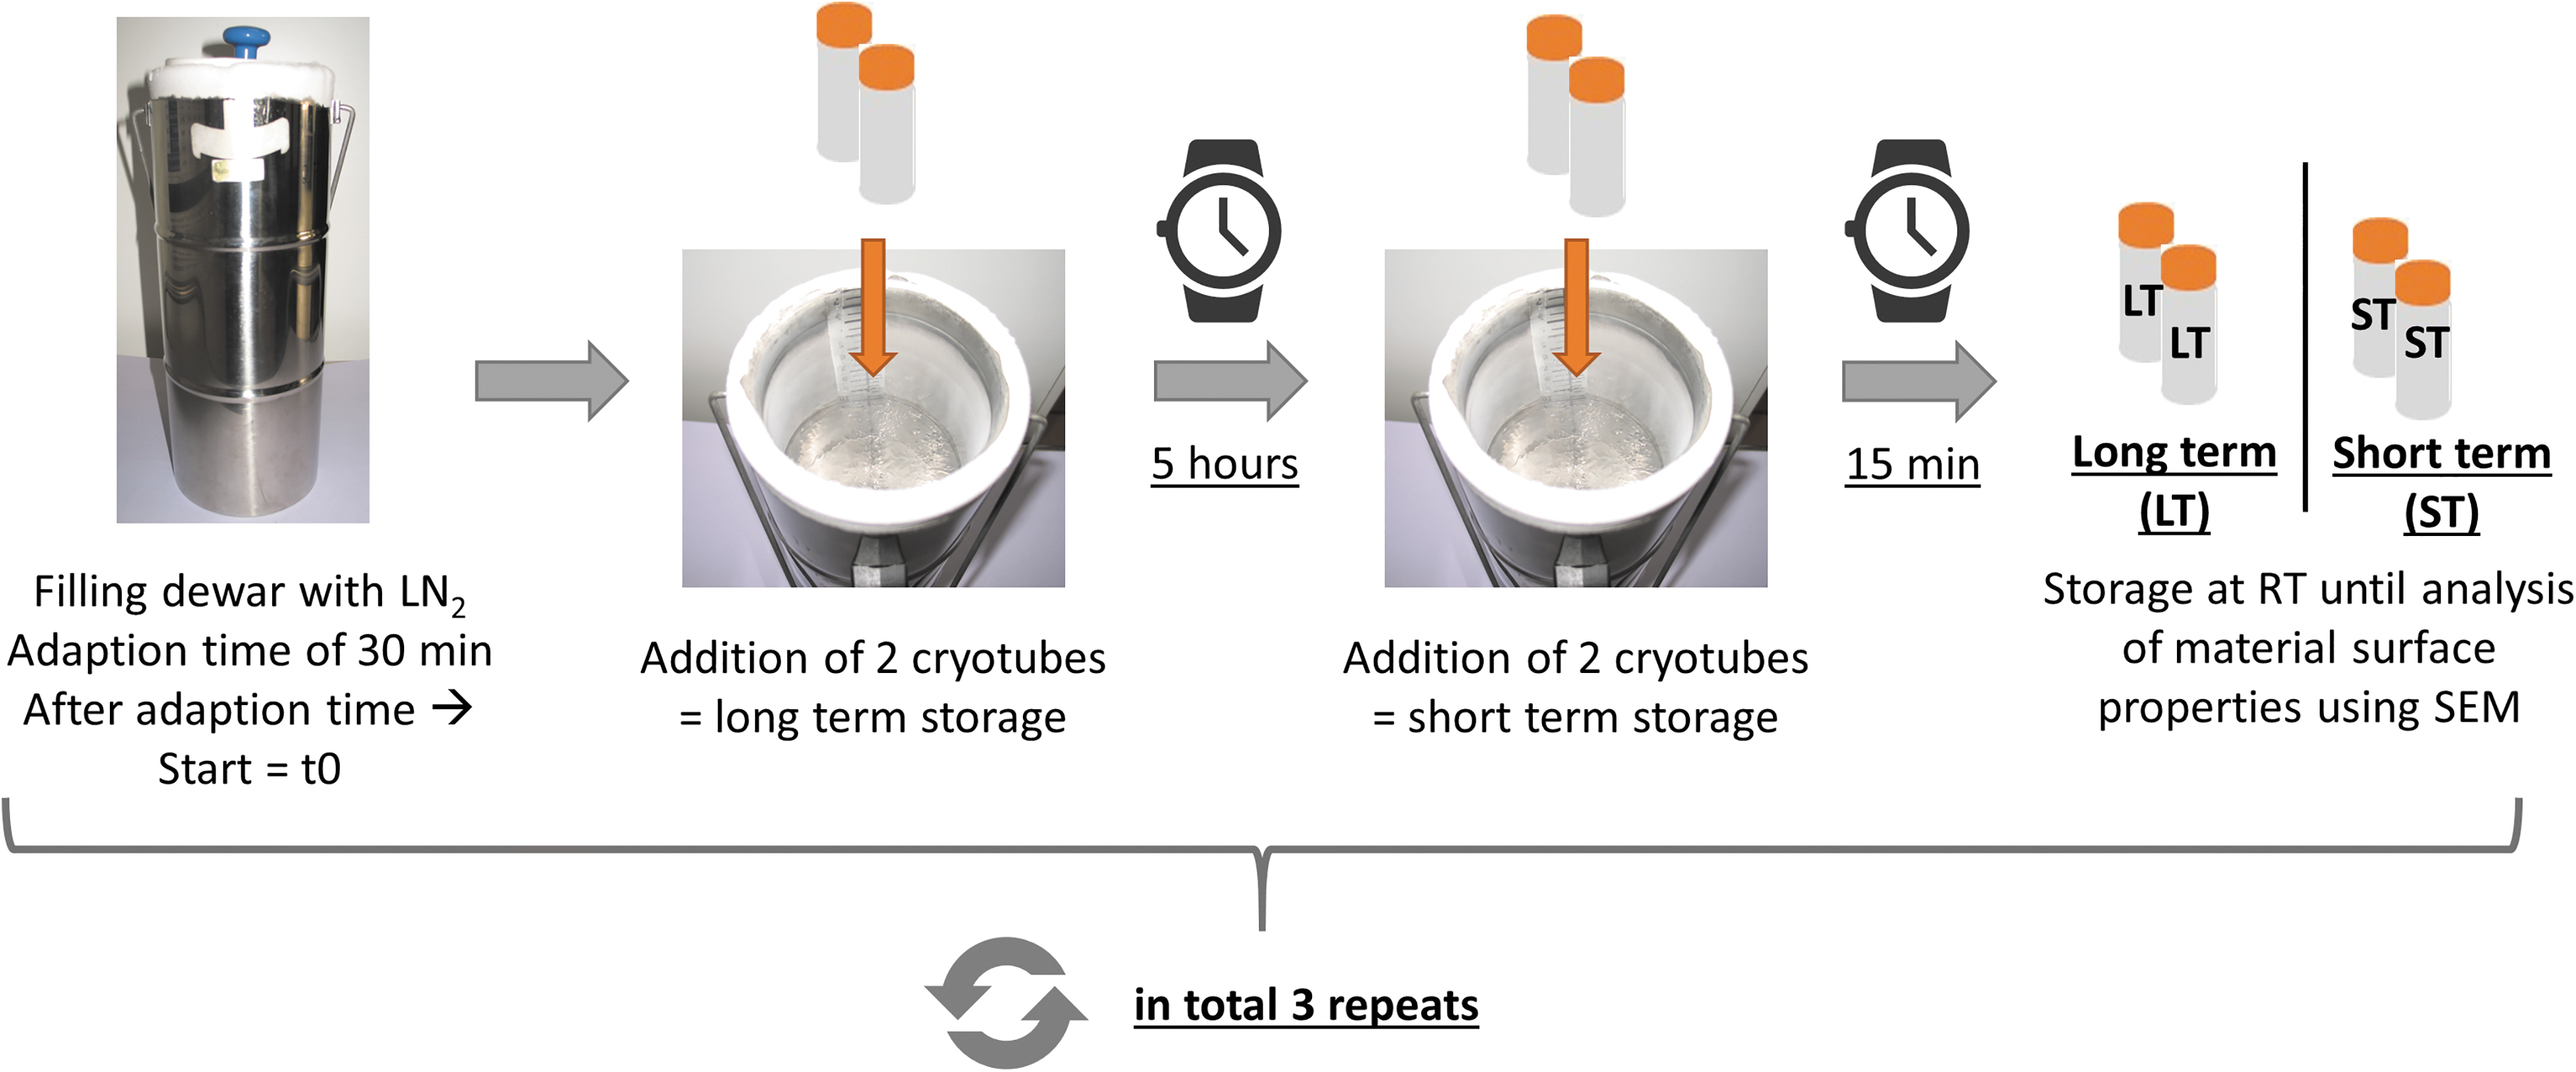
Experimental design 3 to analyze material surface properties of cryotubes after LN2 storage: After adaption time of LN2 in the dewar, two cryotubes were added into the LN2 for material test after long-term storage. After 5 hours, another two cryotubes were added for the material test after short-term storage. After 15 minutes, all cryotubes were removed from LN2 and stored at RT until SEM analysis.
For this purpose, the FEI Quanta 400 F SEM (Thermo Fisher Scientific, FEI Deutschland GmbH, Frankfurt a. Main, Germany) was used. Cryotubes were mounted on a 31 mm specimen holder, coated with platinum for 30 sec at a working distance (WD) of 50 mm and at a current of 30 mA. Images of the cryotube surface were generated with a voltage of 4 kV at a WD of 10 mm and 1.5 Torr at 100, 800, 2400, 5000, 10,000, 20,000, and 40,000-fold magnification using high and low N2 gas vacuum. The surface of the cryotube material was inspected for fissures, inclusions, and distortions.
Data analysis
The analysis of the LN2 filling level % (cm) and nitrogen usage (mL) were calculated in Microsoft Excel 2019. GraphPad prism 9 (GraphPad Software, San Diego, CA) was used for statistical analysis (t-test; simple linear regression; ANOVA) and graph design. p-Values ≤0.05 were regarded as significant.
Results
All measurements were conducted at RT (18°C–20°C). We measured the filling levels in the dewar vessels with a cm scale beginning at the starting time point t0 for up to 12 hours. In the B28 borosilicatglass dewar (3 L volume) the filling level decreased 8.5 ± 0.25 cm within 12 hours, resulting in a mean decline of 0.69 ± 0.02 cm per hour. The 1-L borosilicatglass dewar B26 lost a total of 8.75 ± 0.25 cm on the scale regarding the LN2 level, resulting in a decline of 0.73 ± 0.02 cm per hour. In the stainless steel dewar GSS 2000 (2 L volume), we measured a total decrease of 12.4 ± 0.14 cm on the scale and calculated a mean decline of 1.03 ± 0.01 per hour, which is significantly higher compared with the B28 (p < 0.0001) and the B26 (p = 0.0001) dewar. In the stainless steel dewar DSS 1000 W, the filling level of LN2 declined 11.6 ± 0.14 cm within 12 hours and we calculated a significantly higher loss of 0.97 ± 0.01 cm per hour compared with the B28 (p = 0.0002) and B26 (p = 0.0003) dewars.
With respect to the different diameters of the dewar vessels, we calculated the values as a percentage of total filling level. Graphically, the LN2 filling level showed a linear decrease for all dewar vessels (Fig. 4A, LN2 level at t0 = 100%). Due to the low height and the small diameter of the 1-L vessels, the percentage of filling level was significantly lower after 12 hours in the B26 dewar (p = 0.0467 vs. B28 dewar) and in the GSS 1000 W dewar (p = 0.0002 vs. B28 dewar; p = 0.0019 vs. GSS 2000 dewar).

Filling level of LN2 inside the different dewar flasks B28, B26, GSS 2000, and DSS 1000 W, measured every hour for a period of 12 hours in total:
Similar results were obtained when adding cryotubes over a time period of 5 hours (two cryotubes/h) to mimic the usage of the dewar for biosample collection at satellite centers. The LN2 filling level declined 7.9 ± 0.1 cm in the B28 borosilicatglass dewar and we calculated a mean decline of 0.71 ± 0.06 cm per hour. We measured a decrease of 8.75 ± 0.66 cm of LN2 level on the scale for the B26 borosilicatglass dewar and a mean decline of 0.77 ± 0.025 cm per hour when adding the cryotubes. The decline of LN2 filling level (cm) was significantly higher in the stainless steel dewar compared with borosilicatglass dewar. In the stainless steel dewar GSS 2000 addition of cryotubes resulted in a total LN2 decline of 12.41 ± 1.02 cm and a mean decrease of 1.1 ± 0.03 cm per hour on the scale (p = 0.0031 vs. B28 dewar; p = 0.0001 vs. B26 dewar). Likewise, the filling level decreased 11.42 ± 0.58 cm in the DSS 1000 W dewar after addition of cryotubes with a mean decline of 1.01 ± 0.03 cm per hour (p = 0.0036 vs. B28 dewar; p = 0.0094 vs. B26 dewar).
Graphs displayed a linear decrease (Fig. 4B). Similar to the first experimental setup, the 1-L vessel B26 lost more than 50% of total LN2 filling level (p = 0.0353 vs. B28 dewar) and GSS 1000 W lost 100% of LN2 over a time period of 12 hours (p = 0.0001 vs. B28 dewar; p = 0.0022 vs. GSS 2000 dewar) (Fig. 4B). The longest possible duration for interim storage of cryotubes with sufficient LN2 level in the dewar was measured in the B28 borosilicatglass dewar. The vials could be stored over a time period of 12 hours when adding two cryotubes after 1, 2, 3, 4, and 5 hours into the B28 borosilicatglass dewar, respectively.
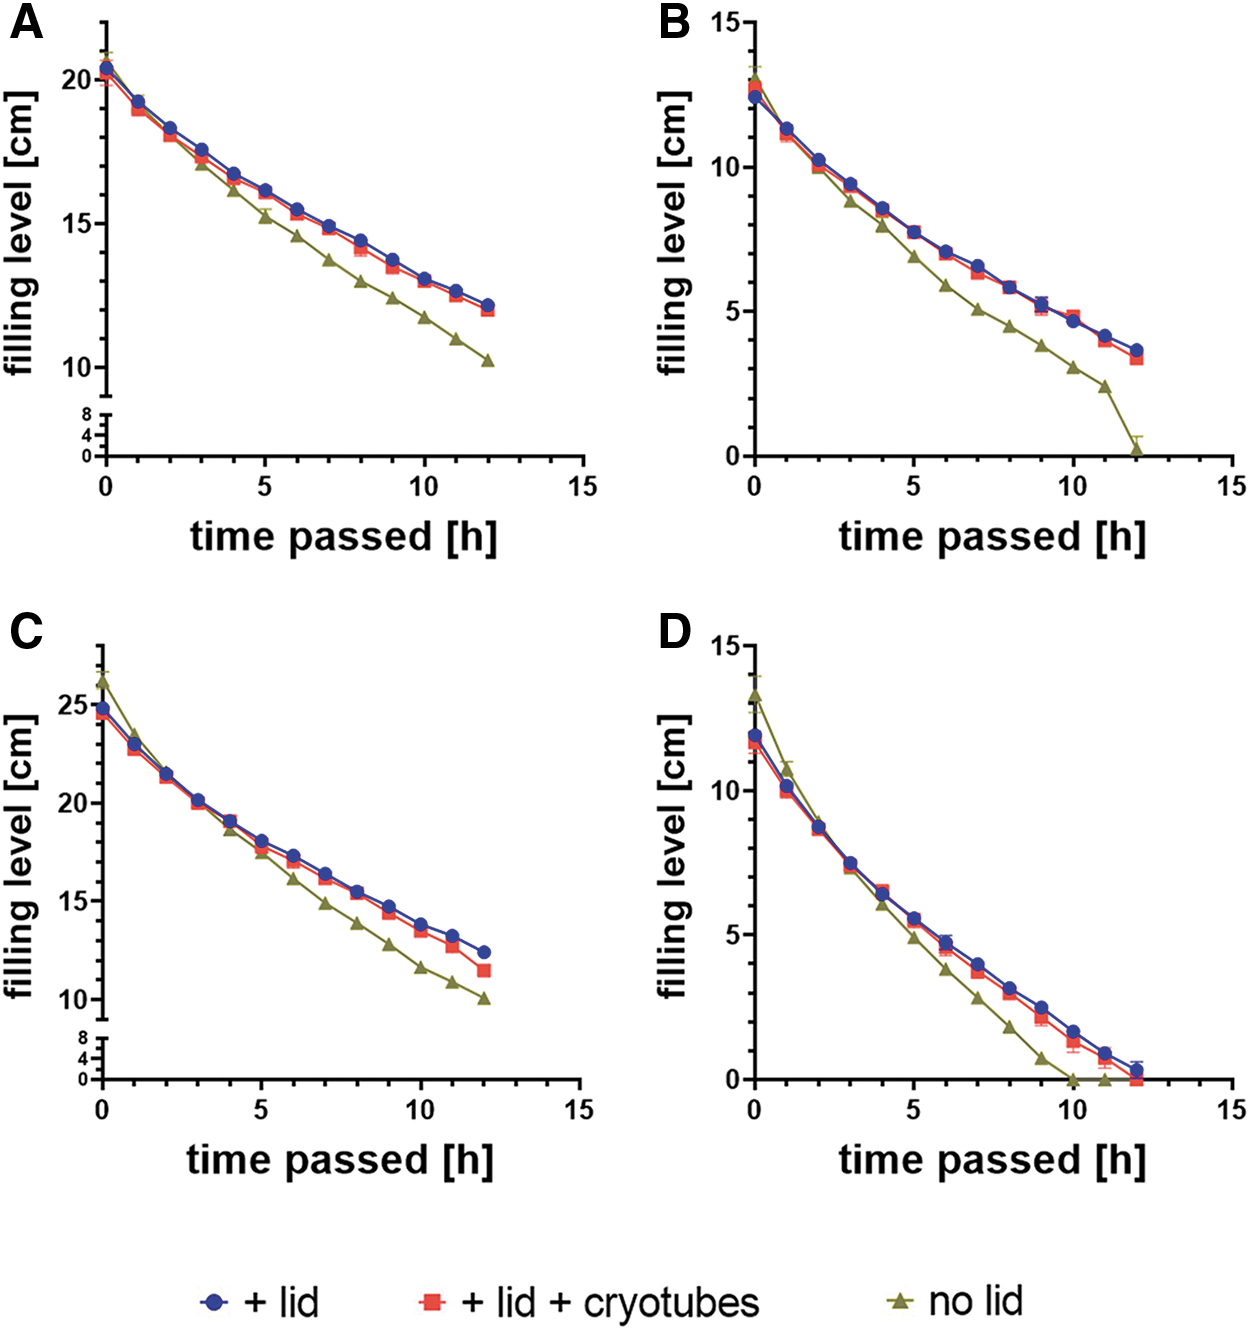
The graphical comparison of LN2 evaporation in the different dewar vessels with and without addition of cryotubes demonstrates that the addition of cryotubes did not change overall LN2 evaporation significantly in the B28, GSS 2000, DSS 1000 W, or B26 dewar vessels (Fig. 5A–D, red and blue lines). However, a higher number of cryotubes would not be thoroughly covered with LN2 after 5 hours of interim storage when using the B26 and DSS 1000 W dewar, as the filling level will be about 7.75 ± 0.0 cm in the B26 dewar (Fig. 5B) and 5.5 ± 0.25 cm in the GSS 1000 W dewar (Fig. 5D). Furthermore, LN2 evaporation did not change significantly in the open borosilicatglass dewar vessels B26 and B28 and the stainless steel dewar vessels GSS 2000 and DSS 1000 W (Fig. 5A–D, gold line).
Filling level of LN2 inside the different dewar flasks B28
SEM analysis was first used to study the material surface of cryotubes without storage in LN2. The material surface of the FluidX tubes (#65-7501; Brooks Life Sciences) was compared with material surface of cryotubes from Greiner Bio-One (#126263-2DG). We found an inhomogeneous appearance of the material with irregularities and inclusions ( = particles) on the surface of both cryotubes (Fig. 6, left images, particles are highlighted by an orange line). Using higher magnification (Fig. 6, middle and right images) deep grooves or notch-like structures became visible at the edges of the particles that look like thin cracks around the inclusions (Fig. 6, red arrows). Both cryotubes show similar surface characteristics with a slightly more inhomogeneous look on the surface of Greiner Bio-One tubes (Fig. 6, middle and right, lower images, red arrows).

SEM analysis of material surface of 2D-coded FluidX cryotubes from Brooks and comparable cryotubes from Greiner Bio-One without storage in LN2. Images were taken at low vacuum with different tubes. Magnifications from left to right: 5000 × , 10,000 × , 20,000 × . Red arrows point to crack-like lines. Total N = 3.
The FluidX cryotubes were further stored in LN2 for 15 minutes or 5 hours 15 minutes to analyze the cryotube material surface after interim storage in LN2. Storage of the tubes in LN2 increased the intensity of the groove- and notch-like structures at the edges of the particles. Dark groove-like lines were present in SEM images taken at low vacuum around many particles on the surface of cryotubes stored for 15 minutes in LN2 (Fig. 7A, middle images). These lines were even more prominent and intense, thereby resembling thin cracks, after 5 hours 15 minutes storage in LN2 (Fig. 7A, right images; see Supplementary Fig. S1 for more images). In addition, we observed an increase in the appearance of groove-like lines around particles on the surface of cryotubes stored for 15 minutes (Fig. 7B, middle images) and 5 hours 15 minutes (Fig. 7B, right images) in LN2 during SEM analysis when using high vacuum.
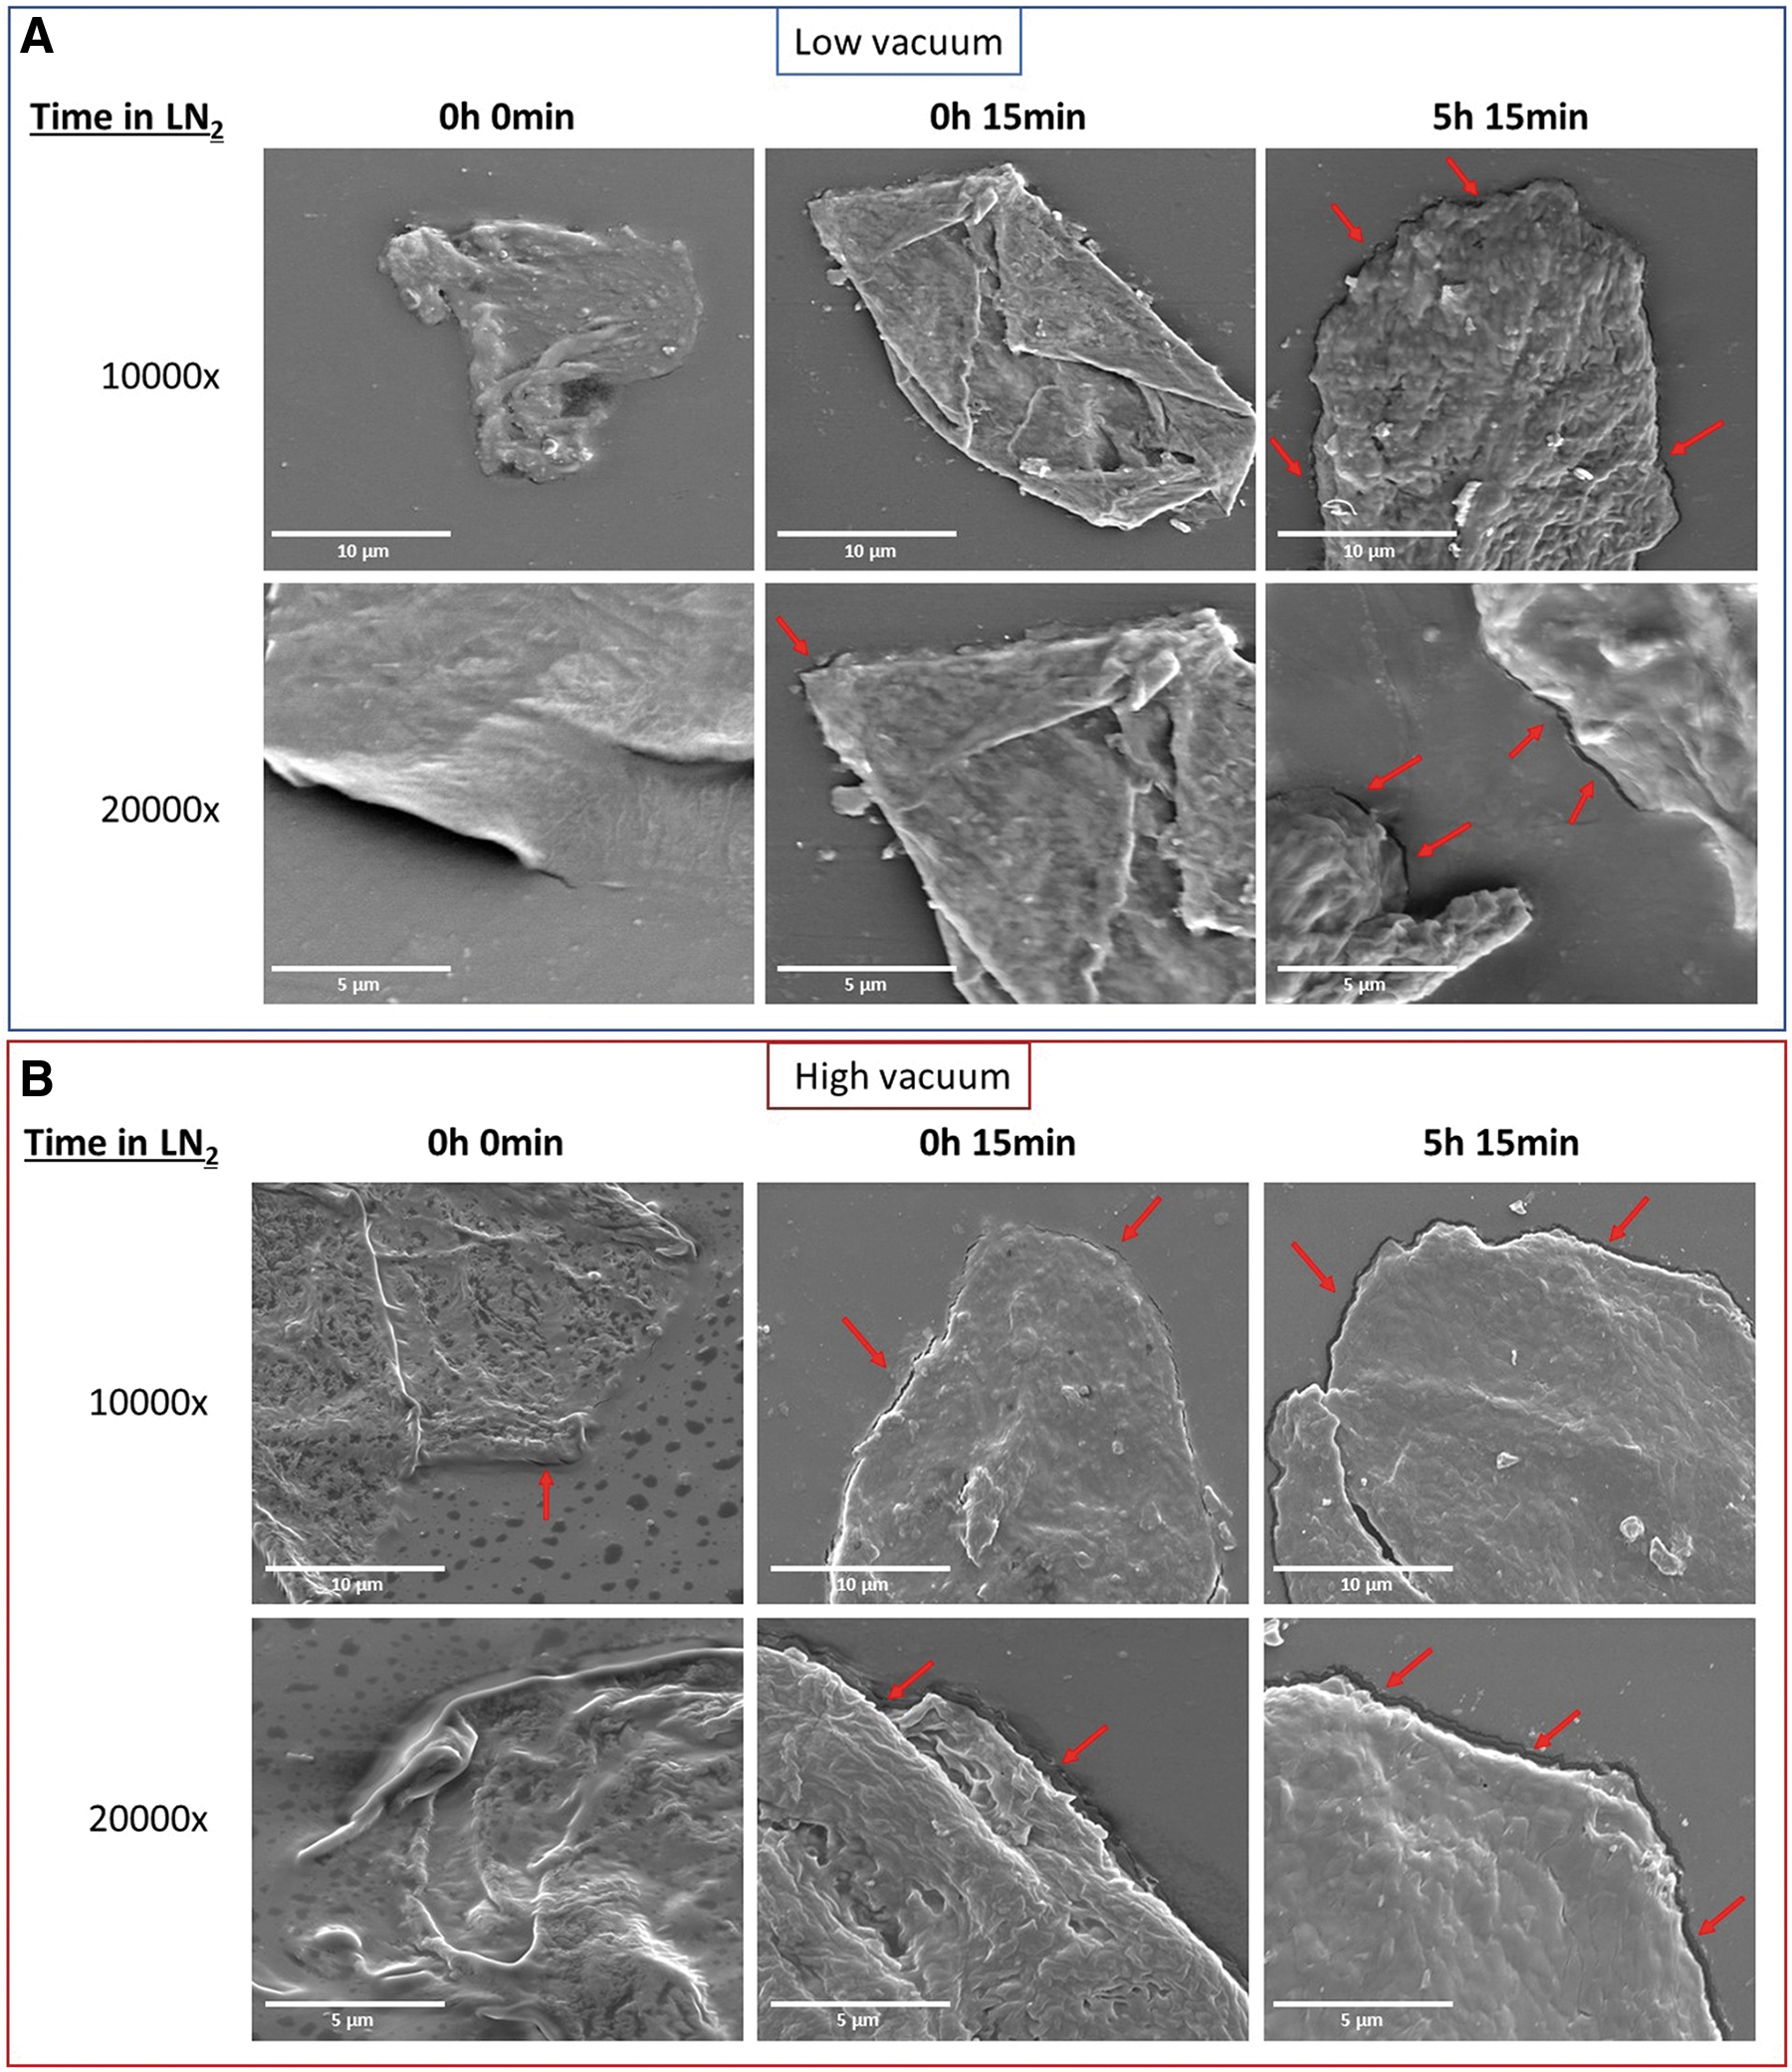
SEM analysis of cryotube material surface of FluidX cryotubes after storage in LN2 for 0 hour 0 minute, 0 hour 15 minutes, or 5 hours 15 minutes. Images were taken at low
High vacuum seems to affect the tube surface with respect to the inclusions on the surface likewise to prolonged LN2 storage. Nevertheless, no deep cracks within the tube body could be recognized after high vacuum or prolonged LN2 storage. Further studies should clarify whether these changes could probably affect the stability or tightness of the tube.
Discussion
The present report compares for the first time the possible storage duration of cryotubes in different dewar vessels for an optimal preservation of sample quality during interim storage at for example, satellite surgical theaters. The general consumption rate of a nitrogen dewar is measured without addition of cryotubes. When planning interim storage of cryotubes in a portable nitrogen dewar at satellite locations, surgical staff and biobank staff need to know whether the consumption rate is changed by adding cryotubes into the dewar and whether the duration of how long the samples can safely be stored in the portable dewar will be affected. These changes might be due to bringing cryotubes at RT into the LN2 inside the dewar and due to opening and closing the dewar while adding samples. Therefore, the present study tested LN2 consumption during a biobanking operation, where dewars are opened and closed several times to freeze biosamples in cryotubes.
Our measurements revealed that the filling level in the closed stainless steel dewar GSS 2000 and DSS 1000 W decreased faster compared with the blue-coated B28 and B26 dewars, made of borosilicatglass covered with metal. Comparing the two 1-L vessels, LN2 evaporation was less in the dewar vessel made of borosilicatglass covered with metal (B26) compared with the stainless steel dewar (DSS 1000 W). This is in line with technical data given by the producer, specifying an evaporation rate of 1.2 L/day for the 1-L borosilicatglass dewar B26 compared with 1.6 L/day for the 1-L stainless steel dewar DSS 1000 W (www.kgw-isotherm.de; constituted on 2021/11/25). Comparing the 2-L and the 3-L vessels, the faster decrease of LN2 filling level in the 2-L stainless steel dewar might partly be due to a smaller diameter (Ø GSS 2000: 10 cm; B28: 16 cm), as the technical data indicate a lower evaporation rate of 1.1 L/day for the 2-L stainless steel dewar (GSS 2000), whereas evaporation rate of the 3-L borosilicatglass dewar (B28) is given as 1.6 L/day (www.kgw-isotherm.de; constituted on 2021/11/25).
In general, the usage of a dewar vessel with 2 L or 3 L volume was sufficient for the storage of 10 cryotubes over a time period of 12 hours in this study. Due to the higher filling level after 12 hours and the larger diameter, giving a better possibility for storage of more than 10 cryotubes, the 3-L borosilicatglass dewar covered with metal can sufficiently freeze and store biosamples in cryotubes that will be collected in operating theaters at satellite centers and delivered to a biobank within a few hours. However, prior tests are recommended for the storage of a higher number of cryotubes as this study used only 10 tubes, which were added over a time period of 5 hours.
Planning the expected sample size for interim storage is important so that optimal preanalytical conditions will be maintained to make results comparable and to avoid uncontrollable variables, whether liquid or tissue. 3 The material properties that might become of interest for later research questions need to be preserved in a proper way during all biospecimen-related procedures. Fast initial freezing and the storage at low temperature are common and reliable methods to inhibit quality loss of the biosamples with respect to important biomarkers and molecular properties important for diagnostic routine and clinical research. 18
The use of a dewar for interim storage is useful, if biosamples are collected from operating theaters at different sites of a clinic or even from different clinics. For optimal freezing and storage conditions, appropriate dewar size and the quality of cryotubes are important aspects with respect to maintenance of biosample properties. Some degradative molecules can still be active at low temperatures near −53°C, or even at −70°C. 18 Therefore, continuous cooling of the samples at temperatures below the threshold for protein activity without temperature fluctuations seems to be important for long-term storage, as it avoids possible degradation of the biospecimen. 18 This is confirmed by a study of Spruessel et al., demonstrating the fast changes in gene expression pattern and protein profile for a variety of genes and proteins already within 30 minutes after surgical tissue resection. 7 Likewise, two other studies demonstrated an effect of prolonged time to snap freezing after surgical excision of the tissue on several metabolites, especially mRNA.6,12
Furthermore, Borgan et al. demonstrated an impact of ischemia time on mRNA and miRNA expression in tissue samples. 11 Immediate freezing seems to be necessary for some specific studies. Therefore, adequate Dewar choice and interim storage of biospecimens in LN2 can prevent suboptimal biospecimen preservation. For this purpose, sufficient LN2 throughout the storage time is necessary, as personnel in surgical theaters might not be able to continuously check the filling level of the dewar. Alarm systems can help by reporting low LN2 levels, however, personnel in surgical theaters usually do not have the time, and fast or direct access to LN2 for replenishment of the dewar. Therefore, this study compared different LN2 dewar vessels used for interim storage of biospecimens with respect to the longest possible storage time. The dewar vessels used differed in size (1 L, 2 L, and 3 L) and material properties (stainless steel vs. borosilicatglass covered with metal).
According to our data, the B28 borosilicatglass dewar covered with metal can store and cool cryotubes sufficiently for the collection in operating theaters at satellite hospitals for at least 12 hours, which allows appropriate storage for a working day in a surgical theater. This ensures that by use of such a dewar, the interim storage should just transmit one time per day. Nevertheless, tissue preparation by an expert pathologist should always be the first choice to avoid variations in the frozen and stored samples due to differences in macroscopic tissue characteristics (size, tissue properties, etc.) and differences in handling by the surgical staff. In addition, special attention should be given to the use of SOPs, to enable correct and comparable workflows, which has been demonstrated as an important aspect for multicenter fresh frozen tissue collection. 19
Another important aspect regarding cryopreservation of biosamples is the choice of the appropriate storage tube or cryotube. For fluid biospecimens, some studies have described that the material of blood collection or sample storage tubes seems to affect samples, resulting in chemical noise in the mass spectra.20,21 Mei et al. demonstrated mass signals caused by exogenous components from sample containers. 20 In a study by Yin et al., blood samples in lithium heparinate and serum blood collection tubes were handled at room temperature and kept in ice water for 25 minutes until sample pretreatment for chromatographic analysis. After chromatographic analysis, Yin et al. reported noise signals, identified as polyethylene glycol with a typical ion cluster and suggested the beads inside the collection tubes might possibly be the reason. 21 The importance of other relevant criteria for cryotube selection was also mentioned by Petersmann et al., who reported a list of criteria used in the German National Cohort (GNC). 22
The list contained the price as well as criteria about short deliverability (delivery in less than 1 week or month) and tube quality (tightness and stability during long-term storage at −195°C). The GNC decided to use cryotubes from Brooks, called FluidX, and concluded that the biobanking community needs to be aware of changing material and production techniques and that studies are needed to learn more about cryotubes.
Therefore, when using the snap-freezing method during a sample collection procedure, it is necessary to consider the appropriate storage tube. The tube material should not affect the stored material, it needs to be stable and tight when stored in LN2, and needs to withstand an extremely fast cooling rate from RT to −196°C. The ZBR is using cryotubes of the same company/origin as the GNC. To find out more about the tube quality, we analyzed the material surface properties of cryotubes using SEM. We found inclusion particles on the surface of the material that were visible throughout the surface of the cryotubes. Furthermore, snap freezing and storage in LN2 seemed to affect the material around the inclusion particles. We found dark lines around inclusion particles on the surface of unused cryotubes, but these dark lines deepened and resembled small groove-like structures or even looked like cracks at the edges of inclusion particles after storing the tubes for 15 minutes in LN2 and even more after a storage time of 5 hours. It seems that these crack-like lines became more pronounced with increasing storage time in LN2.
Additionally, high vacuum seemed to affect the tube surface likewise to prolonged LN2 storage, as we found more groove- or crack-like lines around inclusion particles when using high instead of low vacuum during SEM analysis. As a proof of concept, unused tubes from Greiner Bio-One were compared with the unused FluidX tubes (no storage in LN2) to have a first impression, if such inclusion particles are characteristic for FluidX cryotubes or if these inclusions are an overall material property of such tubes. Similar surface properties were visible in cryotubes from Greiner Bio-One, pointing to an overall material property of such tubes. Our results do not indicate material weakness or leakage. However, further studies are needed to clarify the impact of these material changes on tube stability or tightness and additionally the possible impact of tube material on the stored biospecimen.
Conclusion
The best choice according to our results is the B28 borosilicatglass dewar covered with metal. This dewar is best suitable for the longest possible interim storage of biosamples and best suitable for a higher cryotube number. All other dewars analyzed in this study can be used for interim storage but with limitations. The GSS 2000 stainless steel dewar could also be used over a time period of 12 hours, however, compared with the B28 dewar, the number of cryotubes for interim storage is more limited due to its small diameter. Both 1-L dewars will sufficiently cover up to 10 cryotubes with LN2 for up to 5 hours.
This study emphasizes that choice of the dewar vessel and cryotube for LN2-based interim storage of biospecimen is a crucial aspect to consider to preserve in an optimal way the quality of tissue biospecimen for research purpose. It thereby contributes additionally to quality management within a biobank. As the pilot study was set up as a proof of concept to generally test for changes caused by LN2 to the cryotubes, follow-up studies will focus on a possible impact of LN2 storage directly on tissue and liquid biosamples. In addition, we assume that even differences in technical and material aspects during biobanking procedures might account for some effects on biosample quality. Therefore, more studies about technical and material equipment might improve standardization and comparability of different biobank procedures.
Footnotes
Authors' Contributions
T.N. and C.B. contributed to the conception and design of the study. M.B., M.F., and Ma.B. conducted the experiments and analyzed the data regarding nitrogen filling level in the dewar. M.B., H.S., and G.F. conducted the SEM analysis. T.N., M.B., and C.B. drafted the article. A.M. and P.H. critically revised the article. All authors read and approved the submitted article.
Author Disclosure Statement
The authors have nothing to disclose.
Funding Information
No funding was received for this article.
References
Supplementary Material
Please find the following supplemental material available below.
For Open Access articles published under a Creative Commons License, all supplemental material carries the same license as the article it is associated with.
For non-Open Access articles published, all supplemental material carries a non-exclusive license, and permission requests for re-use of supplemental material or any part of supplemental material shall be sent directly to the copyright owner as specified in the copyright notice associated with the article.