
Abstract
Although molecular profiling of DNA isolated from formalin-fixed, paraffin-embedded (FFPE) tumor specimens has become more common in recent years, it remains unclear how discrete FFPE processing variables may affect detection of copy number variation (CNV). To better understand such effects, array comparative genomic hybridization (aCGH) profiles of FFPE renal cell carcinoma specimens that experienced different delays to fixation (DTFs; 1, 2, 3, and 12 hours) and times in fixative (TIFs; 6, 12, 23, and 72 hours) were compared to snap-frozen tumor and blood specimens from the same patients. A greater number of regions containing CNVs relative to commercial reference DNA were detected in DNA from FFPE tumor specimens than snap-frozen tumor specimens even though they originated from the same tumor blocks. Extended DTF and TIF affected the number of DNA segments with a copy number status that differed between FFPE and frozen tumor specimens; a DTF ≥3 hours led to more segments, while a TIF of 72 hours led to fewer segments. Importantly, effects were not random as a higher guanine-cytosine (GC) content and/or a higher percentage of repeats were observed among stable regions. While limiting aCGH analysis to FFPE specimens with a DTF <3 hours and a TIF <72 hours may circumvent some effects, results from FFPE specimens should be validated against fresh or frozen specimens whenever possible.
Background
An identifying feature of cancer is the amplification or deletion of subchromosomal areas. These copy number variants confer a growth advantage to cancer cells and are associated with cancer stage, 1 prognostic score, 1 reoccurrence risk,2,3 and survival1,3–6 and are potential targets of cancer treatment.5,7 Array comparative genomic hybridization (aCGH), a microarray-based assay that detects genomic alterations relative to control material, is often used to detect cancer-relevant copy number variations (CNVs), to classify the genomic alterations(s) identified, and to explore their prognostic significance in formalin-fixed, paraffin-embedded (FFPE) tumor specimens.7–10
FFPE tumor biorepositories, which often contain clinically annotated rare tumors and/or chronological arcs of sampling during disease progression or treatment, offer a unique opportunity; aCGH analysis of these archives could elucidate the roles of individual CNVs in cancer progression, and identify potential avenues for targeted therapy as well as potential markers of treatment response. However, evaluating genetic alterations in FFPE tumor specimens is complicated by the adverse effects of FFPE processing on DNA quality and quantity, 11 structure,12,13 fragmentation, 14 and nucleic acid-protein crosslink formation.15,16
The magnitude of FFPE-mediated effects on DNA endpoints is not ubiquitous, but governed by the gene and region targeted 17 and the sensitivity of the analytical platform used. While aCGH success is dependent upon tumor content, 18 DNA integrity,18,19 type of array,20,21 and the whole genome amplification method 22 used, more subtle effects introduced during FFPE processing may compromise the accuracy of results. Our review of the published literature found that aCGH-detected CNVs in DNA isolated from FFPE specimens differed from case-matched frozen controls in some studies,20,23–25 but not others.18,21,26,27
Studies that explored potential effects of time in fixative (TIF) on aCGH data are limited; aCGH profiles were strongly correlated among astrocytic tumor specimens fixed for 12–96 hours, 18 and among fresh MCF7 specimens and those fixed for 30 minutes–20 hours, but not those fixed for 1 week. 28 While DTF effects on aCGH analysis of FFPE specimens have not been reported, a DTF of 1–2 hours altered fluorescence in situ hybridization signals compared to immediately fixed controls.29–31 Additional studies are required before the suitability of FFPE specimens for aCGH can be assessed with confidence.
The National Cancer Institute's (NCI's) Biospecimen Pre-analytical Variables (BPV) Program was designed to systematically investigate effects of TIF and DTF on the molecular profiles of tumor biospecimens. Studies utilizing BPV specimens have reported significant differences between snap-frozen and FFPE specimens for RNA and DNA integrity, 32 RNA and miRNA-seq profiles, 33 and mRNA transcript levels, 34 as well as among FFPE specimens with different TIFs for RNA and DNA integrity, 32 and miRNA profiles. 35 Potential impacts of TIF and DTF on CNV determination in BPV FFPE tumor specimens were explored using an aCGH microarray assay. Studies within the BPV Program were designed to reflect clinical scenarios whenever possible. Renal cell carcinoma (RCC) tumors were ideal for this BPV study, given they are a common tumor type 36 of adequate size and, cellularly, are relatively homogeneous. 32 While more state-of-the-art technologies are available, aCGH was selected, in part, due to its demonstrated clinical utility.7–9,37,38 In this study, potential TIF and DTF effects on aCGH analysis were explored using patient-matched frozen and FFPE BPV RCC specimens, as well as corresponding blood specimens to assess potential differences in CNVs associated with germline versus somatic origin.
Methods
Specimens
Surgically resected RCC and blood specimens were collected from 38 patients, with informed consent, across four medical centers as part of the NCI's BPV Program using Institutional Review Board-approved protocols. (Emory University IRB00045796 [approved March 2, 2013]; University of New Mexico IRB00000591 [approved June 28, 2012]; University of Pittsburgh IRB0106147 [approved May 28, 2014], IRB0411047 [approved July 18, 2014], IRB09502110, IRB0506140 [approved May 28, 2014], and IRB056140 [approved June 9,2014]; and Boston Medical Center IRB00000376 [approved February 5, 2014]). 32 Details on the design, protocols, and donor/specimen data collection and annotation have been reported previously.32–35,39 Briefly, each RCC specimen was dissected to generate six equally sized pieces that were used for histological evaluation (one piece), the DTF or TIF experimental module (four pieces, one per time point), and a frozen control (DTF <1 hour, one piece frozen in the vapor phase of liquid nitrogen) (Table 1).
Study Design for Time in Fixative and Delay to Fixation Experimental Modules
Each RCC tumor specimen was dissected to generate six equally sized pieces; one piece each was used for histological evaluation and as a snap-frozen control (DTF <1 hour), and the remaining four pieces were used for either the DTF or TIF experimental module. TIF FFPE tumor specimens experienced a DTF of <1 hour before formalin fixation for 6, 12, 23, or 72 hours. DTF FFPE tumor specimens were held at room temperature in a humidified chamber for 1, 2, 3, or 12 hours before a TIF of 10–12 hours. All FFPE tumor specimens were patient-matched within a given experimental module (TIF or DTF; n = 20). DTF, delay to fixation; FFPE, formalin-fixed, paraffin-embedded; RCC, renal cell carcinoma; TIF, time in fixative.
DTF and TIF experimental modules each included 20 patients, with two patients providing specimens for both experimental modules. FFPE specimens in the TIF and DTF experimental modules were held at room temperature in a humidified chamber and fixed in 10% neutral buffered formalin as specified in Table 1. Paraffin embedding was performed as previously described, utilizing the same standard operating procedures and tissue processing equipment at each medical center. Blood was collected before surgery and before the administration of anesthesia in PAXgene blood tubes, frozen at −22°C to −18°C for 24–72 hours, transferred to −90°C to −70°C, and shipped on dry ice to the Van Andel Research Institute (VARI).
DNA extraction
Automated DNA extraction was performed at VARI using QIAsymphony DNA mini kits (Qiagen) for FFPE and snap-frozen (25 mg) tumor, and blood specimens. FFPE sections (4–6, 10 μm-thick) were deparaffinized, lysed, demodified (1 hour at 90°C), and RNase-treated before extraction. In some cases, low yields necessitated extraction from additional sections. DNA purity and concentration were determined by NanoDrop spectrophotometer (Thermo Fisher) and Qubit Fluorometer with the dsDNA BR Assay Kit (Life Technologies). DNA was shipped on dry ice to the Genomics and Epigenomics Shared Resource at Georgetown University Medical Center and stored at −80°C until analysis.
Data acquisition
Whole genome CNV analysis of DNA from 236 specimens (one TIF and three DTF specimens had insufficient DNA yield) was performed using an Agilent SurePrint G3 Human CNV Microarray 400K (Agilent Technologies) and Agilent Genomic DNA ULS Labeling Kits, and reference DNA (human genomic DNA: female; Promega; p/n G1521) as a control according to the manufacturer's instructions. 40 The Agilent SurePrint G3 Human CNV Microarray 400K assay was chosen due to its high-resolution detection of known CNVs in well-annotated datasets 41 and its FFPE-specific workflow. Researchers were blinded to the experimental module (DTF or TIF) and time point of each specimen and its derived DNA sample.
Data analysis and CNV identification
Data quality was assessed using the quality control metric set CGH_QCMT_Oct12. Array performance was assessed by derivative log ratio standard deviation (DLRSD) and the following Agilent-specified thresholds: <0.4 (FFPE), <0.3 (frozen tissue), and <0.2 (blood). 40 DLRSD scores above threshold indicate a high probe-to-probe log ratio noise. Feature extraction software was used to subtract Cy3 from Cy5 signals, after which values were mean normalized across all specimens. Segments with CNVs were identified using the Partek Genomics Suite (PGS) genomic segmentation algorithm and the following requirements: (1) ≥10 genomic markers per region; (2) a p-value <0.001 for differences between two neighboring regions; and (3) a signal to noise ratio ≥0.3. Each diploid copy number change was categorized as “unchanged” (2.3 ≥ copy number ≥1.7); an “amplification” (copy number >2.3); or a “deletion” (copy number <1.7).
Regions containing CNVs were quantified by segmentation analyses, first by experimental module (DTF, TIF including corresponding blood and frozen tumor specimens), and then collectively. CNV regions identified by segmentation analysis were evaluated by principal component analysis (PCA) using PGS. The first two principal components (PCs) were used to visually compare aCGH data from blood, and frozen and FFPE tumor specimens from the DTF and TIF experimental modules individually, and in combination. Hierarchical clustering and heat maps were used for additional comparisons.
Statistical analysis
CNVs located within regions identified by segmentation analysis were compared among groups (blood, frozen tumor, FFPE tumor TIF, or DTF time points) for statistically significant differences using the R (https://www.rdocumentation.org/packages/stats/versions/3.6.2/topics/mcnemar.test) and Bioconductor software package (https://www.bioconductor.org/). The McNemar's test, which is used for within-subject repeated measures of nominal data, was used to assess statistical differences in the frequency of each copy number category (unchanged, amplification, and deletion) between FFPE time points and blood or frozen tumor specimens using a two-dimensional 3 × 3 contingency table (example is provided in Supplementary Table S1).
A contingency table was constructed for each region that contained a CNV. Stratification of the collective FFPE data set permitted analysis of CNVs detected in individual specimens within each experimental module. Thus, multiple paired comparisons between time points and frozen tumor and blood specimens were conducted as outlined in Supplementary Table S2. Overlap among FFPE DTF/TIF time points in segments with significantly altered copy number status relative to frozen or blood specimens was evaluated using UpSet plots. 42
Genes that corresponded to regions with significantly different frequencies in copy number categories between frozen tumor or blood specimens and every DTF or TIF time point were identified using PGSs (https:// www.partek.com/partek-genomics-suite/), Ingenuity Pathway Analysis (https://digitalinsights.qiagen.com/products-overview/discovery-insights-portfolio/analysis-and-visualization/qiagen-ipa/), and the NCBI Reference Sequence Transcripts Database. 43 Using these tools, a list was assembled of genes whose sequences overlapped with CNVs that differed between all FFPE specimens in an experimental module and the respective frozen tumor or blood specimens.
Guanine-cytosine (GC) content was calculated as a percentage for unstable and stable segments. A region containing a CNV was considered “unstable” if the copy number status differed between a TIF/DTF time point and the respective blood or frozen tumor specimen; and a region was considered “stable” if no difference occurred. Statistically significant differences in GC content between stable and unstable segments were determined by unpaired t-test for each TIF and DTF time point. The percentage of stable and unstable regions that contained repeated sequences (terminal, tandem, and interspersed), as well as long interspersed nuclear elements (LINES) and short interspersed nuclear elements (SINES) that were present in regions containing detected CNVs, was identified by searching version 38 (hg38) of the Human Genome Project's human genome assembly (https://www.ncbi.nlm.nih.gov/grc/human). Statistically significant differences in the percentages of repeats, SINES, and LINES between stable and unstable regions were determined by unpaired t-test.
Results
Quality assessment
In total, 236 specimens (blood, frozen, and FFPE tumor specimens) yielded sufficient DNA for analysis; of those, 235 generated aCGH data; one 72-hour TIF specimen failed to meet quality thresholds for labeling. In total, 88.5% (208/235) of specimens met DNA purity thresholds (optical density 260/230 ≥ 1.6) and 89.8% (211/235) of specimens had a signal to noise ratio below the group-defined DLRSD threshold (Table 2). The 24 specimens with an above-threshold DLRSD value had low Cy5 signal intensity, likely due to low labeling efficiency, and included FFPE (11/24) and frozen (12/24) tumor specimens, and blood (1/24) specimens (Table 2).
The Number of Specimens That Failed to Meet Derivative Log Ratio Standard Deviation and DNA Purity Thresholds by Experimental Module
Acceptable DLRSD threshold values were specified by Agilent and were specimen type and preservation method specific (<0.4 for FFPE, <0.3 for frozen, and <0.2 for blood specimens). In total, 13 specimens associated with the TIF experimental module (FFPE TIF time points and patient-matched blood and frozen tumor specimens) had a DLRSD value that exceeded the corresponding DLRSD threshold; FFPE specimens with a TIF of 72 hours accounted for 69% of specimens that failed, while frozen tumor specimens accounted for 23%. Of the specimens associated with the DTF experimental module (FFPE DTF time points and patient-matched blood and frozen tumor specimens), 11 specimens had a DLRSD value that exceeded the corresponding threshold; frozen tumor accounted for 82% of the specimens that failed. The minimum OD 260/230 ratio for DNA purity was set at ≥1.6 for all specimen types and preservation methods. DLRSD, derivative log ratio standard deviation; OD, optical density.
PCA of aCGH data from all specimens (blood, frozen tumor, and FFPE tumor specimens) revealed that the first two PCs accounted for 49.4% of between-specimen variability. Importantly, specimens from the same patient and even the same tumor did not consistently cluster together (Fig. 1), but some clustering based on specimen type, preservation method, and TIF/DTF time point was observed (Supplementary Fig. S1). Specimens also did not cluster based on thresholds for DNA purity or DLRSD when DTF and TIF experimental modules were analyzed together (Supplementary Figs. S2 and S3, respectively), but some specimens that exceeded the DLRSD threshold clustered together when TIF and DTF experimental modules were analyzed separately (Supplementary Figs. S4 and S5, respectively). Specimens with above-threshold DLRSD values overlapped with either 72-hour TIF (TIF module) or frozen tumor specimens (DTF module), suggesting the overlap was largely driven by specimen processing.
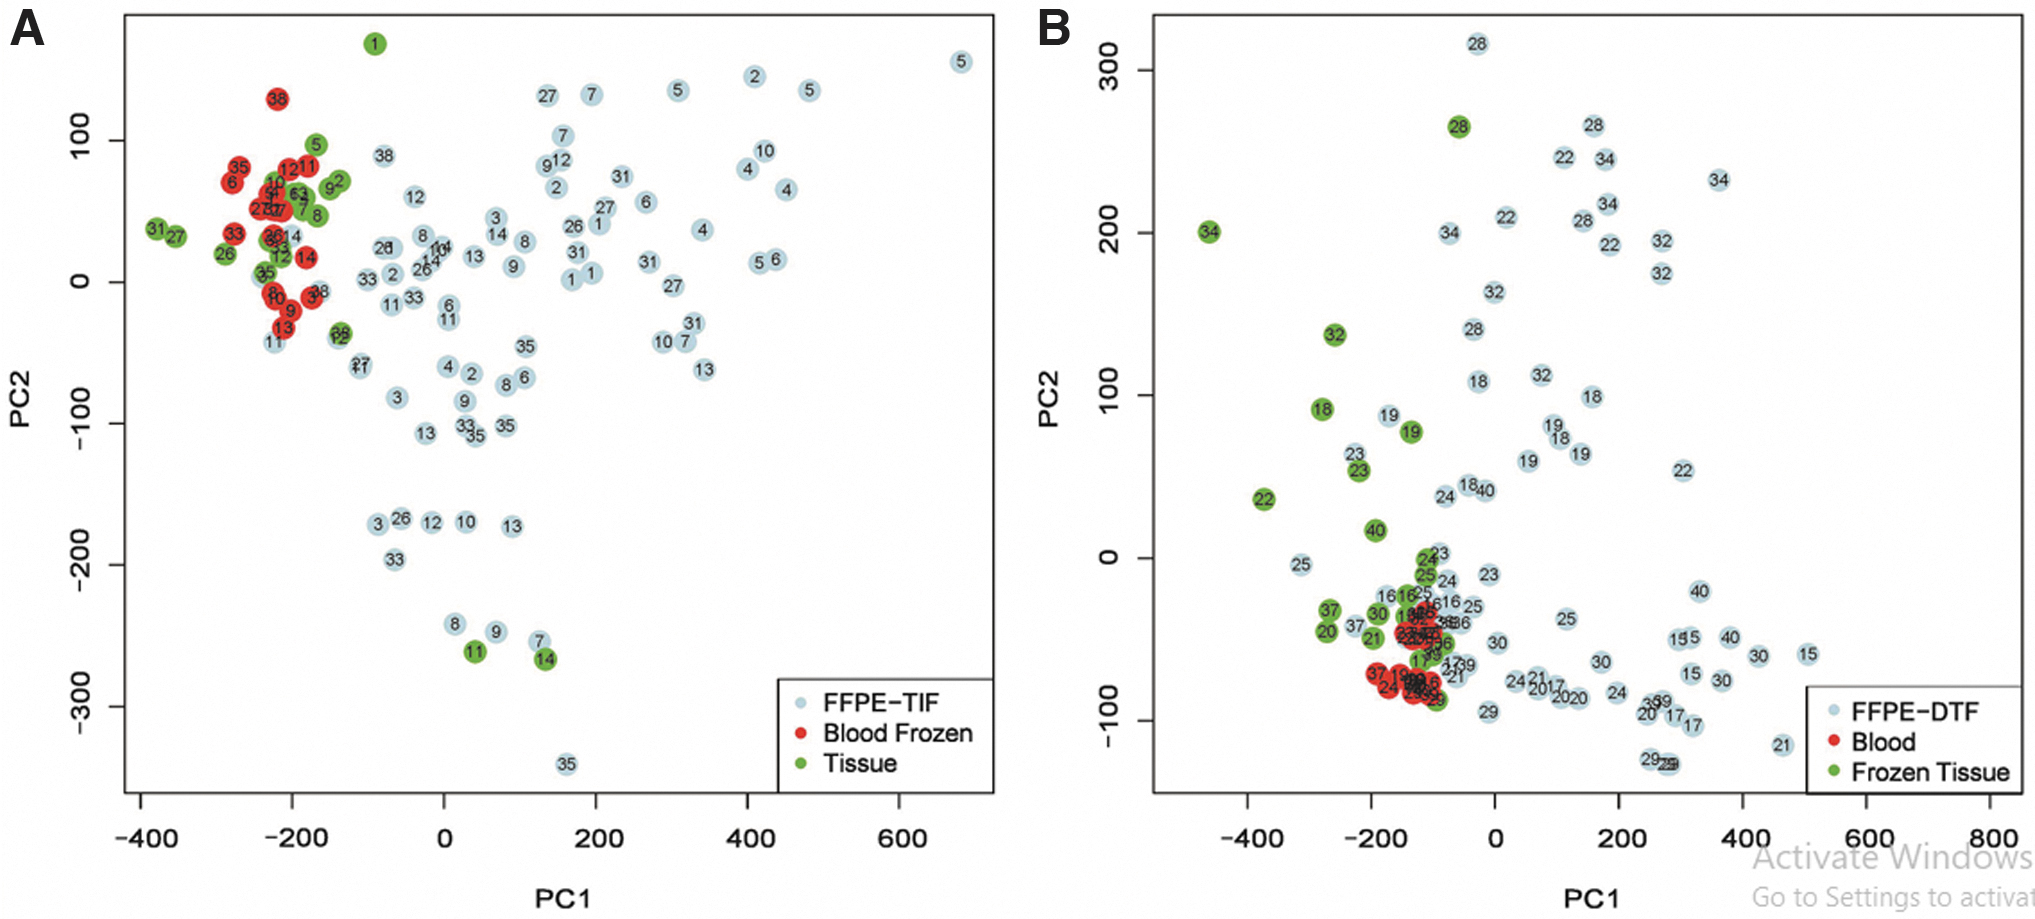
Principal component analysis scatter plots generated from the first two PCs of array comparative genomic hybridization profiles show that blood (red), frozen renal cell carcinoma tumor (green), and FFPE tumor specimens (blue) did not cluster by patient in either the TIF
CNV identification
Blood versus frozen tumor
Frozen tumor specimens had nearly twice the number of CNVs relative to a commercial reference DNA than patient-matched blood (germline) specimens (1.87 times higher in tumor-matched frozen specimens from both the TIF and DTF experimental modules; Tables 3 and 4, respectively). The frequency that CNVs occurred in patients and the average number of CNVs per patient were calculated to better discern whether detected CNVs were genetic, pathological, or artifacts of specimen processing. Frozen tumor specimens had a higher percentage of CNVs present in at least 20% of specimens than blood specimens (59.66% vs. 37.37% for the TIF experimental module and 68.60% vs. 40.90% for the DTF experimental module; Tables 3 and 4, respectively). However, frozen tumor and blood specimens had similar percentages of CNVs that were detected in at least half (≥50%) of specimens (10.33% vs. 12.74% for the TIF experimental module, and 13.11% vs. 10.24% for the DTF experimental module; Tables 3 and 4, respectively).
The Number of Segments with an Identified CNV Relative to Reference DNA in Specimens Associated with the TIF Experimental Module (FFPE TIF Time Points and Patient-Matched Blood and Frozen Tumor Specimens) (n = 118)
Each cell contains the number of segments (%) that were found in at least ≥20% or ≥50% of specimens for a given specimen type (blood and frozen tumor) or FFPE TIF time point. FFPE TIF tumor specimens had more CNVs and a higher average number of patients that possessed each CNV than frozen tumor or blood specimens. CNV, copy number variation; SD, standard deviation.
The Number of Segments with an Identified Copy Number Variation Relative to Reference DNA in Specimens Associated with the DTF Experimental Module (FFPE DTF Time Points and Patient-Matched Blood and Frozen Tumor Specimens) (n = 117)
Each cell contains the number of segments (%) that were found in at least ≥20% or ≥50% of specimens for a given specimen type or FFPE DTF time point. While FFPE tumor specimens with a DTF ≤3 hours had more CNVs than frozen tumor or blood specimens, a progressive decline was observed with DTF. In addition, FFPE tumor specimens with a DTF ≤3 hours had a higher average of patients who possessed each CNV than blood or frozen tumor specimens, although this average also declined with progressive DTF.
In both experimental modules, frozen tumor specimens had a slightly higher number of patients per CNV than blood specimens (5.6 vs. 4.2 for TIF and 5.0 vs. 4.2 for DTF). PCA plots revealed some overlap between frozen tumor and blood specimens; this was true when blood and frozen tumor specimens matched to patients assigned to the TIF and DTF experimental modules were analyzed together (Supplementary Fig. S1) or independently (Fig. 2 and Supplementary Fig. S6). In general, frozen tumor and blood specimens did not cluster by patient after hierarchical clustering based on either the first or the first 10 PCs (Supplementary Figs. S7 and S8, respectively).
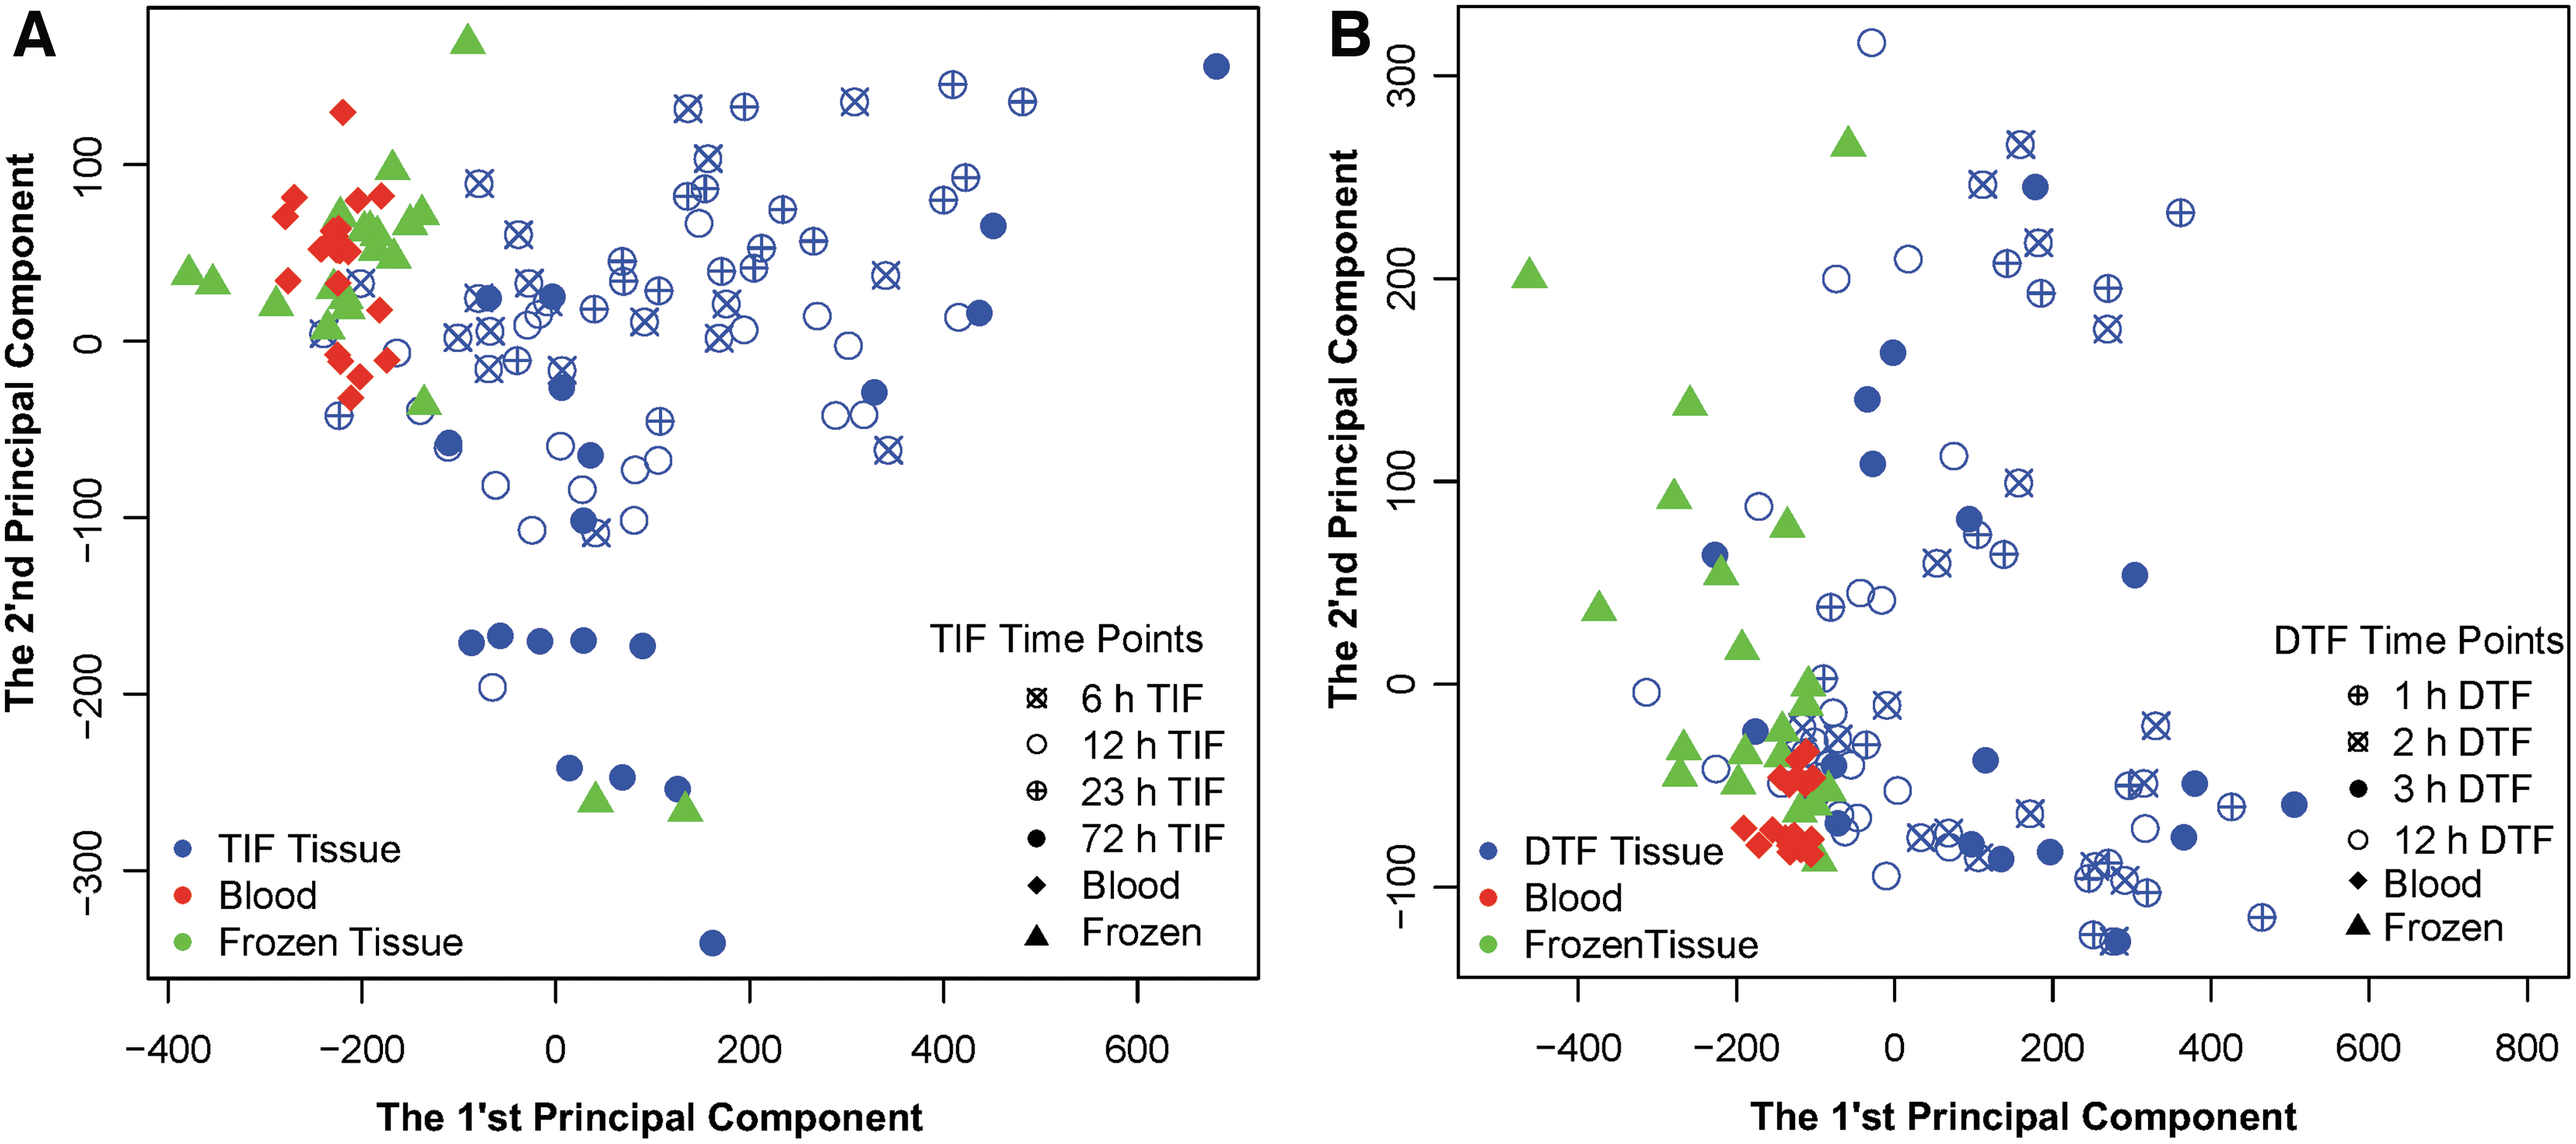
Principal component analysis scatter plots generated from the first two PCs of array comparative genomic hybridization profiles show that blood, frozen tumor, and FFPE tumor specimens did not cluster by preservation method or time point in either the TIF
Frozen versus FFPE tumor
Despite originating from the same resected tumor, FFPE and frozen tumor specimens only partially overlapped with one another on PCA plots (Fig. 2 and Supplementary Fig. S1), and in most cases did not group together after hierarchical clustering using the first 10 PCs (Supplementary Fig. S8). The number of regions with detectable CNVs was approximately two-fold and four-fold greater in FFPE specimens than frozen tumor and blood specimens, respectively, regardless of experimental module (TIF or DTF). FFPE specimens from the TIF experimental module also consistently had a higher percentage of CNVs detected in at least 20% or 50% of specimens than frozen tumor specimens (for all TIF time points), which likely contributed to the large difference in the number of CNV-containing regions that was present when FFPE and frozen tumor specimens were compared (Table 3).
When TIF and DTF FFPE specimens were compared, fewer regions with CNVs were detected in at least 20% or 50% of DTF specimens than in TIF specimens (Supplementary Table S3). Within the DTF experimental module, FFPE specimens with a DTF ≤3 hours had a higher percentage of CNVs that were detected in at least 20% or 50% of specimens compared to matched frozen tumor specimens (Table 4). Differences in the number of high-frequency CNVs among preservation methods translated to a larger number of patients per CNV for most FFPE specimens (those with a TIF of 12–72 hours and a DTF ≤3 hours) compared to frozen tumor specimens.
Effects of TIF and DTF
DTF effects on aCGH data from FFPE tumor specimens were progressive. The total number of CNV-containing segments declined over the DTF time course, exhibiting a 27% decline after a DTF of 12 hours relative to a 1-hour DTF. The number of regions containing CNVs detectable in at least 20% or 50% of specimens declined by 50% or 81% over the DTF time course, respectively. This translated to a progressive reduction in the average number of patients per CNV during the DTF time course (1 vs. 12 hours: 8.2 vs. 4.9 patients, respectively; Table 4). PCA further buttressed these findings as FFPE specimens with a 12-hour DTF formed a subgroup within the larger FFPE specimen cluster (Fig. 2B).
TIF-mediated effects on aCGH data from FFPE tumor specimens were less clear. No appreciable difference in the total number of CNV-containing segments or in the number of regions with CNVs detectable in at least 20% of specimens was observed during the time course. However, the number of regions containing CNVs detected in at least 50% of specimens and the average number of patients per CNV fluctuated among TIF time points relative to 12-hour TIF specimens, with fewer regions and fewer patients identified in 6-hour TIF specimens (22% and 13%, respectively) and more regions and more patients identified in 23-hour TIF specimens (23% and 14%, respectively), but a comparable (<5% difference) number of regions in 72- and 12-hour TIF specimens (Table 3). Nevertheless, on PCA plots, 72-hour TIF specimens formed a subgroup within the larger TIF FFPE cluster (Fig. 2A).
CNV status differences among specimen types, preservation methods, and DTF and TIF time points
The most differences in CNV status (unchanged, amplification, and deletion) were observed when blood specimens were compared to either frozen tumor (20,140–23,564 CNVs) or FPPE specimens with a TIF of 6–12 hours (3027–6257 CNVs) or a DTF of 1–3 hours (4283–5179 CNVs) (p < 0.001; Table 5). While TIF and DTF effects on CNV status were observed, the pattern and significance of differences depended on whether blood or frozen tumor was used for comparison and the stringency of the test.
The Number of Segments with Significant Differences in Copy Number Status Between Groups
The McNemar's test was used to identify significant differences in the frequency of each copy change category (unchanged, amplification, and deletion) between FFPE DTF and TIF time points and corresponding patient-matched blood or frozen tumor specimens. The number of CNVs that displayed a difference at the statistical significance specified is displayed for each comparison. Overall, more differences occurred when blood was compared to either frozen tumor or FFPE tumor specimens, and when frozen tumor and FFPE tumor specimens were compared.
The number of segments with a CNV status that differed between blood and FFPE specimens progressively and consistently declined with longer TIF; however, when frozen tumor was used for comparison, a TIF-induced decline was only apparent when p < 0.001. For the DTF time course, longer DTFs led to a higher number of segments that contained a CNV that differed in status from blood or frozen tumor when p < 0.001. Notably, when blood specimens were used for comparisons, more segments containing CNVs that differed in status from DTF and TIF FFPE specimens were identified than when frozen tumor specimens were used, which indicates that the delta between the two points of reference (blood and frozen tumor) is likely attributable to specimen type and CNV source (germline vs. somatic origin).
The segments that differed significantly in copy number status in DTF or TIF FFPE specimens when compared to blood or frozen tumor specimens (when p < 0.001) displayed little overlap among time points of either experimental module (Fig. 3). Less than 1% of segments that differed significantly between matched blood and frozen tumor specimens also differed when matched blood and FFPE tumor specimens were compared (TIF experimental module, 30 segments and DTF experimental module, 154 segments). There was also considerable variability in which segments displayed an altered CNV status among time points of the same experimental module (DTF or TIF) (Fig. 3).
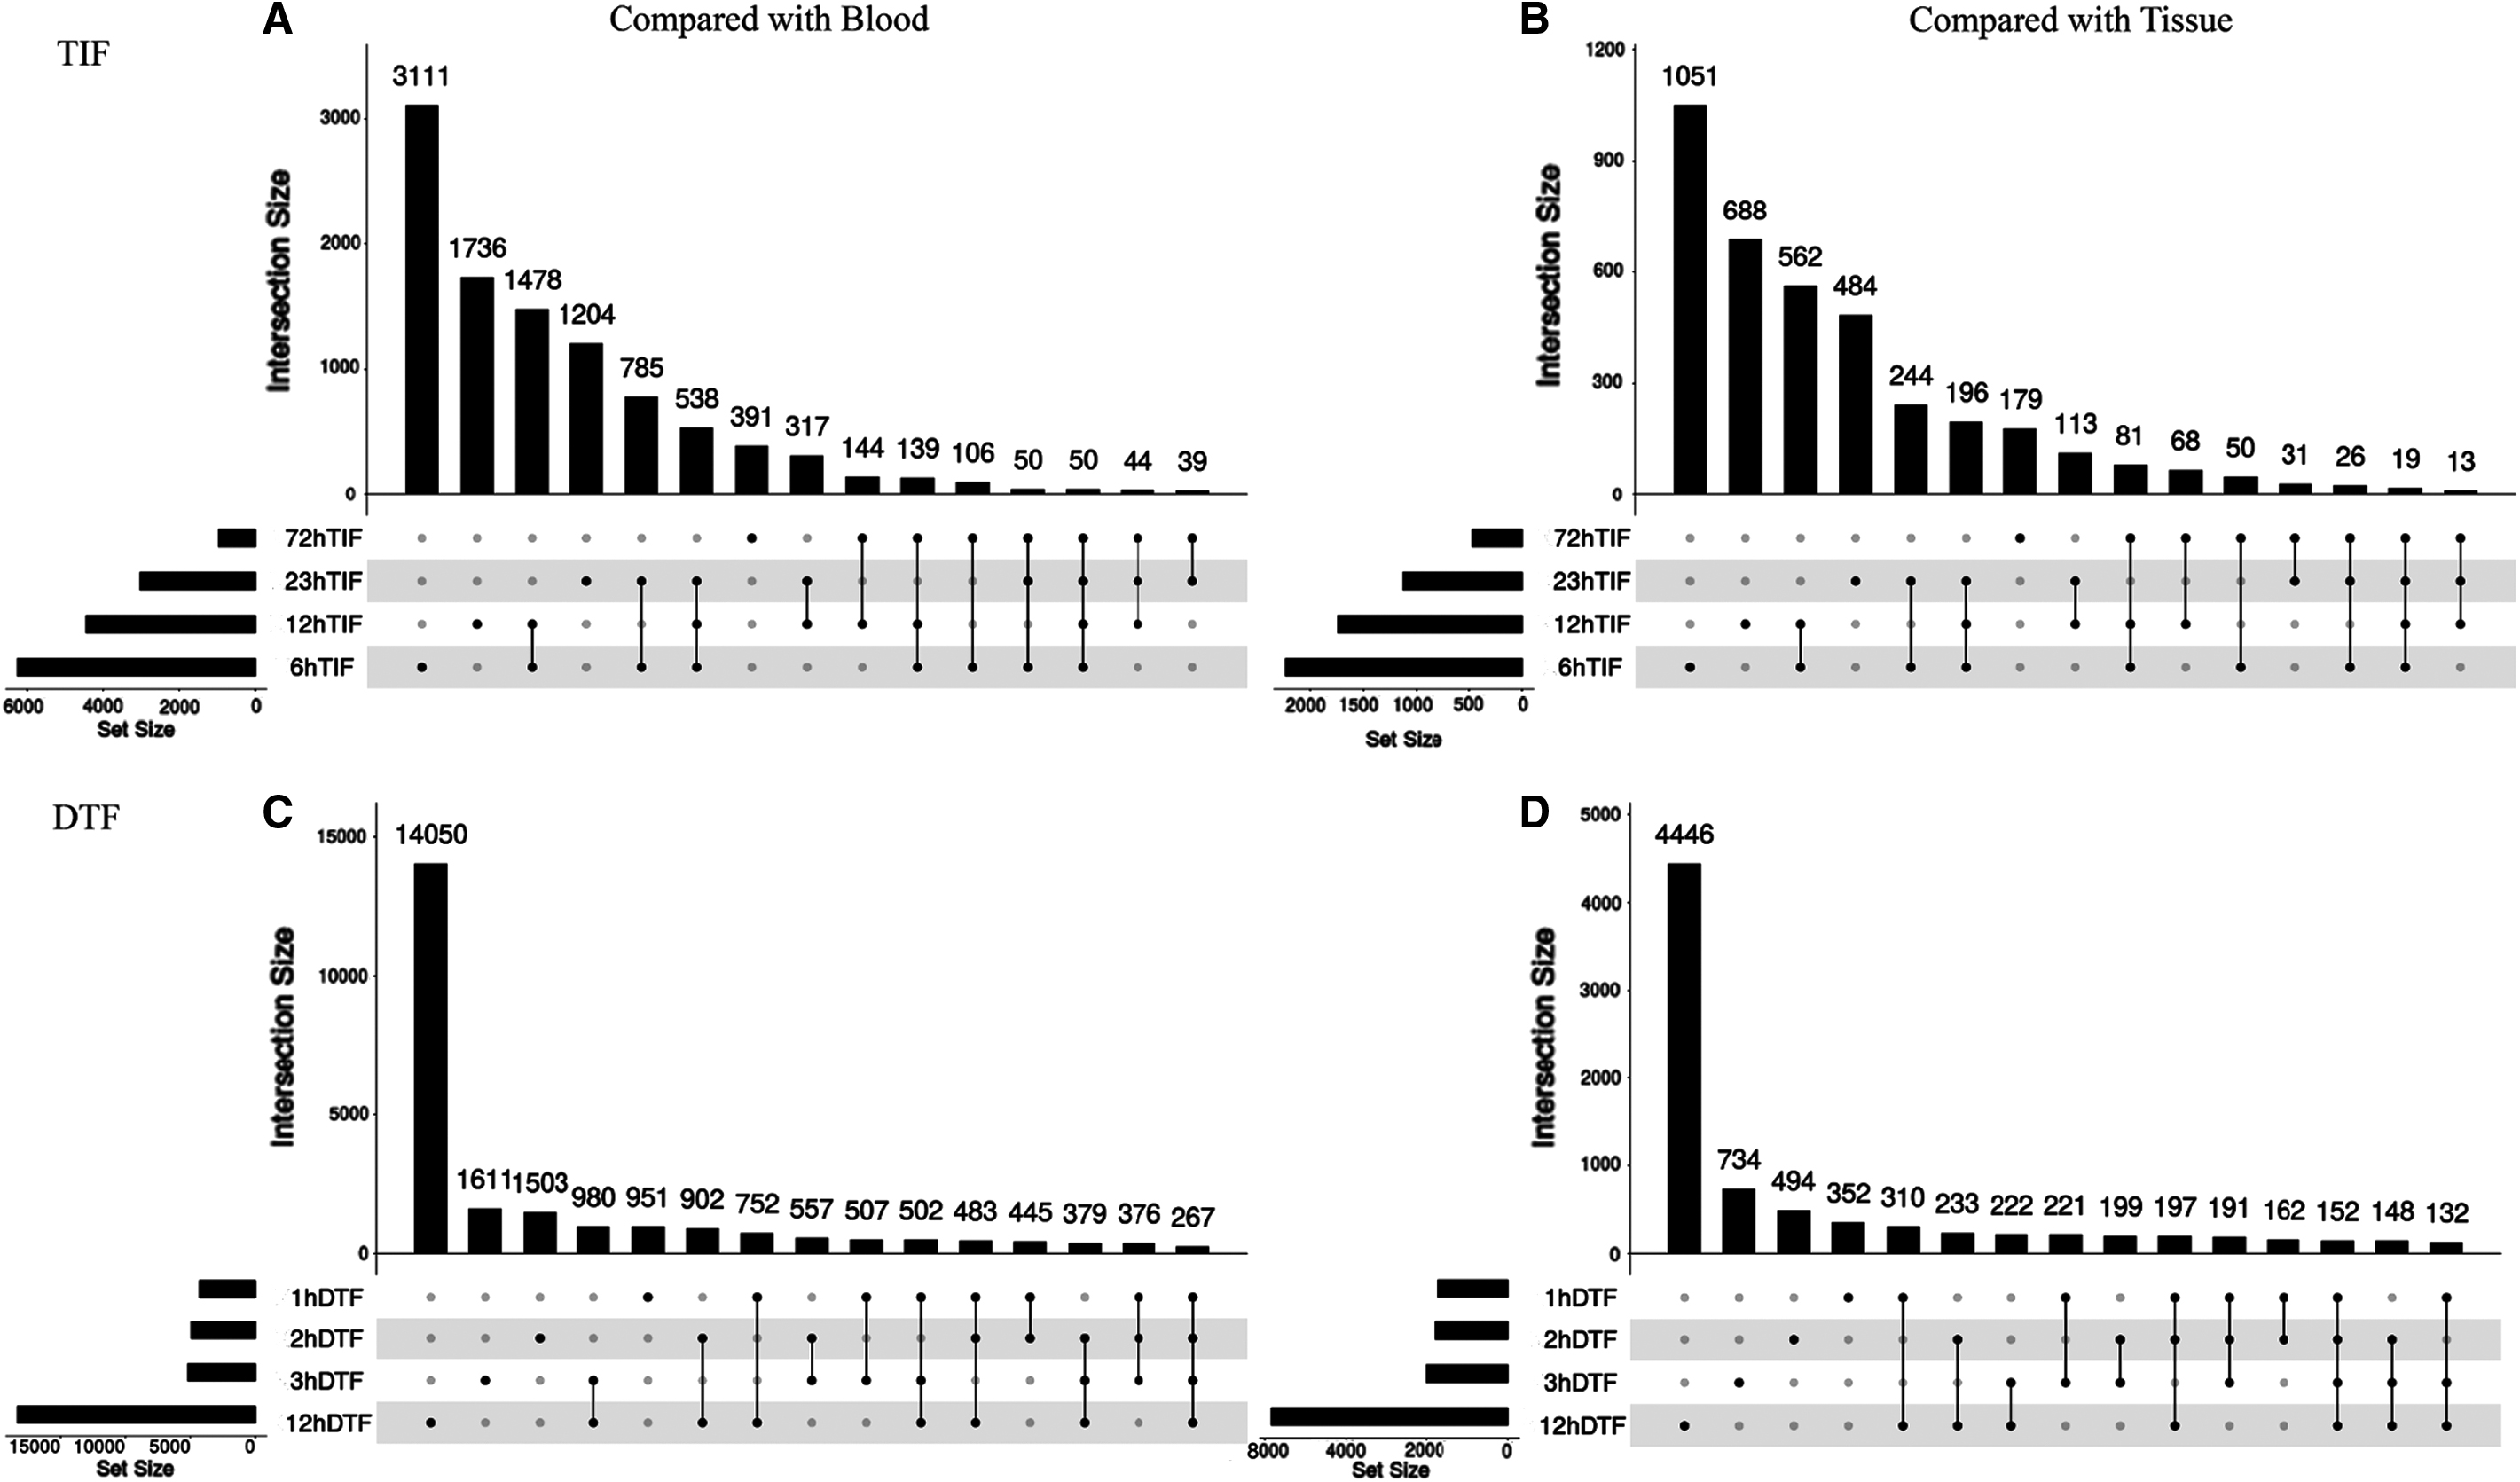
UpSet plot of segments that had a different copy number status than matched blood
Very few segments that differed in CNV status relative to frozen tumor or blood were shared among all FFPE time points (152 in DTF and 19 in TIF relative to frozen tumor, and 267 in DTF and 50 in TIF relative to blood). Supplementary Tables S4–S7 contain lists of genes that correspond to segments with CNV status differences between blood or frozen tumor and all FFPE DTF or TIF time points.
Analysis of differences between stable and unstable segments
Stable and unstable segments relative to those in matched blood and frozen tumor were identified for each FFPE TIF and DTF time point. Average GC content was significantly higher in stable than unstable segments in FFPE specimens with a 12- or 72-hour TIF and in all DTF specimens regardless of time point (p < 0.005, all); however, GC content was comparable in stable and unstable segments in FFPE specimens with a 6- or 23-hour TIF (Supplementary Fig. S9). Further investigation revealed that in FFPE specimens, stable segments had a higher percentage of repeats and SINEs than unstable segments regardless of TIF or DTF time point.
The percentage of LINEs was higher in stable segments than unstable segments in specimens with a TIF of 6, 12, or 72 hours (Supplementary Fig. S10). However, the percentage of LINES was lower in stable than unstable segments in 23-hour TIF specimens and in all DTF time points.
Discussion and Conclusion
Collectively, data from this study indicate that, while aCGH analysis of FFPE is feasible, the preservation process, DTF, and prolonged fixation can adversely affect results. In most instances, hierarchical cluster analysis of aCGH data did not group specimens by patient, nor was PCA clustering based on DNA purity or DLRSD value, suggesting that exclusion of specimens based on these quality markers would not improve accuracy. Further, CNVs affected by formalin fixation were not gene specific, making mitigation of fixation-related effects on aCGH challenging.
aCGH data from blood and frozen tumor specimens displayed an anticipated level of differences. As one might predict, frozen tumor specimens had more identified CNVs than matched blood specimens. While blood and frozen tumor specimens did overlap during PCA when clustering was restricted to the first 2 PCs, they did not overlap when the first 10 PCs were considered, indicating that the first 2 PCs likely reflect artifacts of processing rather than CNV differences associated with tumorigenesis. There were also fewer segments with copy number status differences when frozen and FFPE tumor specimens were compared than when frozen tumor was compared to blood specimens. These results were anticipated, given tumor specimens reflect both heritable (germline) mutations as well as somatic mutations that arose during RCC tumor evolution. 1
Frozen and FFPE tumor specimens had little overlap in PCA, with FFPE specimens having two-fold to three-fold more CNVs identified and a greater percentage of CNVs appearing at high frequency than frozen specimens from the same tumor blocks. Others have also reported a higher number of CNVs detected in DNA derived from FFPE relative to matched snap-frozen tissue.22,23 Although the difference could be attributable to differences in preservation method, processing, and/or tumor heterogeneity, the consistency of the effect and the random assignment of blocks in this study 32 suggest heterogeneity is not a driving factor.
It is more likely these false positives are due, in part, to DNA fragmentation induced during FFPE processing 32 and the effect of DNA degradation on probe hybridization stringency. It is noteworthy that the effect was not random; consistent with previous studies, unstable segments had a lower GC content compared to stable segments. 24 Thus, the number of false positives for CNV in FFPE specimens could be potentially reduced by exclusion of CNVs with a low GC content.
The effects of FFPE processing on CNV identification were also influenced by DTF and TIF. Revealing an adverse effect of a 12-hour DTF, PCA showed a shift in these specimens away from other FFPE specimens, along with an increase in highly significant differences in CNV status. On the other hand, fixation for 72 hours resulted in fewer CNVs with a significantly different status. While this could indicate increased stabilization of the DNA, the broad distribution of 72-hour TIF specimens following PCA coupled with the distance between frozen tumor and 72 TIF subgroups refutes this interpretation. Instead, it supports an adverse effect of prolonged fixation on the consistency of CNV data, which is further supported by lower DNA integrity in TIF 72-hour specimens compared to specimens fixed for shorter durations. 32
The high false positive rate in FFPE specimens cautions against their use for aCGH analysis unless findings can be verified using fresh or snap-frozen specimens. The differences in CNV status in FFPE specimens relative to blood or frozen tumor controls were influenced by TIF and DTF, but effects were inconsistent in terms of affected genes even within the DTF and TIF experimental modules. While GC content and the sequence of repeats may offer clues regarding sequence susceptibility, prediction and/or full mitigation of these effects is not possible without additional study. aCGH data collected from FFPE specimens should be critically examined, given the potential for false positives in CNV identification and, when used, DTF and TIF should be limited to ≤3 and <72 hours, respectively.
Footnotes
Acknowledgments
We thank the research participants whose generous donation of biospecimens made this study possible. For their contributions to the BPV Program, we also thank extended team members at Leidos Biomedical Research, Inc., Emory University, University of New Mexico, University of Pittsburgh, Boston Medical Center, and the VARI. We want to thank our colleagues Tsung-Jung Wu and Drs. Daoud Meerzaman and Qingrong Chen at the NCI Center for Biomedical Information and Information Technology (CBIIT) for their bioinformatics support in the comparison of stable and unstable regions by sequence analysis.
Author Disclosure Statement
No conflicting financial interests exist.
Funding Information
This study was supported by Leidos Biomedical Research (agreement no. 14X245) and NCI Grant P30CA051008.
References
Supplementary Material
Please find the following supplemental material available below.
For Open Access articles published under a Creative Commons License, all supplemental material carries the same license as the article it is associated with.
For non-Open Access articles published, all supplemental material carries a non-exclusive license, and permission requests for re-use of supplemental material or any part of supplemental material shall be sent directly to the copyright owner as specified in the copyright notice associated with the article.