




Abstract
The characterization of DNA methylation patterns to identify epigenetic markers for complex human diseases is an important and rapidly evolving part in biomedical research. DNA samples collected and stored in clinical biobanks over the past years are an important source for future epigenetic studies. Isolated gDNA is considered stable when stored at low temperatures for several years. However, the effect of multiple use and the associated repeated thawing of long-term stored DNA samples on DNA methylation patterns has not yet been investigated. In this study, we examined the influence of up to 10 freeze and thaw cycles on global DNA methylation by comparing genome-wide methylation profiles. DNA samples from 19 healthy volunteers were either frozen at −80°C or subjected to up to 10 freeze and thaw cycles. Genome-wide DNA methylation was analyzed after 0, 1, 3, 5, or 10 thaw cycles using the Illumina Infinium MethylationEPIC BeadChip. Evaluation of the global DNA methylation profile by beta-value density plots and multidimensional scaling plots revealed an expected clear participant-dependent variability, but a very low variability depending on the freeze and thaw cycles. In accordance, no significant difference in any of the methylated cytosine/guanine sites studied could be detected in the performed statistical analyses. Our results suggest that long-term frozen DNA samples are still suitable for epigenetic studies after multiple thaw cycles.
Introduction
Epigenetic processes are DNA modifications that affect the DNA itself or the package of the DNA into chromatin and can change the activity of a DNA segment without changing the sequence. These processes are important for a large number of cellular processes such as differentiation and development. DNA methylation is the most common and so far best-studied DNA modification. DNA methylation is an epigenetic process by which a methyl group is added to the 5′-position of the cytosine residue within a cytosine/guanine (CpG) dinucleotide. The CpG sites are DNA regions with multiple CpG dinucleotides in a linear sequence and often located in large so-called CpG islands, which are defined as regions with a GC content >50%, a CpG ratio >60% and a length of at least 200 bps. Nonmethylated CpG islands are found in the promoter regions of many genes. Hypermethylation of these usually nonmethylated CpG islands can result in downregulation of the transcriptional expression of the gene or gene silencing.1–3
During the past decade, epigenetic studies and in particular the characterization of methylation patterns gained in importance in biomedical research. To date, variations in DNA methylation profiles have been implicated in many complex human diseases such as cancer, alteration of lung function, and metabolic and cardiovascular diseases, and can serve as biomarkers for disease onset and progression.4–10 DNA methylation profiles are not static but subject to dynamic changes and can be modified by several factors including environmental factors.11,12 Therefore, preanalytical handling of samples might be of particular importance for the assessment of DNA methylation patterns to obtain reliable results.
Currently, only a few quality studies are available, which mainly focus on the preanalytical handling of blood samples such as anticoagulants, storage delay, and storage conditions of samples before the DNA isolation.13,14 Isolated DNA is considered to be very stable during long-term storage, but repeated freeze and thaw cycles have been shown to influence DNA integrity. 15 In this study, we examined the stability of global DNA methylation in isolated DNA samples, which underwent a high number of freeze and thaw cycles by comparing genome-wide methylation profiles.
Materials and Methods
Collection of human blood samples
Human blood samples were collected from 19 healthy volunteers (9 male/10 female, age 18–49 years) at the Hannover Medical School (MHH), Clinical Research Center Hannover. The study was approved by the MHH Ethics Committee (no. 3670-2017) and was conducted according to the Declaration of Helsinki Principles. All volunteers included in the study gave an informed consent. Blood collection was done in 7.5 mL K3E Sarstedt S-Monovette tubes (Sarstedt, Nümbrecht, Germany). Whole-blood samples were centrifuged (2000g, 10 minutes) and processed immediately after blood collection using a Hamilton easyBlood workstation (Hamilton, Reno, Nevada) for automated image-based fractionated blood layer detection and aliquotation of plasma and buffy coat. The buffy coat was frozen within 2 hours after blood collection at −80°C until gDNA isolation.
DNA extraction
DNA extraction was performed on a Hamilton chemagic STAR automated sample preparation system (Hamilton) with the chemagic STAR DNA-Blood1k Kit following the manufacturer's recommendations. Extracted gDNA was recovered in a final elution volume of 300 μL (in TRIS CL buffer). DNA concentration and the purity were determined by UV spectrophotometry using a NanoDrop one-channel spectrophotometer (Thermo Fisher Scientific, Waltham, MA). Purity ranges between 260/280 = 1.917–2.055, 260/230 = 1.81–2.093), and concentrations range between 119.096 and 378.13 ng/μL. Concentration and purity of all samples met the requirements for the subsequent analyses.
DNA freeze and thaw cycles
The isolated gDNA of each participant was split into two aliquots and immediately frozen at −80°C. The first DNA aliquot of each participant was stored at −80°C for 10 months as reference with zero freeze and thaw cycles. The second DNA aliquot of each participant was subjected to an additional monthly freeze and thaw cycle (additional freeze and thaw cycle 1–10). For thawing, frozen DNA samples were placed at room temperature (21–23°C) for 6 hours. Afterward, complete defrosting was checked, and samples were frozen at −80°C again. At freeze and thaw cycles 1, 3, and 5, an additional aliquot from the thawed DNA aliquot was taken and frozen at −80°C until analysis.
DNA methylation analysis
Methylation levels were compared between isolated human gDNA frozen for 10 months (no freeze and thaw cycles) and DNA samples after 1, 3, 5, or 10 freeze and thaw cycles. Genome-wide DNA methylation was measured in bisulfite-converted gDNA using the Illumina Infinium MethylationEPIC BeadChip according to the manufacturer's protocols.
Data analysis
For the calculation of beta (ß)-values from intensity data (IDAT) files, the software package ChAMP 16 was used (https://bioconductor.org/packages/release/bioc/html/ChAMP.html). Analyses were carried out with version 2.13.5 Bioconductor release 3.9. Data were loaded with champ.load, which mainly creates a matrix of ß-values from the IDAT files, filters out low-quality probes (detection p > 0.01), and low-quality samples (>10% of failed probes). Data were normalized with champ.norm using the Beta-Mixture Quantile Normalisation (BMIQ) method. To evaluate the statistical significant relevance in the difference of the overall methylation level between the sample groups (freeze and thaw cycles), an analysis of variance (ANOVA) using R (https://www.R-project.org/) for the average ß-value of all samples, as well as a Kruskal–Wallis test, was performed. A p-value of p < 0.05 was considered to be significant. Pairwise statistical analysis for all sample groups (raw and normalized data) was performed using champ:DMP.
A significance threshold (p < 0.05) and a false discovery rate (FDR) <0.1 (adjusted p-value using Benjamini–Hochberg correction) were applied. We used a FDR-based approach to correct p for multiple testing. For paired statistical analysis comparing control samples and 10 × freeze and thaw cycles, the program package RnBeads 17 was used. The program can be obtained from Bioconductor at: https://bioconductor.org/packages/release/bioc/html/RnBeads.html. The analyses were carried out with version 2.2.0 of the program. p-Values on the site (CpG) level were computed using the limma method (i.e., hierarchical linear models from the limma package were used and fitted using an empirical Bayes approach). An FDR <0.1 was considered to be significant.
Results
Assessment of the global DNA methylation profile by ß-value density plots
DNA methylation was determined after continuous storage of the isolated gDNA at −80°C for 10 months without freeze and thaw cycles or storage at −80°C for 10 months interrupted by a different number of freeze and thaw cycles (1, 3, 5, and 10). To identify samples that deviate significantly from others, ß-values of all samples were depicted as density plots. The ß-values showed a distribution within the normal range with peaks around 0.1 (demethylation) and 0.9 (full methylation) (data not shown). The normalized ß-values of the different samples showed a good overlay (Fig. 1), indicating no significant deviations.
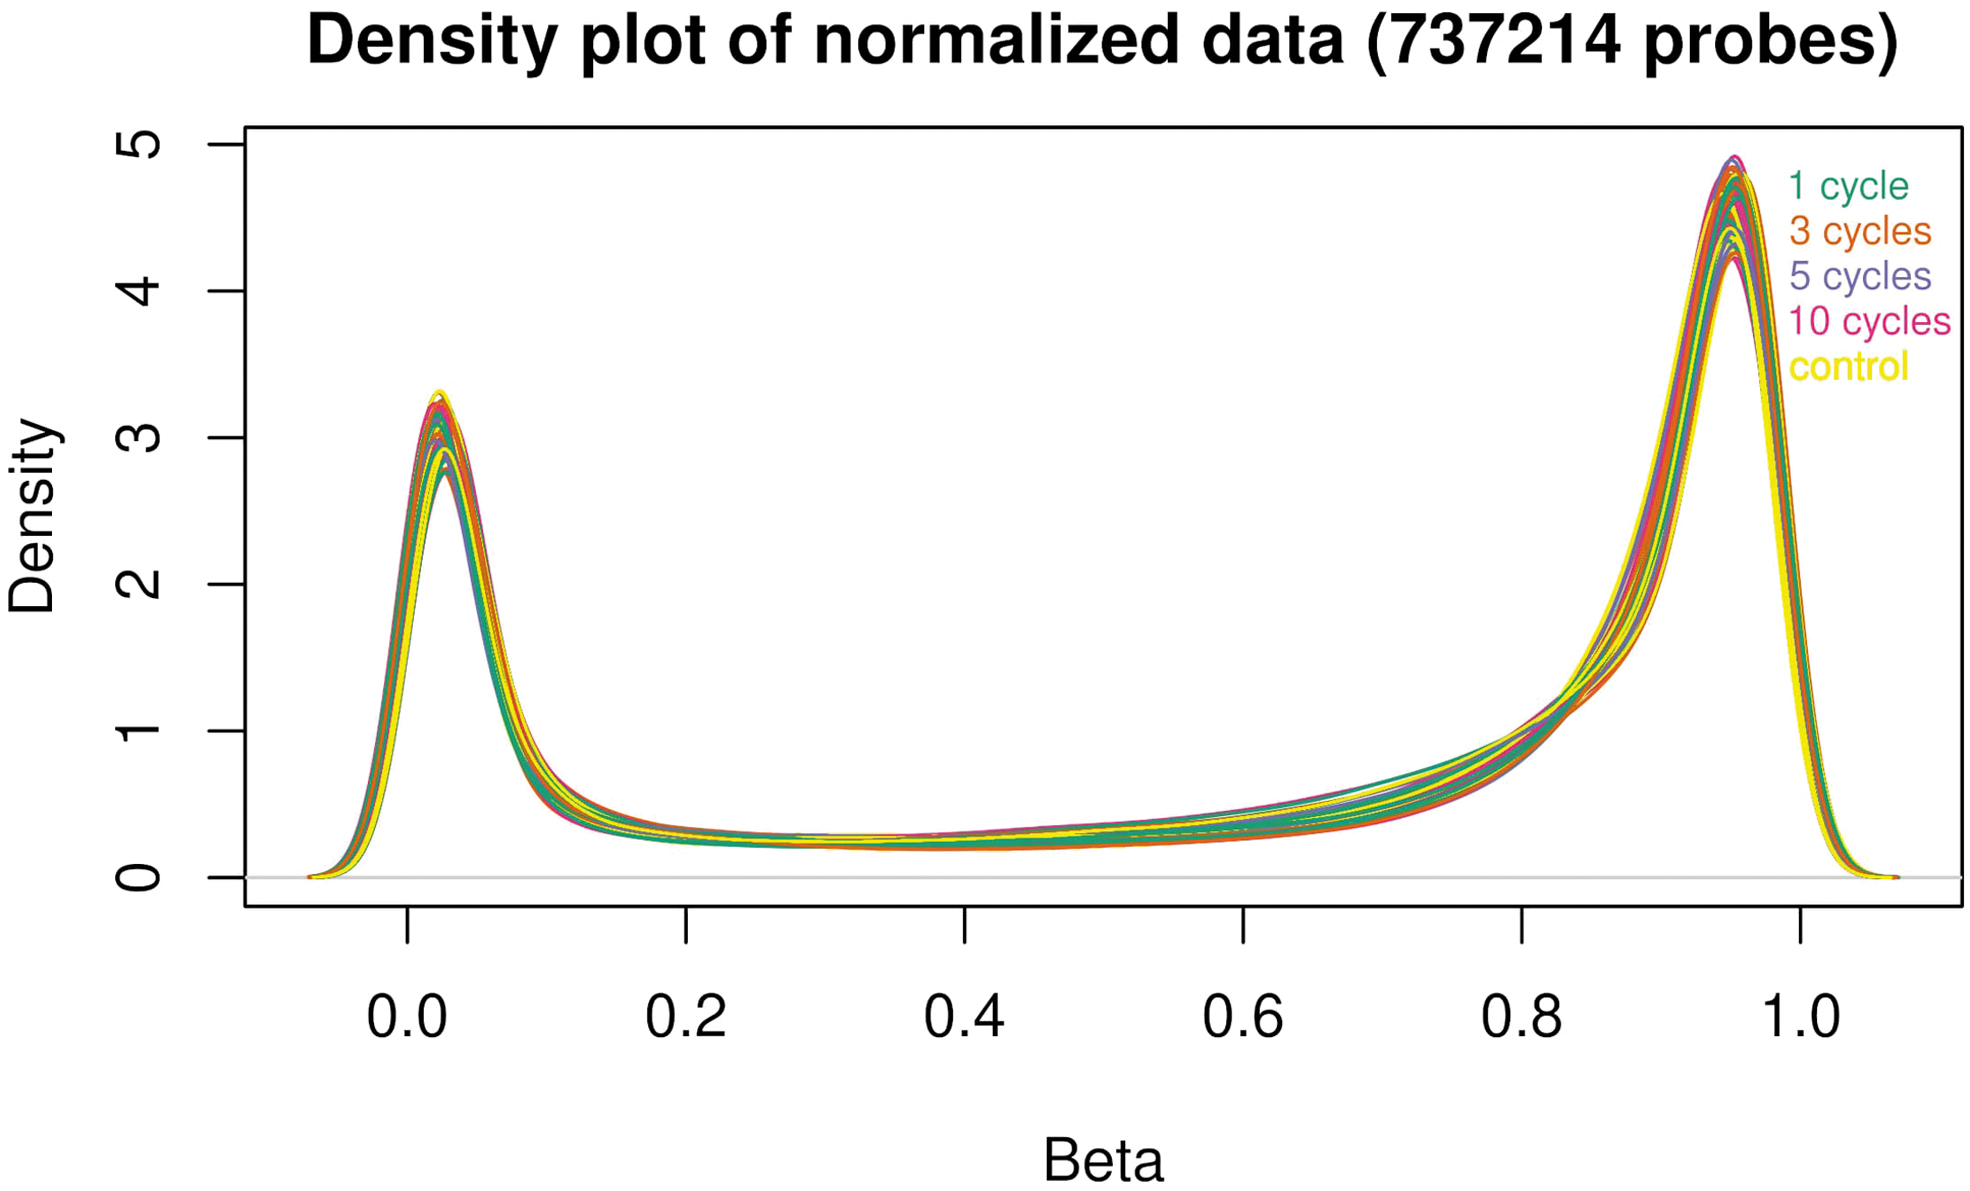
Density plot of normalized ß-values. Normalized ß-values of samples that have passed through a different number of freeze and thaw cycles (1, 3, 5, and 10) and control samples (no freeze and thaw cycle).
Assessment of the global DNA methylation profile by ß-value multidimensional scaling plots
Multidimensional scaling (MDS) plots were created to visualize the similarity of samples based on the top 1000 most variable CpG sites (probes) among all samples. MDS plots were performed again for the raw data (data not shown) as well as for the normalized data (Fig. 2).
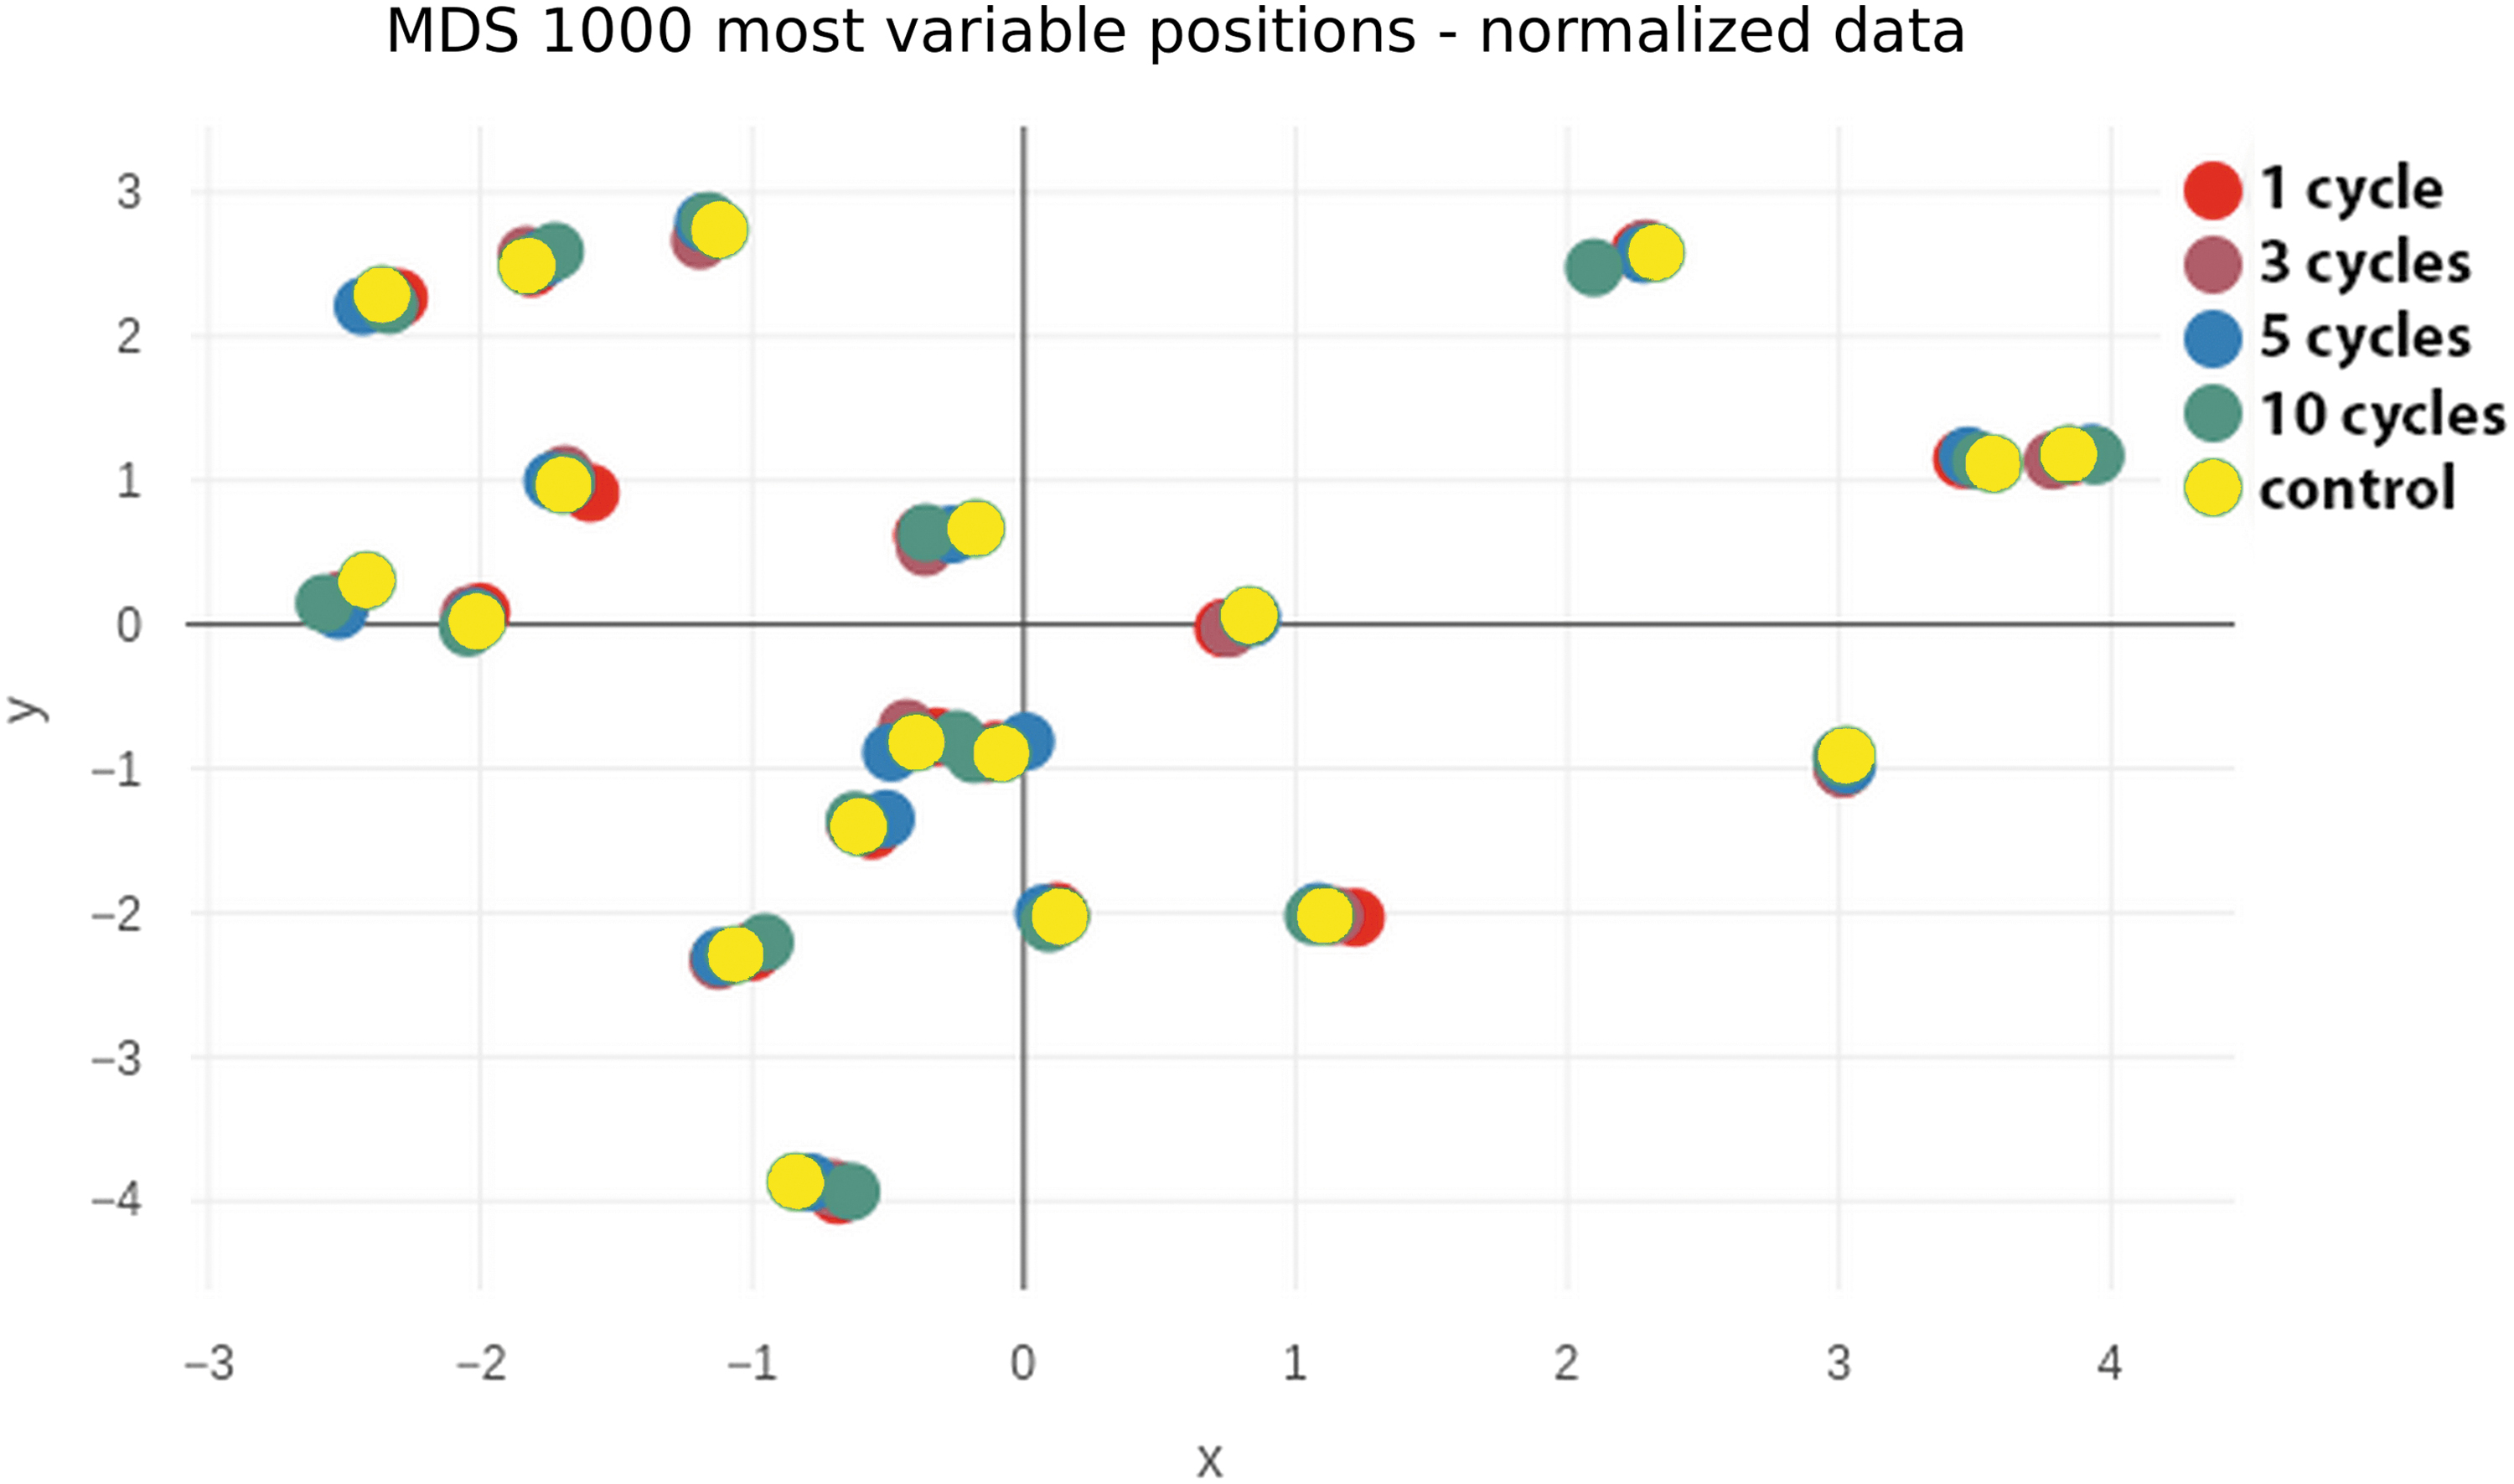
MDS plot of normalized ß-values from the 1000 most variable CpG positions. Samples are colored by sample groups (control [no freeze–thaw cycle], cycle 1, 3, 5, 10) in this plot. CpG, cytosine/guanine; MDS, multidimensional scaling.
As can be seen from Figure 2, the control samples (no freeze and thaw cycle) and the sample from the four different freeze and thaw cycles (1, 3, 5, 10 cycles) of each of the 19 participants clustered together and showed a very low variability. A clear variability is only visible between the 19 participants, but not depending on the freeze and thaw cycles.
Assessment of the global DNA methylation profile by clustering dendrogram
Furthermore, we used the dendrogram functionality of Champ.QC (quality control module of the ChAMP package) to obtain a clustering plot for all samples with the number of freeze and thaw cycles as sample groups. The distance between the samples was calculated directly by all probes (data not shown). As shown in Figure 3 (normalized data), the vast majority of samples cluster according to their assignment to the participant, but not according to freeze and thaw cycles. There are only two exceptions for samples GBAP0028 and GBAP0031, which do not cluster with their participant group. The reason for this may be due to biological or technical variability.

Dendrogram of all samples (normalized data) with the number of freeze and thaw cycles as sample groups.
To evaluate a statistically relevant difference of the overall methylation level between the sample groups (freeze and thaw cycles), we performed an ANOVA and additionally a Kruskal–Wallis analysis using R for the average ß-value of all samples. We found no significant difference between the sample groups with both methods (p < 0.05).
For the pairwise statistical analysis for all sample groups, champ:DMP was applied on raw and normalized data. Applying p < 0.05 and <0.1 (FDR), no significant differential methylated probes could be detected. Given that the magnitude of the effect of any freeze and thaw cycle would logically be largest at 10 cycles, we used this time point for an additional analysis, a paired statistical analysis approach. We compared control samples and 10 × freeze and thaw cycles with the paired differential methylation function of the package RnBeads. 17 Pairing was done between control values and the values after 10 cycles for each participant. Also, with the paired analysis, no significant differential methylation could be detected (FDR <0.1).
Discussion/Conclusion
In this study, we investigated the effect of repeated freeze and thaw cycles on the methylation status of isolated gDNA using an Illumina EPIC BeadChip methylation array, which targets 850,000 CpGs. Our data indicate that up to 10 freeze and thaw cycles have no significant impact on the global DNA methylation status of stored DNA samples.
Epigenetic studies gain in importance in several diseases and the number of studies will continue to increase. DNA samples from different patients collected and stored in clinical biobanks over several years are an important source for future epigenetic studies. Therefore, the suitability of these DNA samples for DNA methylation analyses is of particular importance.
In the past, only a few studies assessing DNA methylation levels in the context of different storage conditions of EDTA blood samples or isolated DNA have been conducted.18–22 While two studies report that certain storage conditions of blood samples can significantly change the DNA methylation status,18,22 other studies reported no or only minimal variations.19–21 In addition, a small number of studies indicate that the DNA methylation status is stable during long-term storage over several years of isolated gDNA.20,21
Isolated gDNA is considered to be very stable and can be stored for a very long time without loss of quality; but several studies indicate that freeze and thaw cycles can lead to progressive DNA degradation.5,23–25 In accordance with the established biobanking guidelines, most biobanks divide isolated gDNA samples into several aliquots for storage to avoid freeze and thaw cycles.26,27 However, DNA concentrations in the individual samples can vary greatly, which makes it difficult to define an appropriate aliquot size. Depending on the DNA concentration in the sample and the amount of DNA required, in some cases only small sample amounts (up to a few μL) are needed. This can result in DNA samples being thawed and refrozen more frequently than other biospecimens due to sample requests.
Our results suggest that frozen DNA samples that have gone through up to 10 freeze and thaw cycles are still suitable for genome-wide methylation profile assessment by microarray.
However, some limitations must be considered. First, the sample size of 19 participants is rather low. Therefore, we might lack statistical power to conclusively determine the effects of freeze and thaw cycles on genome-wide methylation profiles. Second, a total of 10 repeat freeze and thaw cycles were tested over 10 months. We cannot exclude that longer storing times or more frequent freeze and thaw cycles impact methylation profiles. In addition, we cannot exclude that the first freezing itself has impact on the epigenetic profile. Third, the methylation assessment was done using array-based technology, which requires the fragmentation of DNA for binding to probe sets. The main effects of freeze and thaw cycles are the degradation and fragmentation of DNA. Therefore, the findings suggest that repeat and freeze and thaw cycles do not negatively impact methylation profile assessment by microarray. The same cannot be implied for other technologies such as methylome sequencing.
To date, a possible negative influence of long-term storage conditions and thawing cycles of blood samples on the suitability of DNA sample for methylation studies cannot be excluded. We therefore conclude that a prompt gDNA extraction and long-term storage of isolated gDNA instead of repeated thawing of blood samples should be preferred for genome-wide methylation profile assessment by microarray. In view of possible other uses, the gDNA should be stored in several small aliquots to avoid DNA degradation by freeze and thaw cycles.
Footnotes
Acknowledgments
The authors thank the team of the Center for Clinical Trials for organizing the participant recruitment and blood collection and the laboratory team of the Hannover Unified Biobank for processing the samples, especially Bettina Wilhelm for isolating the DNA and performing the freeze and thaw cycles.
Authors' Contributions
Study concept and design (T.I., N.K., and V.K.); data curation (N.N. and R.W.), formal analysis (R.W., R.G., and M.S.), investigation (V.K. and I.B.), project administration (V.K.), resources (T.I., R.W., R.G., and M.S.), software (R.G. and M.S.), supervision (T.I., V.K., and M.S.), validation (N.N., R.W., R.G., and M.S.), writing (V.K. and M.S.), specifically critical review, commentary, or revision (T.I., M.S., N.K., and I.B); all the authors approved of the final article.
Author Disclosure Statement
No conflicting financial interests exist.
Funding Information
No funding was received for this article.