




Abstract
Background:
The measurement of nucleic acid quality, especially the analysis of integrity, is a key step for many downstream experiments in biomedical research and quality control of biomaterials. General gel electrophoresis is a traditional method for nucleic acid integrity analysis. Currently, more electrophoresis techniques are becoming standardized and automated operations with higher precision. In this study, we have evaluated the comparability and bias of the outcomes from three commercial assay systems.
Methods:
Seventy-two deoxyribonucleic acid (DNA) and 67 ribonucleic acid (RNA) samples were selected for methodological comparison among different systems. The DNA Quality Number (DQN) and RNA Quality Number (RQN) of BIOptic Qsep400, DNA Quality Score (DQS) and RNA Quality Score (RQS) of PerkinElmer Labchip GX Touch HT were separately compared with the DNA Integrity Number (DIN) and RNA Integrity Number (RINe) of the Agilent 4200 TapeStation according to Clinical and Laboratory Standards Institute (CLSI) guideline (EP09-A3).
Results:
The biases of the mean estimated between DQN and DIN, DQS and DIN both exceeded the acceptance criteria. The Passing–Bablok regression analysis between DQN and DIN, and the Deming regression analysis between DQS and DIN, showed the biases were both within the acceptance criteria, and the bias between DQN and DIN was smaller. For the comparisons of RQN and RINe, RQS and RINe, the regression analyses revealed the biases were both within the acceptance criteria. The bias of the mean estimated between RQS and RINe was outside of the acceptance criteria.
Conclusions:
There was a good comparability in nucleic acid integrity detection between BIOptic Qsep400 and PerkinElmer Labchip GX Touch HT with the Agilent 4200 TapeStation. However, the bias and linear correlations require more attention between systems.
Introduction
Nucleic acids, including deoxyribonucleic acid (DNA) and ribonucleic acid (RNA), are the research basis for molecular biology and are often referred to as the sample quality control indicators in biobanks. As nucleic acid quality analysis is important for many downstream experiments in biomedical research, and quality monitoring of most biomaterials in biobanks, it is one of the most crucial steps in any molecular technique and quality control of biomaterials.
Currently, methods for nucleic acid quality analysis generally include ultraviolet spectrophotometry and electrophoresis. The ratio of absorbance at 260 and 280 nm (the A260/280 ratio) is frequently used to assess the purity of DNA and RNA. The integrity measurement can show the degradation of nucleic acid fragments, which indicates whether a sample could be used for downstream experiments or the preservation of biological samples.1–4
Common methods for the evaluation of nucleic acid degradation include general gel electrophoresis, 5 high precision gel electrophoresis, microfluidic electrophoresis and capillary electrophoresis systems.6,7 General gel electrophoresis is the traditional method for nucleic acid integrity analysis. However, it is time-consuming and manual-operation heavy, as well as easily contaminated. Other methods belong to the new types of liquid phase separation technology, with easier operation and higher precision in the detection limit, resolution and quantification, although usually with higher costs and a limited sample concentration range
At present, the most popular nucleic acid analyzers on the market use high precision gel electrophoresis, microfluidic electrophoresis, and capillary electrophoresis to separate DNA and RNA include Agilent 2100/4200, PerkinElmer Labchip, and BIOptic Qsep100/400. These three assay systems can provide an integrity index, electropherogram, and Peak Diagram. For DNA analysis, the PerkinElmer Labchip assesses DNA integrity by an integrity index from 1 to 5, whereas the index is from 1 to 10 for the other two systems.
For RNA analysis, all the three systems assess RNA integrity by an integrity index from 1 to 10. For both DNA and RNA analysis, the higher integrity index indicates the better integrity. Currently, Agilent's integrity index is the most widely recognized on the market, and the RNA Integrity Number (RIN) has been recognized as a gold standard for RNA quality measurement based on the degree of sample degradation. 8 Other assay systems need to further provide systematic comparative data to improve user acceptance. However, the comparisons of these assay systems or methods are still needed.
Thus, to determine the comparability of the integrity analysis for several assay systems, we measured the integrity of the same nucleic acids, referring to the Clinical and Laboratory Standards Institute guideline (CLSI) EP09-A3 in this study. 9 It is important to unify nucleic acid quality standards and provide researchers with an estimation for the reliability of the obtained results from different nucleic acid integrity assay systems.
Materials and Methods
DNA and RNA preparation
DNA and RNA in this study were prepared in advance and stored at −80°C freezers of the Biological Resource Center, The Second Affiliated Hospital of Guangzhou University of Chinese Medicine. A total of 72 DNA samples were extracted from blood and tissue using QIAamp and QIAsymphony (Qiagen, Hilden, Germany), and a total of 67 RNA samples were extracted from peripheral blood mononuclear cells using TRIzol (Ambion, Life Technology, Carlsbad, CA). These samples came from projects in the Biological Resource Center with signed informed consent to have their specimens stored for research purposes and quality analysis. We obtained approval of the project from the Ethics Committee of Guangdong Provincial Hospital of Chinese Medicine. Based on the needs of the integrity assay systems, DNA and RNA were thawed at room temperature and assessed using a Nanodrop 2000c spectrophotometer (Thermo Scientific, Waltham, MA) for yield (absorbance at 260 nm) and purity measurements (260/280 and 260/230 absorbency ratios). 10
DNA and RNA integrity assay procedure
DNA and RNA integrity were separately measured by using the three systems according to the manufacturer's instructions, which included the Agilent 4200 TapeStation with its Genomic DNA ScreenTape and RNA Screen Tape (Agilent Technologies, Inc., Santa Clara, CA), BIOptic Qsep400 with its Kilobase Cartridge Kit (S3) (S3) and RNA Cartridge Kit (R1) (BIOptic, Jiangsu, China), the PerkinElmer LabChip GX Touch HT with its Genomic DNA Reagent Kit and RNA Reagent Kit (PerkinElmer, Waltham, MA). According to CLSI's EP09-A3, all systems participating in this study first completed a calibration test. Agilent 4200 was selected as the reference method because of its higher market acceptance, and BIOptic Qsep400 and PerkinElmer Labchip GX Touch HT were used as the methods to be evaluated. All tests were conducted in the same environment.
The results were presented as DNA Integrity Number (DIN) and RINe for the Agilent 4200, DNA Quality Number (DQN) and RNA Quality Number (RQN) for BIOptic Qsep400, DNA Quality Score (DQS) and RNA Quality Score (RQS) for PerkinElmer Labchip GX Touch HT, most of which have values from 1 to 10, with the larger the value, the higher the integrity. Since the scoring range of DQS from 1 to 5 is inconsistent with others, the DQS was multiplied by 2 as the measurement result in the data analysis for reference. The measurements included the analysis samples and eliminated invalid samples.
Statistical analysis
For statistical analysis, the software Excel, SPSS26, MedCalc V20.1.0, and Matlab R2019a were used based on the CLSI EP09-A3 method comparison studies. The outliers were identified using Extreme Studentized Deviate (ESD). Regression analysis was performed using the Deming, Passing–Bablok, and OLR models. According to the allowable total error (TEa) stipulated by the Amendments of the U.S. Clinical Laboratory Improvement Act (Clinical Laboratory Improvement Amendments 1988, CLIA’88), the clinical acceptance criteria were defined as bias within 1/2 TEa interval (±7.5%).
Results
Comparison of DQN, DQS, and DIN
DNA was measured by three assay systems at the same time, and the values of DQN, DQS, and DIN were obtained. Except for the values of invalid samples, DIN was used as a measurement result of the reference method (x-axis), DQN and DQS were, respectively, used as the measurement results of the method to be evaluated (y-axis). The scatterplots were drawn (Fig. 1A, G), and suspicious outliers could be initially identified by visual inspection. Then, the ESD method was further used to test the outliers based on the CLSI EP09-A3. Results showed that there were no outliers in the samples of comparison between DQN and DIN (N = 70) (Supplementary Table S1), DQS and DIN (N = 62) (Supplementary Table S2).
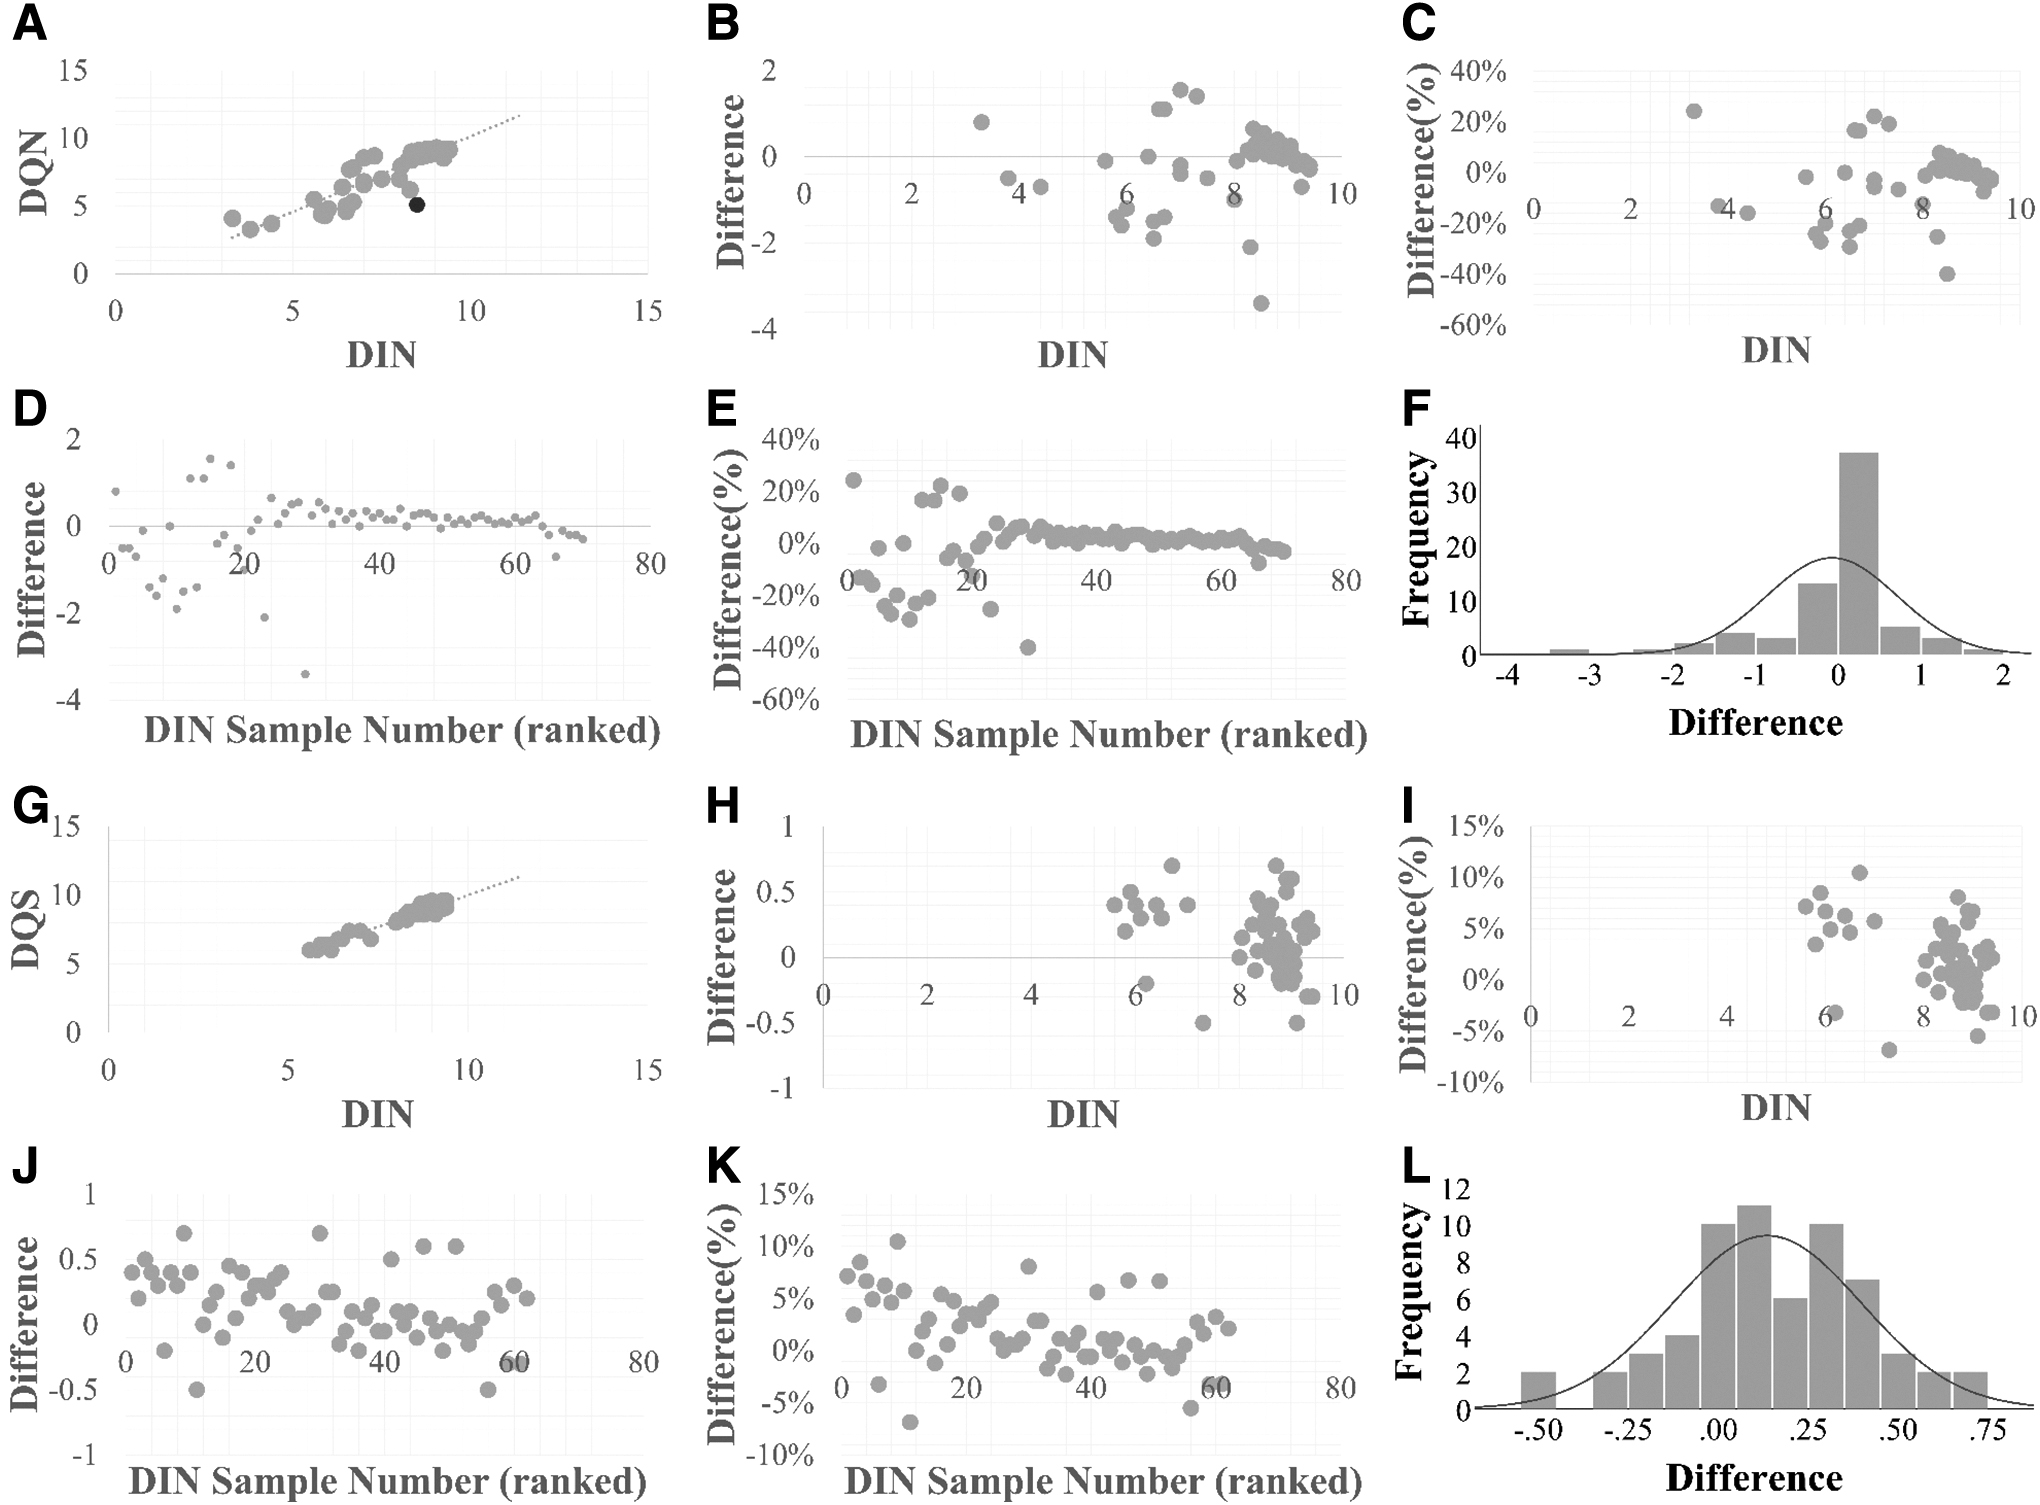
The comparison of DQN, DQS, and DIN.
The deviation plots and ranking deviation plots were used for the latent feature analysis of the difference between methods. The deviation plot of the difference between DQN and DIN illustrated that the DNA measurement data were not equally distributed (Fig. 1B, C), and the data were mostly concentrated at the high value interval from 8 to 10. Although the ranking deviation plot illustrated that the differences between methods were mixed (constant standard deviation [SD] and constant coefficient of variation [CV]) (Fig. 1D, E), there was a constant SD in the interval from 30 to 70, and a relatively constant proportional change difference in the interval from 1 to 29.
Therefore, the Deming and Passing–Bablok models were suitable for regression and bias analysis. Similarly, the deviation plot of the difference between DQS and DIN illustrated that the data were not equally distributed (Fig. 1H, I), whereas the ranking deviation plot illustrated that the differences between methods are constant with regard to the CV (Fig. 1J–K). Here, Deming models were suitable for regression and bias analysis.
According to CLSI EP09-A3, the mean value was used to estimate the bias when the difference frequency histogram of different methods showed a normal distribution; otherwise, the median was used. The difference frequency histogram of the measurement samples between DQN and DIN generally illustrated a normal distribution (Fig. 1F). Thus, the mean value was used as an estimate of the bias, which was −7.86% and exceeded the clinically acceptable criteria. The difference frequency histogram of DQS and DIN similarly illustrated a normal distribution (Fig. 1L), and the mean value (13.55%) was also used as an estimate of the bias, which exceeded the clinically acceptable criteria.
Based on a previous confirmed regression model, Deming and Passing–Bablok models were used for regression analysis of DQN and DIN. The regression equations were fitted as y = −1.9697 + 1.2356x and y = −0.9520 + 1.1224x. Confidence interval (95% CI) of slope, respectively, was 1.0442–1.4269 without including 1 and 0.8978–1.2971 including 1, and the 95% CI of intercept, respectively, was −3.6431 to −0.2964 without including 0 and −2.4983 to 1.0519 including 0. The bias at the medical decision level was outside the acceptable criteria in the Deming model (Table 1), and within acceptable criteria in the Passing–Bablok model (Table 1). For regression analysis of DQS and DIN, the Deming model was used. The regression equation was fitted as y = 0.5453 + 0.9509x, whereas 95% CI of slope was 0.8780–1.0238 including 1 and 95% CI of intercept was −0.0733 to 1.1639 including 0. The bias at the medical decision level was in the range of acceptable criteria (Table 2).
Bias of Different Regression Models at the Medical Decision Level When Comparing DNA Quality Number with DNA Integrity Number
DNA, deoxyribonucleic acid.
Bias of Different Regression Models at the Medical Decision Level When Comparing DNA Quality Score with DNA Integrity Number
Comparison of RQN, RQS, and RINe
Similar to the DNA assay, RQN, RQS, and RINe were obtained from measuring the same RNA by different assay systems. Except for the value of invalid samples, RINe was used as measurement result of the reference method, RQN and RQS were, respectively, used as the measurement results of the method to be evaluated. First, the scatterplots were drawn for RQN and RINe (N = 60) (Fig. 2A), RQS and RINe (N = 66) (Fig. 2G), then the outliers could be identified by visual inspection and ESD. There were no outliers in the samples of comparison between RQN and RINe (Supplementary Table S3), RQS and RINe (Supplementary Table S4).
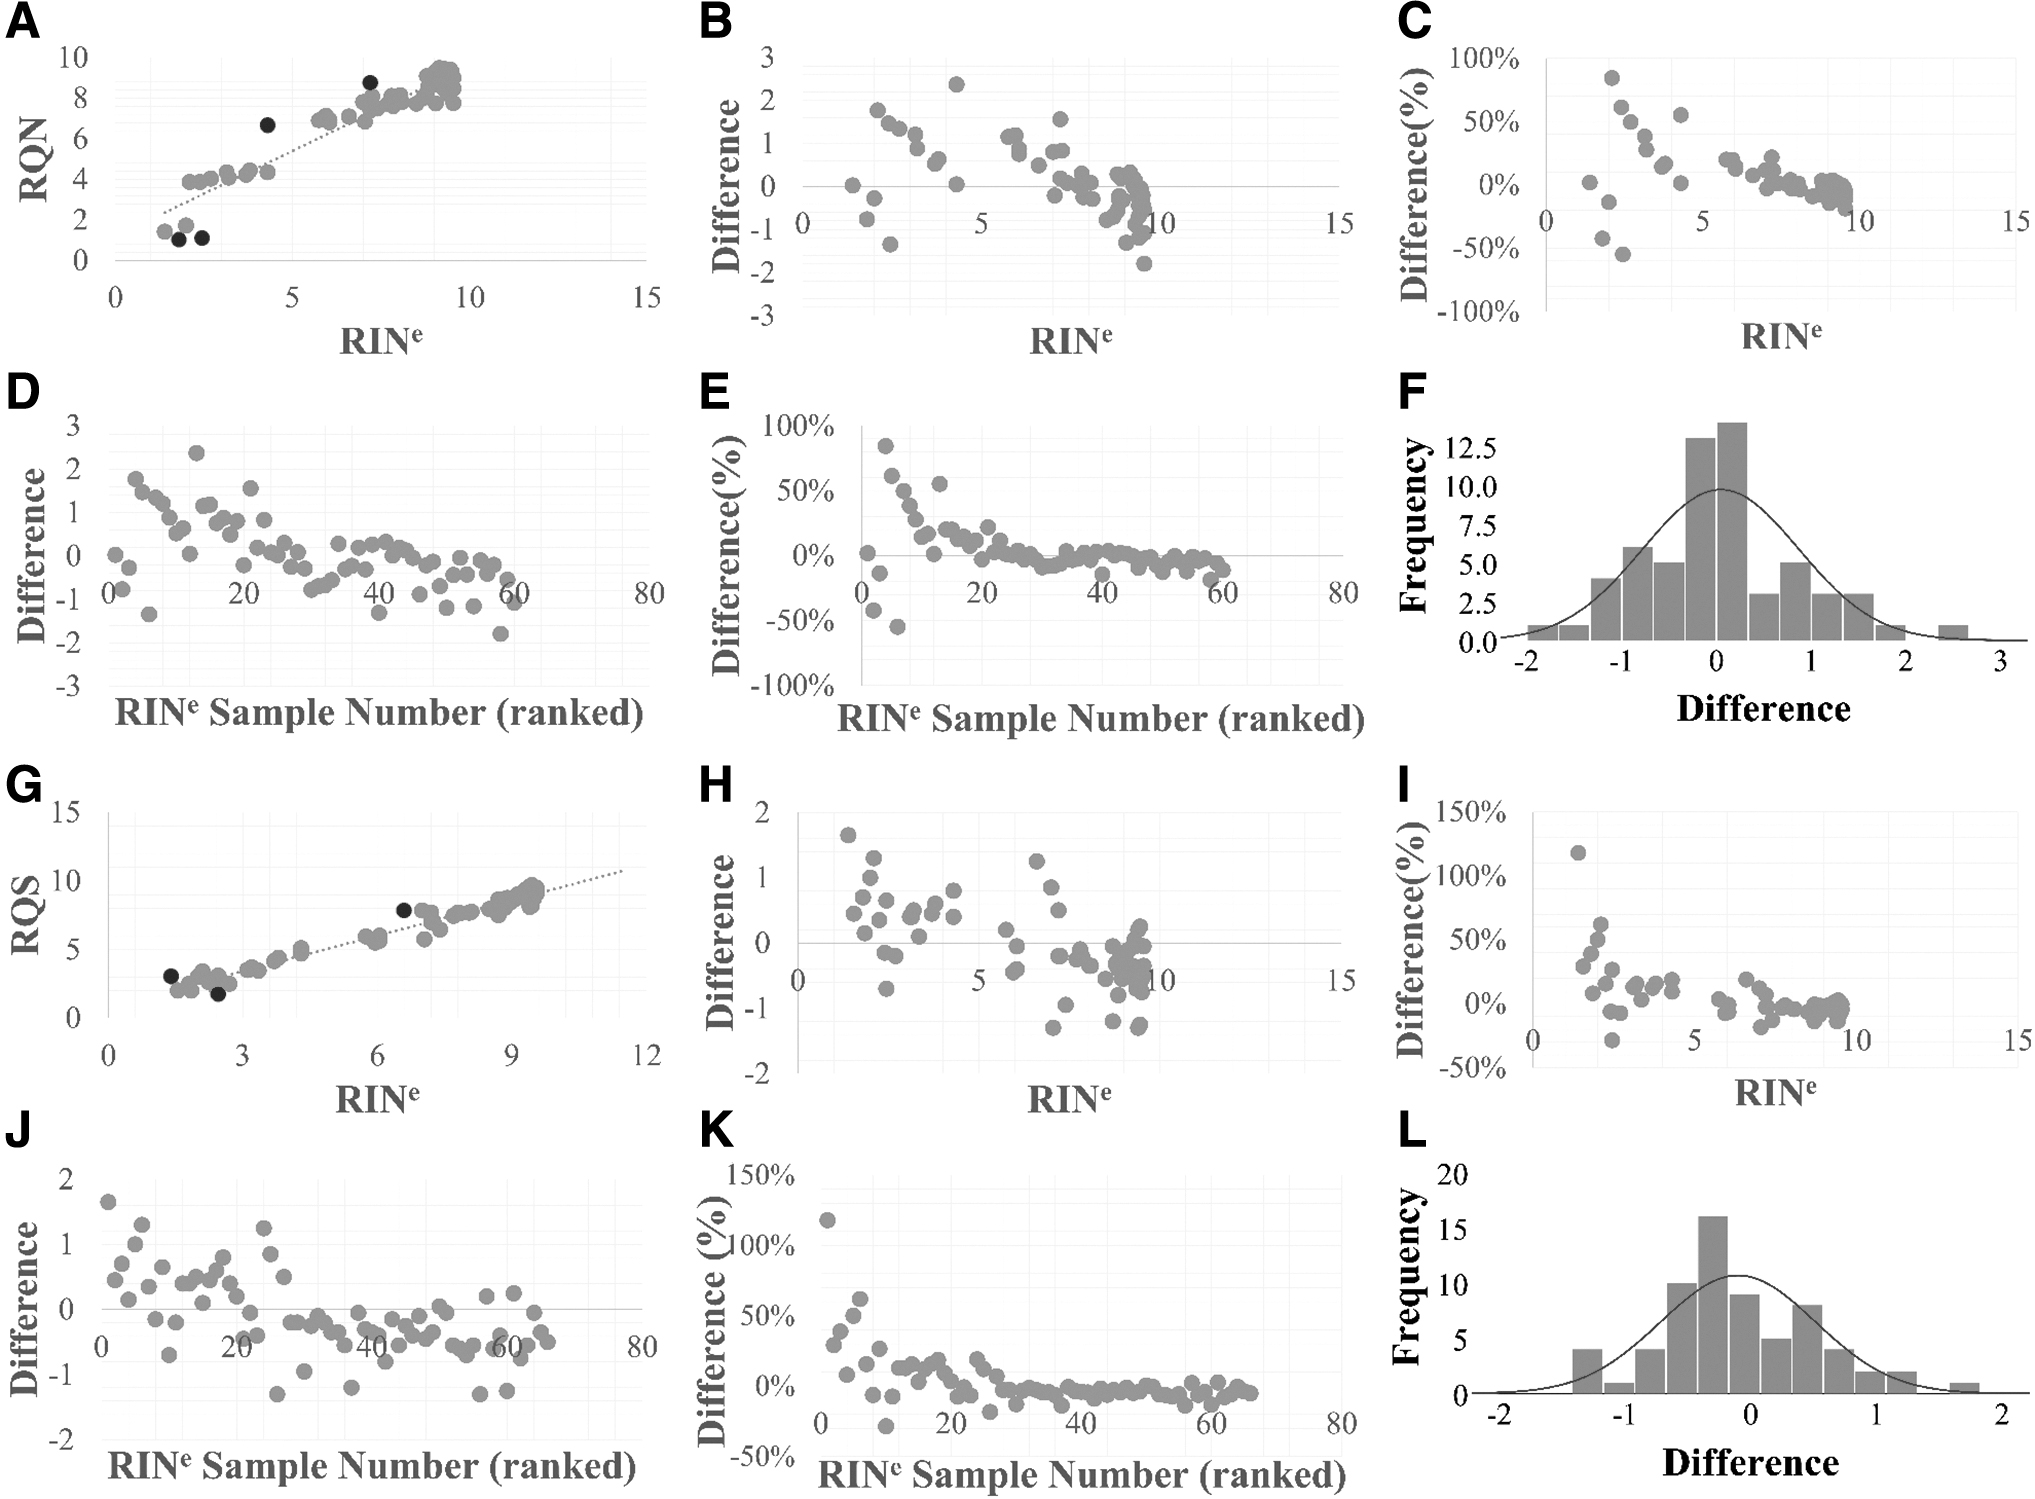
The comparison of RQN, RQS, and RINe.
The RNA measurement data were not equally distributed in the deviation plot of the difference between RQN and RINe (Fig. 2B, C), RQS and RINe (Fig. 1H, I). The ranking deviation plot illustrated that the differences between methods were mixed (constant SD and constant CV) (Fig. 2D, E, J–K). Therefore, the Deming and Passing–Bablok models were both suitable for regression analysis of RQN and RINe, RQS, and RINe.
The difference frequency histogram of the measurement samples for RQN and RINe generally illustrated a normal distribution (Fig. 2F), as well as RQS and RINe (Fig. 2L). Thus, the mean value was used as an estimate of the bias between the methods, which was 4.38%, within the range of the clinically acceptable criteria between RQN and RINe, and 10.23%, which was out of the clinically acceptable criteria between RQS and RINe.
According to the previous analyses, the Deming and Passing–Bablok models were used for regression analysis of RQN and RINe. The regression equations were fitted as y = 0.7318 + 0.9052x and y = 1.3498 + 0.8308x. The 95% CI of slope was 0.7715–1.0389 including 1 and 0.7425–0.9509 without including 1, and the 95% CI of intercept was −0.3411 to 1.8047 including 0 and 0.2615–2.0476 without including 0. The bias was within acceptable criteria (Table 3). Similarly, the Deming and Passing–Bablok models were used for regression analysis of RQS and RINe, and the regression equations were fitted as y = 0.8018 + 0.8674x and y = 0.6189 + 0.8897x. The 95% CI of slope was 0.8237–0.9111 and 0.8460–0.9400, both without including 1, and the 95% CI of intercept was −0.4536 to 1.1499 and 0.2296–0.9642, both without including 0. The bias was within acceptable criteria (Table 4).
Bias of Different Regression Models at the Medical Decision Level When Comparing RNA Quality Number with RNA Integrity Numbere
Bias of Different Regression Models at the Medical Decision Level When Comparing RNA Quality Score with RNA Integrity Numbere
Discussion
At present, the continuous development of biotechnology and the demand for high-quality biomaterials are inseparable from standardized quality control, and automated nucleic acid analysis is one of the important approaches.11–13 This study focused on several nucleic acid integrity assay systems commonly used in the market, and selected the Agilent 4200 TapeStation as a reference method. BIOptic Qsep400, PerkinElmer Labchip GX Touch HT were used as the methods to be evaluated in the comparisons.
According to the requirements of CLSI EP09-A3, we have carried out a comparative analysis of the results obtained by several assay systems. First, the scatterplots between the methods were drawn, and combined with the visual inspection method. No outliers were found in all the valid sample results by the ESD method. Further visual analysis of deviation plots, ranking deviation plots, and frequency histograms were used, whereas there was a problem of low accuracy and applicability by using the mean or median to estimate bias between methods. It is generally necessary to confirm a suitable regression equation for analysis.
Deming and Passing–Bablok regression analyses were used for comparison between DQN and DIN. Deming regression analysis sometimes could not eliminate the influence of large differences (Passing–Bablok regression analysis was used as the main reference). According to the Passing–Bablok regression equation, the 95% CI of the slope included 1, the 95% CI of the intercept included 0, and the relative bias at the medical level was within the clinically acceptable criteria of ±7.5%. For the comparison of DQS and DIN, Deming regression analysis was used. The 95% CI of the slope included 1 and the 95% CI of the intercept included 0, the relative bias was within the clinically acceptable criteria. Generally, the 95% CI of the slope includes 1 and the 95% CI of the intercept includes 0.
The relative bias is within the clinically acceptable criteria, which means that the regression analysis results have a good linear correlation and comparability. Although the bias of the mean estimated between DQN and DIN, DQS and DIN, were both out of the acceptable criteria, their bias was smaller between DQN and DIN at mean estimation or medical decision level. There was a good linear correlation and comparability between the methods. However, it is necessary to pay attention to the larger bias between DQS and DIN, when measuring DNA integrity. It needs to be emphasized the DQS was multiplied by 2 as the measurement result for consistent scope of analysis. The analysis results were only used as a reference for the application process in the measurement procedure comparison of DNA. In the end, it was necessary to return to the original score of the system.
For the comparison of RQN and RINe, Deming regression analysis showed that 95% CI of the slope included 1 and the 95% CI of the intercept included 0, the relative bias at the medical level was within the clinically acceptable criteria. Passing–Bablok regression analysis showed that 95% CI of the slope did not include 1 and the 95% CI of the intercept did not include 0, the relative and the bias at the medical level was within the clinically acceptable criteria. Both methods were comparable, but the insufficient linear correlation between methods deserves to be paid sufficient attention.
Deming and Passing–Bablok regression analyses between RQS and RINe revealed 95% CI of the slope did not include 1 and the 95% CI of the intercept did not include 0, and the relative bias at the medical level was within the clinically acceptable criteria. This was the same result as the comparison between RQN and RINe methods, with the insufficient linear correlation between the methods deserved to be paid sufficient attention despite being comparable. Combined with the biases of the mean estimated between methods, bias between RQN and RINe was smaller and within the clinically acceptable range. In addition to linear correlations, there was a larger bias to be concerned with when replacing RINe with ROS.
Conclusions
In summary, there was good comparability of nucleic acid integrity detection, when comparing BIOptic Qsep400, PerkinElmer Labchip GX Touch HT to the Agilent 4200 TapeStation. The larger bias should be taken into account for the PerkinElmer Labchip GX Touch HT in measuring DNA, as well as the BIOptic Qsep400 and PerkinElmer Labchip GX Touch HT should be used with caution in measuring RNA because of the insufficient linear correlation. In addition, due to the limitations of nucleic acid samples, clinical data can be accumulated to meet the uniform distribution of the interval from 1 to 10, so as to obtain more reasonable comparison results.
Footnotes
Authors' Contributions
Q.C., X.L., and X.Z. designed the experiments and modified the article. X.L., J.S., and Y.W. performed most of the experiments. Y.W. helped in data organization. W.L., Y.C., F.L., L.Z., and Y.W. collected the samples. Q.C., X.L., and B.X. analyzed the data. X.L. and Q.C. wrote the article. Q.C. obtained the funding. All the authors contributed to the revision of the article and gave approval before submission.
Author Disclosure Statement
The authors declare that they have no conflicts of interest. This research is supported by companies of Agilent 4200 TapeStation, BIOptic Qsep400, and PerkinElmer Labchip GX Touch HT, and may lead to potential competitive conflicts between products. We have fully disclosed these interests and any potential conflicts to each company, and gain full understanding of them.
Funding Information
This study was supported by the State Key Laboratory of Dampness Syndrome of Chinese Medicine Project (SZ2021ZZ27) and the Hospital Project of Science and Technology of Traditional Chinese Medicine (2018KT1731).

References
Supplementary Material
Please find the following supplemental material available below.
For Open Access articles published under a Creative Commons License, all supplemental material carries the same license as the article it is associated with.
For non-Open Access articles published, all supplemental material carries a non-exclusive license, and permission requests for re-use of supplemental material or any part of supplemental material shall be sent directly to the copyright owner as specified in the copyright notice associated with the article.
