
Abstract
With the number of samples increasing in many biobanks, one of the most pressing tasks is recording the correct relationships between information and the specimens. Genomic information is useful in determining the identity of these specimens. The Tohoku Medical Megabank Organization is running one of the largest biobanks in Japan. Here, we introduce a management system, which includes the development of a new probe set for the MassARRAY system for use during the production of proliferating T cells (T cells) and lymphoblastoid cell lines (LCLs). We selected single nucleotide variants that could be detected by next-generation sequencing and showed high resolution with ∼0.5 minor allele frequencies. After checking the set of probes against 96 samples from 48 people, we obtained no contradictory results in comparison with our genome sequence information. When we applied the set to our 3035 LCLs and 2256 T cells, the result showed 98.93% consistency with the corresponding genomic information. We surveyed the handling records of the 1.07% of samples that showed inconsistencies, and found that most had resulted from human errors (ID swapping between samples) during manual operations. After improving a few error-prone protocols, the error rate dropped to 0.47% for LCLs and 0% for T cells. Overall, the system that we developed shows high accuracy with easy and fast operability, and provides a good opportunity to improve the validation procedure to facilitate high-quality banking, especially in cases involving genomic information.
Introduction
In the field of next-generation medicine, biobanks are becoming increasingly important in supplying large numbers of human samples and data for advanced research analysis. Biobanks collect and store large numbers of samples and health and genomic information derived from cohort participants, and then make them available for various studies, such as those for deciphering causes of diseases or for finding treatments by comparing healthy and disease samples.1,2
Sample swaps and/or misidentification based on donor information directly affect the quality of research results. To avoid human errors that result from sample swaps and/or data misidentification, most biobanks manage samples with barcodes, have automated many of their sample-processing steps, and have introduced a Laboratory Information Management System (LIMS) to record the timestamps of each step, and the correct relationships between samples and their associated data. However, even with these levels of care, it is impossible to completely eliminate human errors, resulting in a few inconsistencies between samples and genomic information in biobanks. For example, the Vanderbilt biobank found sample handling error rates of 0.3%, while those in the U.K.-Biobank and ENCODE were suggested to be ∼1%.3–6
Tohoku Medical Megabank Organization (ToMMo) is currently running the Tohoku Medical Megabank Project (TMM) cohort, which is one of the largest population-based cohorts for prospective studies in Japan. The TMM biobank has collected and stored millions of biological samples and health data from >150,000 volunteers, and has made the samples available for various studies.7,8 One unique characteristic of our biobank is that it contains thousands of Epstein‒Barr virus (EBV)-transformed lymphoblastoid cell lines (LCLs) and proliferating T cells (T cells) with whole-genome sequencing (WGS) information.9–11
During the production of the LCLs and T cells, several manual steps are unavoidable. For example, long-term cell culture (average of 1 month for LCLs and 1 week for T cells) and manual passage are needed; however, the growth rates of these cells are not constant, and we need to check the conditions of the cells under a microscope to determine the proper timing of each passage. Because such steps could cause sample swapping and result in mislabeling, these culture samples need to be validated before they are distributed to researchers.
Here, we report the construction of a validation system to test the concordance between samples and preanalyzed genomic information based on the MassARRAY system (Agena Bioscience).12,13 Before the introduction of the MassARRAY system to our pipeline, we used sex and ABO blood typing 14 or the short tandem repeat (STR)15–17 method to correctly identify the samples in question. However, sex and ABO blood typing methods are limited in their ability to distinguish between samples due to a lack of detailed classification power.
The use of STR profiling has been discussed and recommended for authenticating human cell lines, and many laboratories have adopted it to identify them.15–17 Initially, we also have used the STR profiling to check the match between DNA from buffy coats used for WGS and from cell samples.
Although this method is a powerful tool, the results of STR data cannot be readily compared against short-read whole-genome data or SNP array data, because SNP array produces no information for STR and the repetitive sequence is one of the weak regions for next-generation sequencing (NGS) analysis. Therefore, to provide researchers with cell samples that match the analysis results of the genomic information in the TMM Biobank, we decided to introduce a new system that can directly and easily compare the analyzed genotyping data of cell-derived DNA with previously obtained next-generation sequence data.
The MassARRAY is an automated all-in-one platform, which uses a matrix-assisted laser desorption/ionization–time-of-flight mass spectrometry (MALDI-TOF MS) system to identify dozens of single nucleotide variant (SNV) sites simultaneously by detecting differences in the masses of polymerase chain reaction (PCR) products amplified in multiplex PCR. Based on our WGS dataset of the Japanese population, among SNVs that were constantly detected in the NGS analysis, we selected a set of candidate SNVs that could be used to verify sample identity with high resolution.
After validating the sets of probes for the MassARRAY analysis of these candidate SNVs, we applied the MassARRAY assay system to obtain the SNV information of available cell samples (LCLs and T cells) that we had constructed and compared the results with their registered WGS information. 18 Some inconsistencies between the newly generated SNV information of the samples and the preanalyzed WGS information, possibly caused by sample swapping, were found in the verification step.
To avoid further errors, we reviewed the protocol for handling the cell samples using timestamp data recorded in the LIMS and improved it, which resulted in a significant reduction in the rate of mislabeling. Thus, the MassARRAY system described in this article is effective in confirming the correspondence of samples with preanalyzed genomic information and is useful for improving the quality of biobank-managed samples. We now routinely apply the system to ensure the quality of our culture samples.
Materials and Methods
Preparation of EBV-transformed LCLs and stimulated T cells (T cells)
The establishment of cell samples was described in previous publications.9–11
The cell numbers of LCLs and T cells were determined using disposable Improved Neubauer hemocytometers, and a total of 1 × 10⁶ cells from each sample were used for DNA extraction.
DNA isolation from buffy coat and cell samples
Genomic DNA was isolated from frozen buffy coats of peripheral blood, LCLs, or T cells either by Autopure LS or by QIAsymphony (QIAGEN). Isolated DNA was suspended in Tris-EDTA buffer (10 mM Tris, 1 mM EDTA), and the original concentrations of buffy coat, LCLs, and T cells (the first 470 cell samples) derived DNAs were measured using PicoGreen dye in a Quant-iT PicoGreen dsDNA Assay kit (Thermo Fisher Scientific) and stored at 4°C.
Cell sample-derived DNA (188-sample) whose concentrations were measured using both the PicoGreen dye and NanoDrop 2000 (Thermo Fisher Scientific) were assessed for their genotypes using the MassARRAY to confirm that there was no difference in the results regardless of the measurement method for DNA concentration. Therefore, all the rest of genomic DNA from LCLs and T cells (biological replicates for each cell type) was also quantified using NanoDrop 2000, NanoDrop 8000 (Thermo Fisher Scientific), or Lunatic (Unchained Labs) spectrophotometer alone and used for the MassARRAY analyses.
MassARRAY-based analysis
Allele variants of each sample were analyzed using MassARRAY technology (Agena Bioscience) according to the manufacturer's instructions. 19 In brief, ∼6–10 ng of DNA was used for multiplex PCR. PCR products containing SNVs were treated with shrimp alkaline phosphatase (SAP), and then extended one base into the SNV site. After preparation, we used MassARRAY (RS-1000 Nanodispenser or Chip prep module) to analyze the products (Fig. 1B).
Study workflow.
To validate the set of MassARRAY probes developed for the project, the DNA from 96 buffy coat samples of 48 individuals was used. Using the validated probe set, the cell samples (3035 LCLs and 2256 T cells; biological replicates) stored in the TMM biobank were subjected to MassARRAY analysis.
Comparison between MassARRAY results and WGS data
The MassARRAY results, which passed the quality control thresholds of Agena software (MassARRAY TyperAnalyzer 4), were compared with the existing WGS data derived from the same participants' blood samples. 20 The variant information for each of the 37 MassARRAY probes was categorized into 3 states: consistent, in which the variant information was identical between the MassARRAY and WGS analyses; inconsistent, in which the variant information was different between the MassARRAY and WGS analyses; and NA, in which the variant information from either the MassARRAY or WGS analysis was not available.
The LIMS and ID error check
The LIMS in the TMM biobank was previously described. 9
After comparing the allele variant results from MassARRAY and WGS, inconsistent samples were selected to determine the cause of misidentification. Then, we checked for the LIMS information, such as the deidentified participant ID, storage tube ID, staff ID, and timestamp of each procedure, of the cell samples.
Results
Design and performance of MassARRAY analysis
To select effective SNV targets for the MassARRAY system for Japanese individuals, we first obtained the Japanese population reference panel (1KJPN) data, which included SNV frequency information for 1070 Japanese people. 18 We selected SNVs that were detected in all 1070 people by a HiSeq 2500 (Illumina). Among them, the SNVs with a high detection rate with the Japonica array, which contains 650,000 SNVs based on our customized Axiom array system for easily detecting genome variations, 21 were chosen.
In addition, Abecasis's laboratory provided the SNV data of 5710 markers distributed ∼1 per 500 kb across the autosomes and the X chromosome for identification (for more details, see https://genome.sph.umich.edu/wiki/Exome_Chip_Design#Scaffold_for_Identity_by_Descent) (IBD SNPs). These SNVs show little differentiation between African, European, and Asian ancestry groups sequenced by the 1000 Genomes Project, 22 and the allele frequencies are ∼0.50. In addition, the allele frequencies are within the range of 0.5 ± 0.03 in our updated NGS data from >3000 samples (Supplementary Table S1; ToMMo 38KJPN).
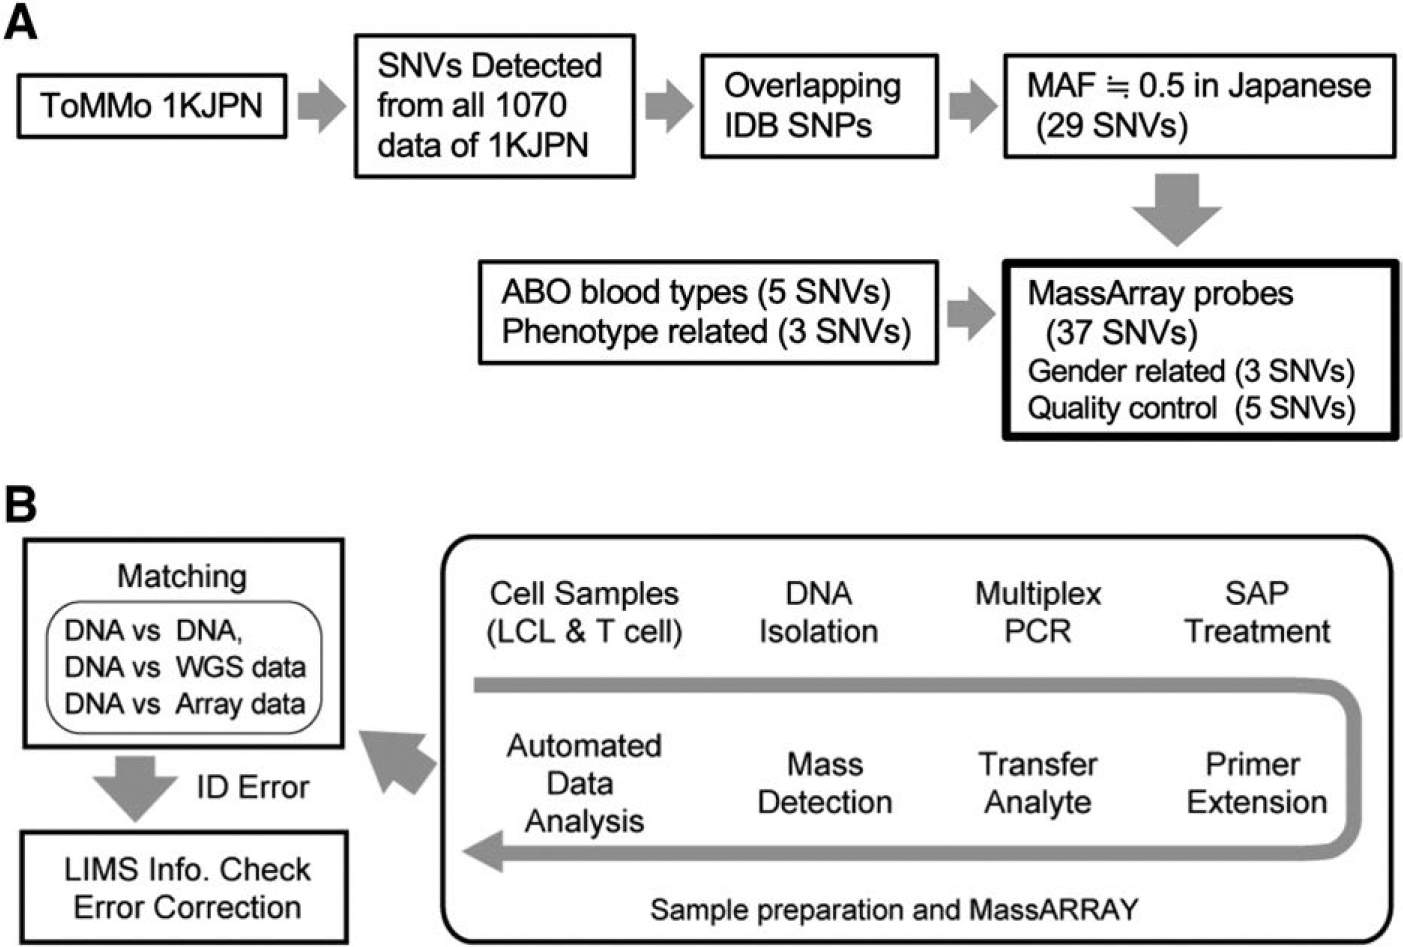
To take advantage of these SNV selections, we downloaded data from the ftp site (ftp://share.sph.umich.edu/exomeChip/ProposedContent/Grid). After merging the 1KJPN SNVs and Abecasis's SNVs, we selected the overlapping SNVs. We then selected SNVs with minor allele frequencies (MAFs) ∼0.5. We selected 29 SNVs to evaluate the concordance between MassARRAY and the genomic information.
We also integrated five ABO blood type-related and three phenotype-related SNVs into a MassARRAY probe set with three sex-related and five quality control SNVs provided by Agena Bioscience (Fig. 1A). The final list of selected SNVs is provided in Supplementary Table S1. After the target SNVs selection was done by ToMMo as described above, the custom panel design service provided by Agena was used to design multiplex PCR primer sets and detection probes.
The procedure for sample confirmation using the MassARRAY system 18 is summarized in Figure 1B. Essentially, multiplex PCR is employed to amplify the regions of the genome containing each SNV from the cell samples (LCL and T cell). PCR products are treated with SAP to remove unincorporated nucleotides. A reaction is then performed on the PCR fragments to extend them by one base into the SNV site. The mass of the resultant extended fragments is then measured using MALDI-TOF, yielding a distinctive mass spectrum for the multiplex reaction.
The MassARRAY results, which passed the quality control thresholds of Agena software, were compared with the existing MassARRAY, WGS, or array data derived from the same participants' blood samples.19,21 After comparing the allele variant results of MassARRAY and WGS, inconsistent samples were selected for further analysis to determine the cause of misidentification. Then, we checked the LIMS information, such as deidentified participant ID, storage tube ID, staff ID, and timestamp, of the cell samples for each procedure.
Testing the MassARRAY probes with buffy coat sample pairs from 48 individuals
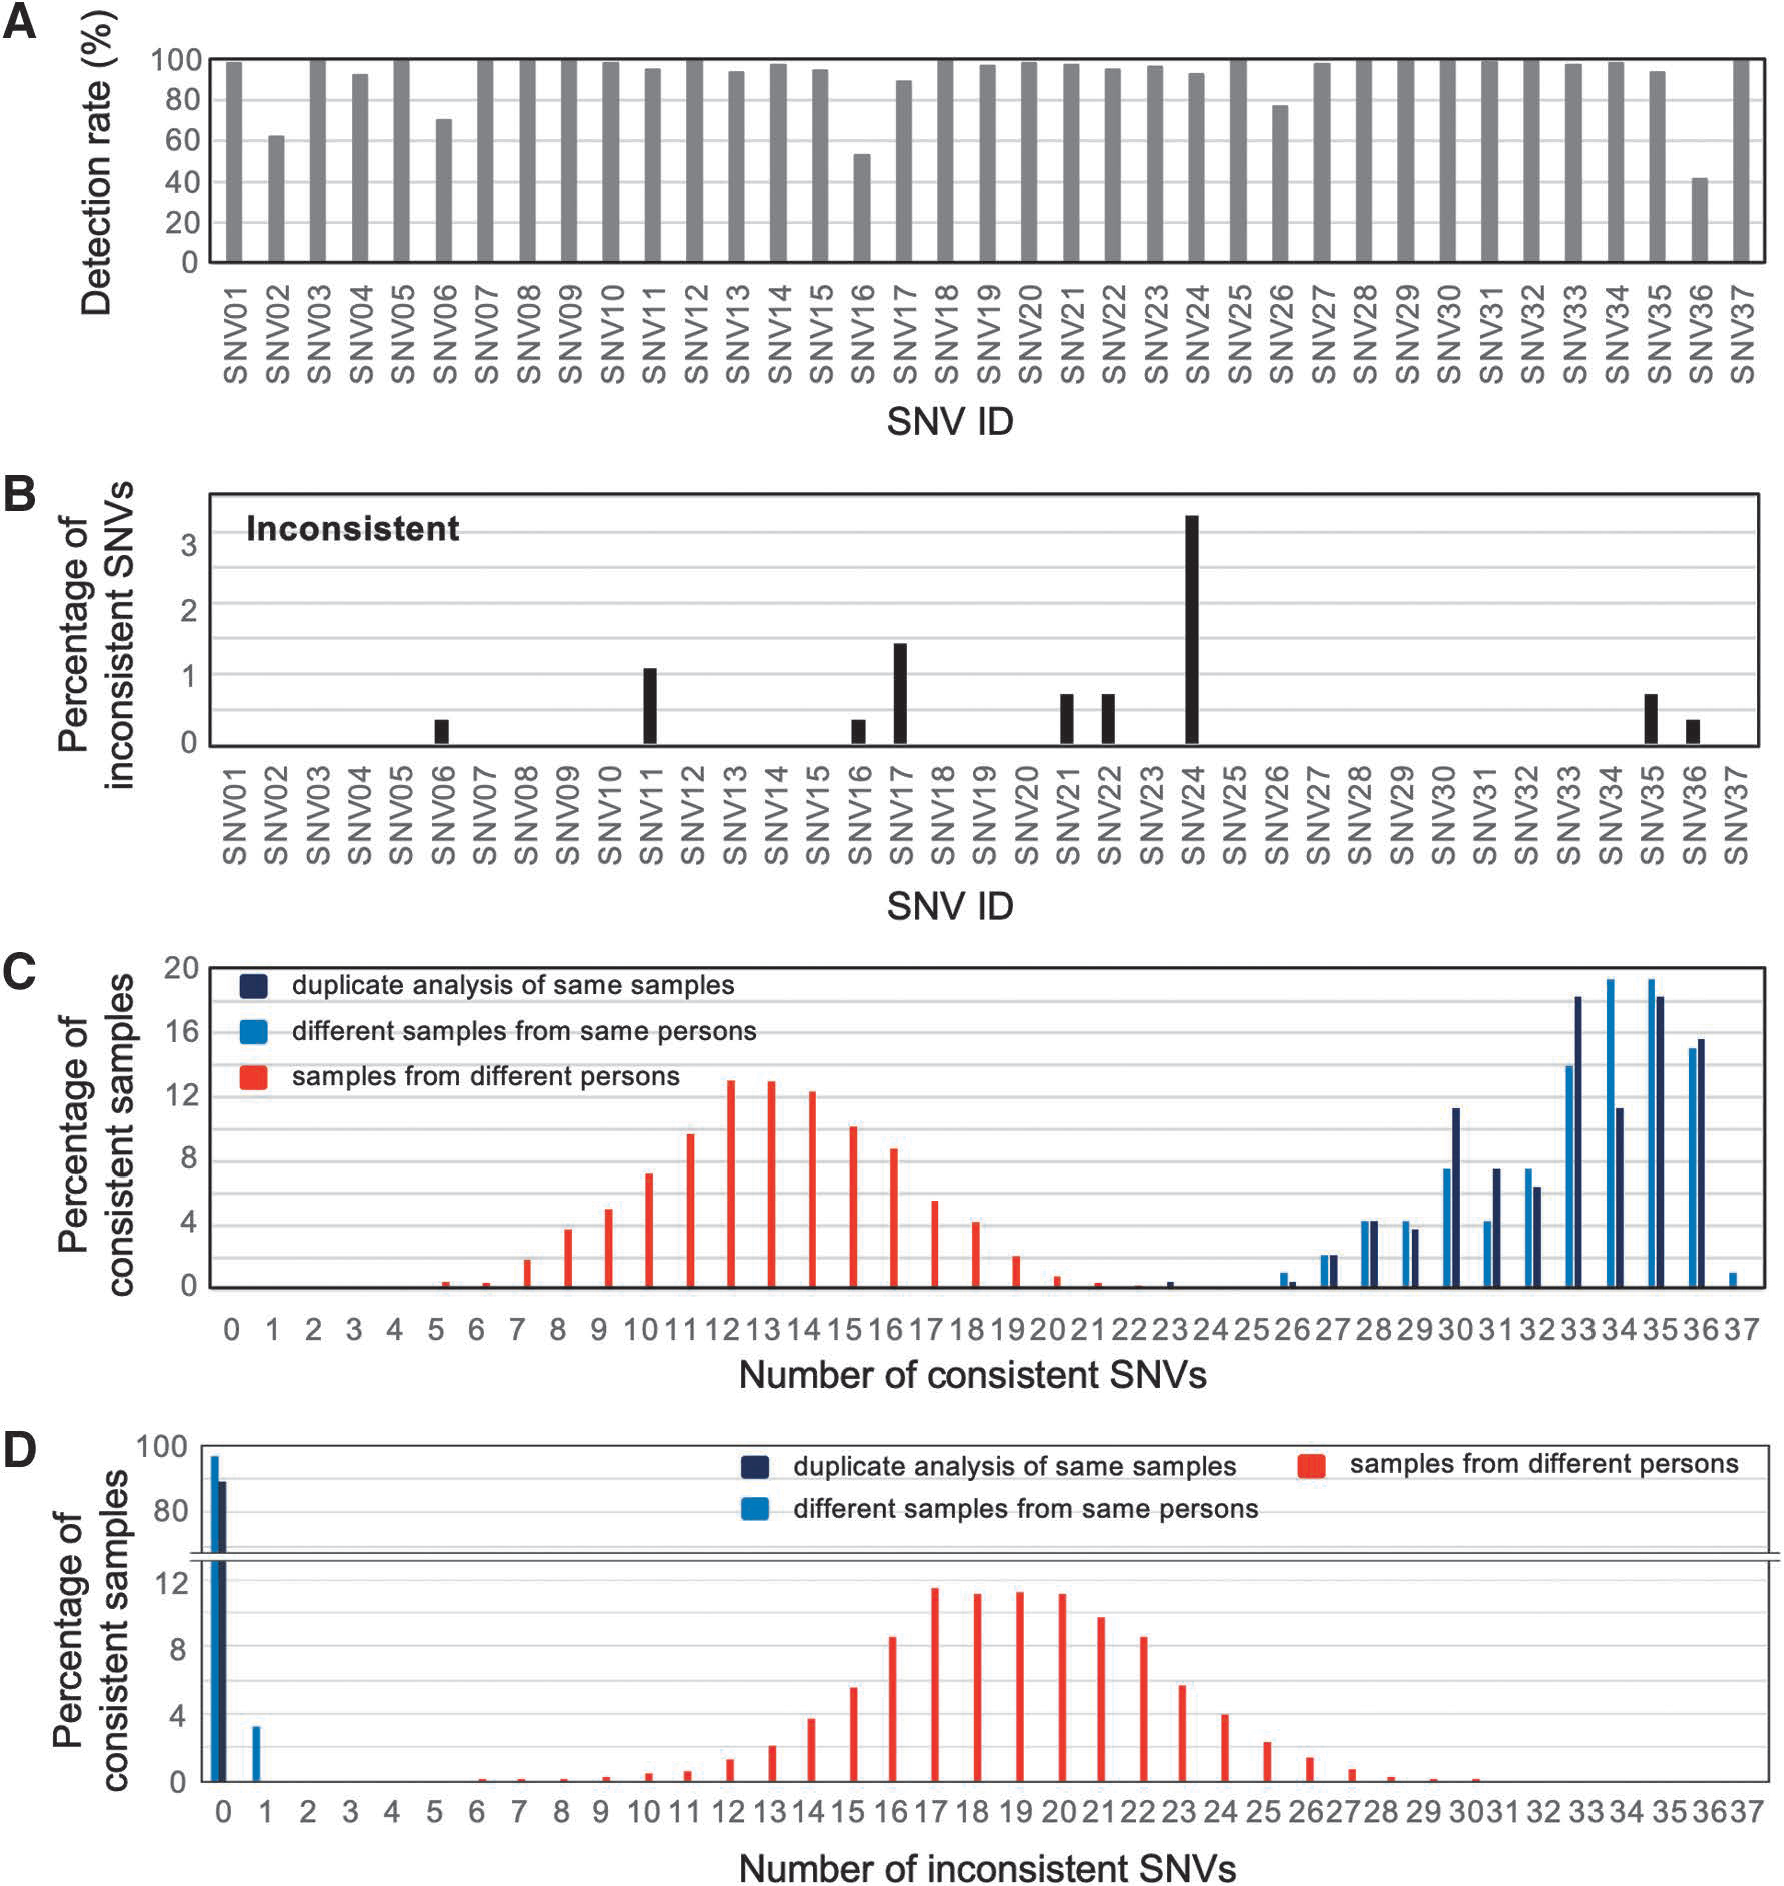
To verify the power of the MassARRAY system combined with our custom probe set for 37 SNVs, we first applied it to a total of 96 DNAs derived from 48 individuals' buffy coat sample pairs, the results of which confirmed the identities of all 48 pairs. Most of the custom probes (with the exception of only SNV02, SNV06, SNV16, SNV26, and SNV36) showed a >80% detection rate with the MassARRAY system (Fig. 2A). Even though there were some undetectable SNVs, we detected an average of 34 SNVs.
Evaluation of MassARRAY probes.
When comparing sample pairs from the same individual, each probe showed high consistency. Among them, SNV24 showed the highest with a <3.5% inconsistency rate (Fig. 2B). Based on the detected SNV information, we observed a clear discrimination between the sample distributions of identical and nonidentical pairs in terms of both consistent and inconsistent SNV numbers (Fig. 2C, D). In cases where samples from the same individual were compared, the number of inconsistent SNVs was two or less, while other comparisons yielded six or more inconsistent SNVs (Fig. 2D).
Considering that a few SNPs might fail to detect in MassARRAY analysis, the pattern of inconsistent SNVs in Figure 2D was consistent with the result of the comparisons of WGS genotype between different samples in 1KJPN (Supplementary Table S2), in which the minimum number of inconsistent SNVs was seven.
Therefore, we conclude that our system can identify DNA samples from the same individual, and adequately distinguish DNA samples from different individuals.
Application of the MassARRAY system to the constructed LCLs and T cells
To test the practicability of the MassARRAY system, we used it to compare our cell samples with the WGS data. In our biobank, we produce EBV-transformed LCLs and CD28/CD3-stimulated T cells from participants. 9 During the establishment of the LCLs and T cells, several manual steps that can cause sample swapping and result in mislabeling are unavoidable.
The buffy coat-derived genomic information determined by HiSeq 2500 is also available for all of the participants from whom the cells originated. Therefore, in February 2018, we started preparing frozen samples for MassARRAY while establishing cell samples and investigated their misidentification through March 2019. To validate the correspondence between genomic information and the actual cells, we tested the SNVs of the then available cell samples (1916 LCLs and 1825 stimulated T cells; established and stored between February 2018 and March 2019) with our MassARRAY system.
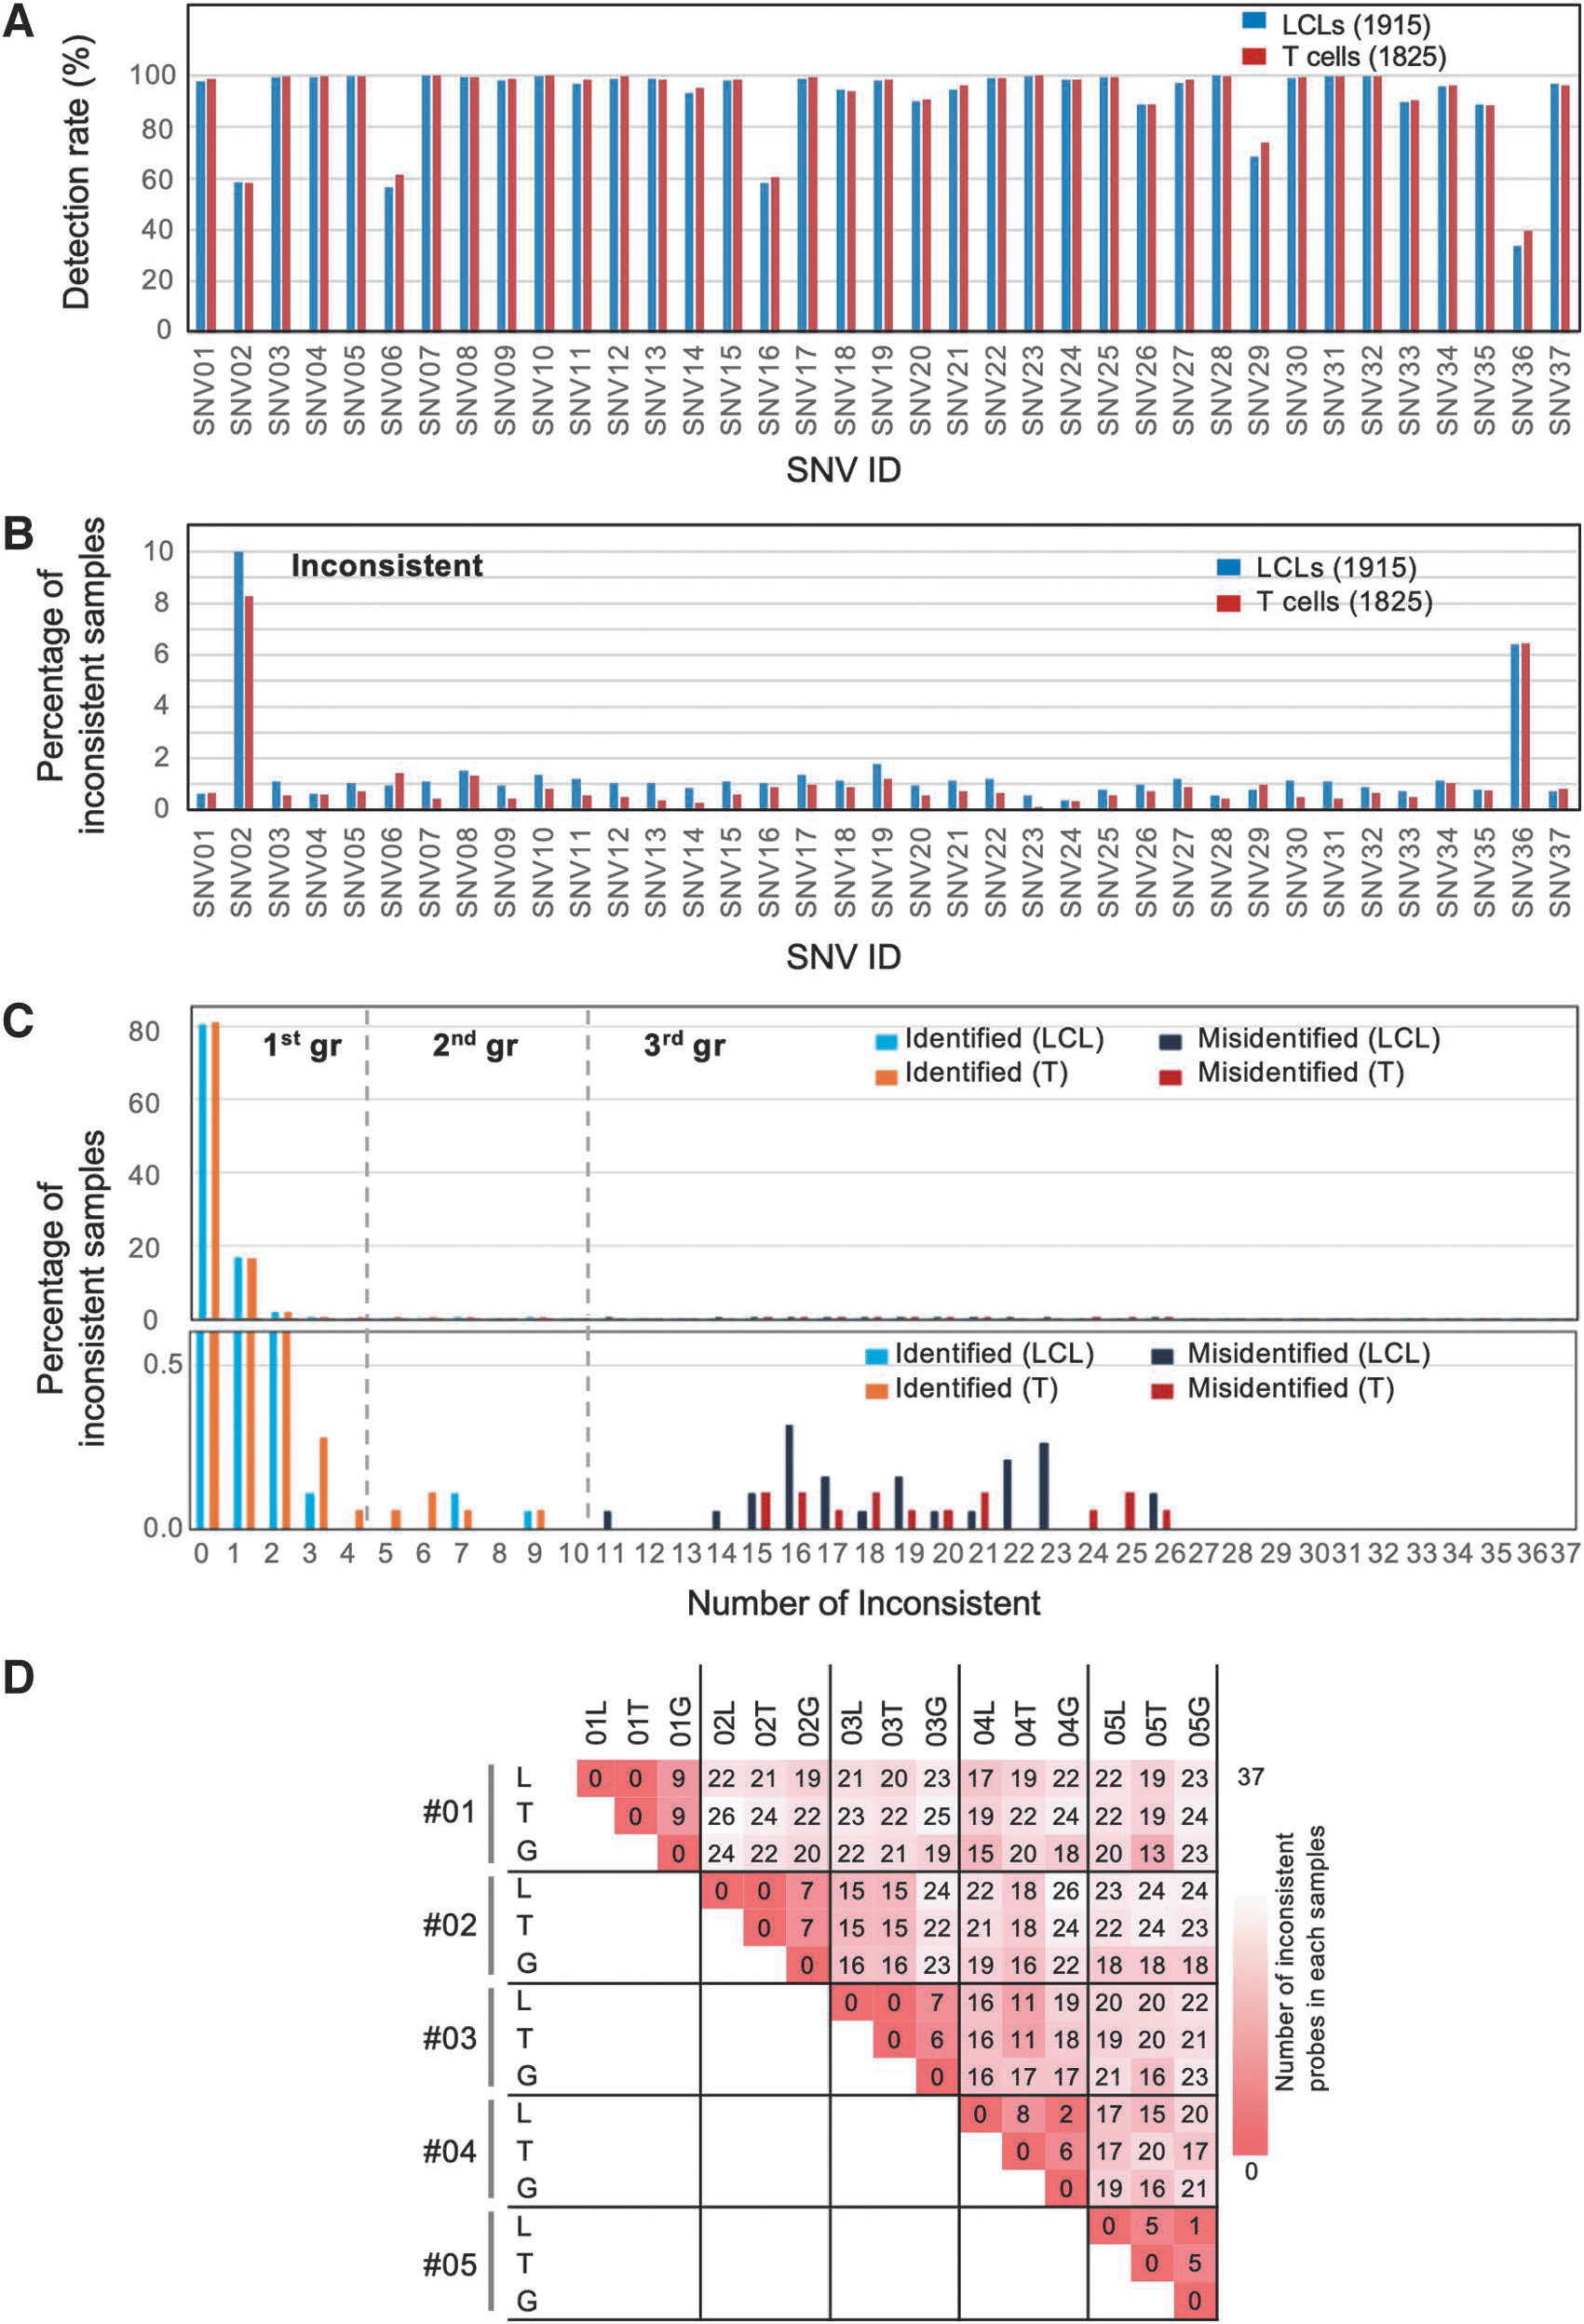
We found that five SNVs showed low detection rates (Fig. 3A), as observed in the experiments depicted in Figure 2A: 58.4% (SNV02), 59.2% (SNV06), 59.5% (SNV16), 71.3% (SNV29), and 36.9% (SNV36). Although these five SNVs showed detection rates <80%, the other 28 SNVs had detection rates of >95% (Fig. 3A). We also found that two SNVs showed relatively high disagreement (8.8% for SNV02 and 6.4% for SNV36) between the MassARRAY results and the NGS results from the cells and the WGS data (Fig. 3B). We recognized ∼1% inconsistencies for most of the SNVs, mostly arising due to misidentification (Supplementary Fig. S1). Although there were some inconsistencies, we routinely detected 30 SNVs. Therefore, we conclude that our probe set is adequate for managing the identities of the cells.
MassARRAY analysis of our cell samples. We applied MassARRAY analysis to our 1915 LCLs and 1825 T cells. Then, we compared the results with preanalyzed WGS information.
Using the validated probe set described above, we next sought to determine the IDs of the cell samples (1916 LCLs and 1825 T cells) by comparing the MassARRAY data of the cell samples against the corresponding genomic information of the participants. Figure 3C shows a histogram indicating the number of inconsistent SNVs in each sample against the corresponding WGS data. We categorized the samples into three groups, one consisting of <5 inconsistent SNVs, another consisting of between 5 and 10, and a third containing ≥11.
The samples in the first class showed high consistency between the MassARRAY results and corresponding WGS data, indicating that these samples were treated properly. On the contrary, the samples in the third class show high inconsistency and seemed to have another matching pair in the 4.7KJPN data, which was suspected to be the result of human error. The second class samples were enigmatic; they showed relatively high levels of inconsistency (5–10 SNVs) but the best matches to their corresponding IDs among the compared WGS data.
To clarify the reasons for the contradiction within the second group, we next compared the genotype data among the MassARRAY results of the LCLs and T cells and the corresponding genomic information (Fig. 3D). Although the combinations for cases 001–003 showed complete agreement between the two kinds of cell lines, there was disagreement between the cells and genomic information. These cases could be explained by the low quality of genomic information caused by low-quality sequences or contamination.
For cases 004–005, we observed relatively high disagreement between the LCLs and T cells but low disagreement between the genome and LCLs. Although we have not yet been able to accurately determine the cause of the discrepancies for these samples, cell contamination with different genotypes might be one of the most likely causes.
Tracing the pairs that showed high inconsistency
Because the construction of LCLs and T cells requires unavoidable manual steps, we run the LIMS to avoid human errors. We traced 29 LCLs and 15 T cells (total of 44 samples) in the third group (Fig. 3C) with the LIMS information, and found that 40 of 44 misidentified samples could be the result of sample swapping. For example, the SNV results of sample L1 corresponded not to the sample L1 genome of the buffy coat but to the sample L2 genome. In addition, the SNV results of sample L2 matched not the sample L2 genome of the buffy coat but the sample L1 genome. In these two cases, the LCLs were subcultured at the same time and preserved within an interval of 9 minutes. Therefore, we conclude that these two LCL samples were swapped at that time (Table 1).
Details of Errors Detected as Misidentification Errors by Comparing MassARRAY Allele Variant Results and Whole-Genome Sequencing Data
We checked the storage tube ID, staff ID, and timestamps recorded by the LIMS during the preparation of the misidentified samples.
L, LCL; LCL, lymphoblastoid cell line; LIMS, Laboratory Information Management System; MNCs, mononuclear cells; PB, peripheral blood; T, T cell.
As described above, a certain number of misidentified samples were detected by MassARRAY analysis in the cell samples established between February 2018 and March 2019. Therefore, we also decided to perform a 100% inspection of the MassARRAY results by reculturing the LCLs that had been cryopreserved previously (April 2015 to January 2018). Furthermore, we improved the protocol to reduce sample management errors.
To determine the human error rate in the cell sample preparation periods and to compare the data pre- and postimprovement, we increased the number of target cells, performed MassARRAY on 3035 LCLs and 2256 T cells in total throughout all of the period, and compared the results with the genomic information (NGS data). Forty-two LCLs and 15 T cells were detected as misidentified. Therefore, we conclude that the inconsistencies in 50 of the 57 samples were caused by manual operation error during the construction of these cells (Table 2).
Human Errors in the Cell Preparation Steps and Concordance with Next-Generation Sequencing Data for the DNA of Each Cell Type
Cell sample preparation period: April 2015 to March 2020. A total of 5291 cell samples (3035 LCLs and 2256 T cells) were checked using the MassARRAY and LIMS systems.
NGS, next-generation sequencing.
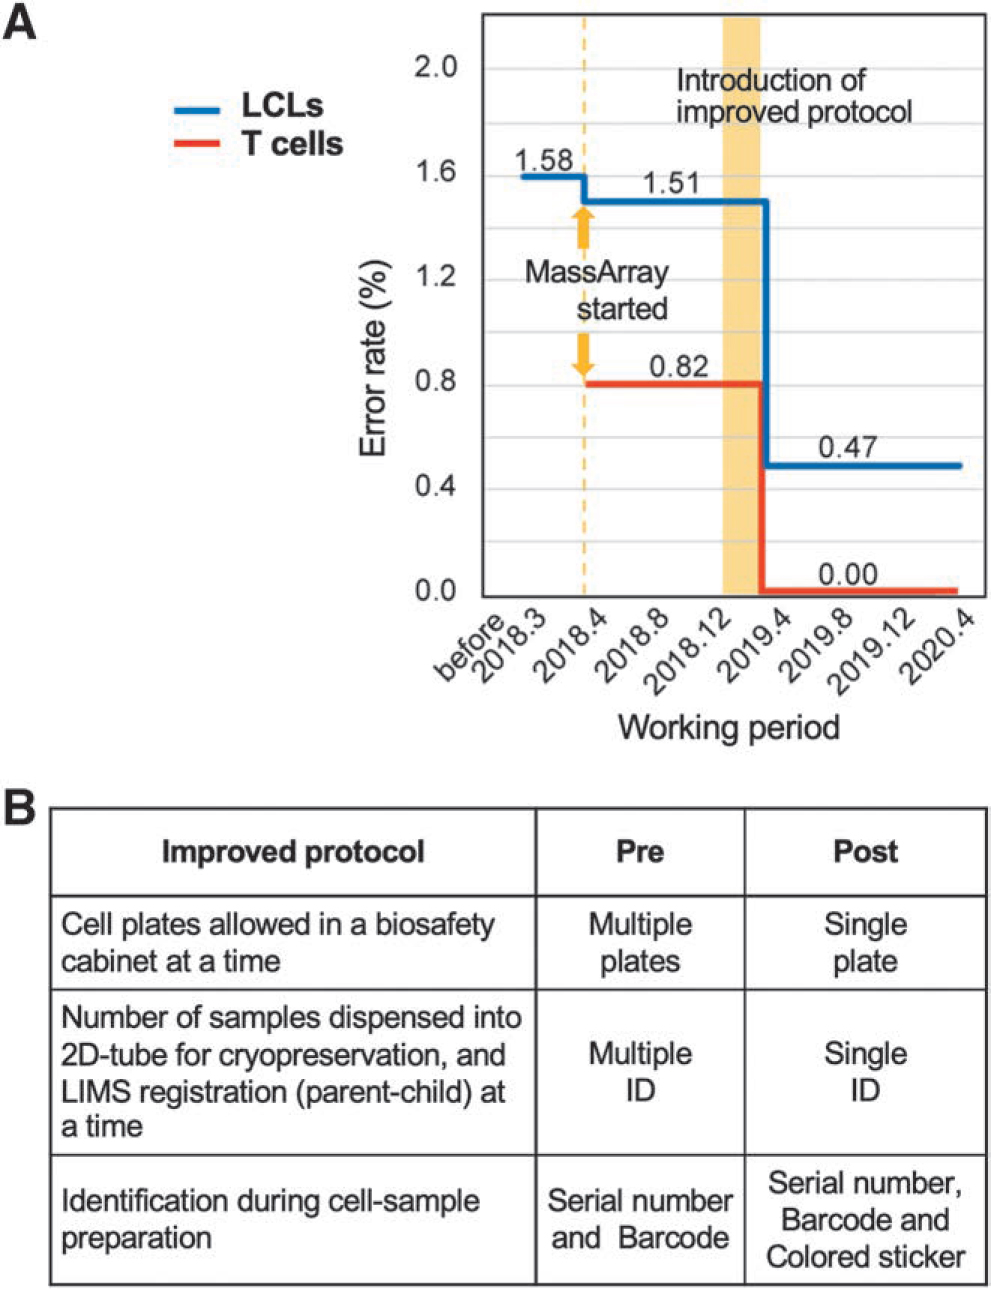
Based on the detected human errors, three manual steps were modified as follows: (1) only one plate is allowed in the biosafety cabinet at a time during the subculture steps to avoid sample swapping; (2) only one sample can be handled at a time from the time of dispensation into the 2D-coded tubes for cryopreservation through LIMS parent–child registration; (3) identification during the cell preparation steps, in addition to handwritten serial numbers and barcodes, now involves coding samples from the same ID with the same color stickers for all tubes and culture plates.
As a result of improving the protocol, the error rates for the LCLs and T cells dramatically dropped from 1.51% to 0.47% and from 0.82% to 0.0%, respectively (Fig. 4A, B and Table 2). These results indicate that biobanks can reduce human errors by implementing an improved protocol based on an effective validation system among samples.
Relationship between the working period and error rate for the establishment of LCLs and T cells.
Discussion
As the number of biobanks increases, one of their essential missions must be to keep correct records of their samples. An error in the record can not only waste time and money but also produce scientific and medical inaccuracies. However, human errors cannot be avoided, 5 and biobanks need to have a simple, rapid, reliable, and cost-effective system for validating sample identities. Consequently, we constructed a new probe set for the MassARRAY system to adapt it to the Japanese population for sample identification.
Our MassARRAY probes have several clear advantages. First, because most of the SNV targets have ∼50% MAFs, the resolution for the Japanese population is maximized. In addition, the allele frequencies are ∼50%, even in the gnomAD v3.1 SNV dataset; therefore, the probes are potentially applicable to other ethnic groups (Supplementary Table S1). Although a few probes showed low detection rates (Fig. 2A) so should logically be removed or replaced in future analyses, our MassARRAY probe set is generally sensitive and reliable (Fig. 2B–D).
Currently, the Agena iPLEX PRO sample ID panel is available and in use, 23 but we had selected our custom probe set and implemented the MassARRAY system before the panel became available. Moreover, it is relatively easy to design a new customized probe set, even for minority ethnic groups.
Second, compared with other genomic information-based methods, such as STR analysis, the MassARRAY system demonstrates excellent availability, when biobanks/laboratories have preanalyzed genomic information. The STR profiling has been recommended for authenticating human cell lines, and many laboratories have adopted it because of its accuracy, sensitivity, and inexpensiveness.15–17 Although this method is a powerful tool, the results of STR data cannot be readily compared against genomic information obtained from the genomic array analysis or the NGS analysis by short-read sequencer.
MassARRAY PCR is flexible, in that probes can be constructed to target almost all regions in the genomic sequence. The STR region is often difficult to read with short-read NGS, whereas the SNVs in our probe set are mostly NGS detectable; thus, we applied the set for identification between genomic information and samples. In addition, we applied selected SNVs to the Japonica array, which contains 650,000 SNVs based on the Axiom array system, to more easily detect genomic variations.21,24 However, the STR profiling is more useful when comparing DNA samples without genomic information than MassARRAY.
Third, because the MassARRAY system is based on PCR and MS techniques, it has potentially high sensitivity and a short detection time. In this article, ∼6–10 ng DNA from cell samples was used for the MassARRAY system. Spectrophotometry, which we used to quantify cell-derived DNA, usually overestimates the concentration, making effective quantities of DNA template used even <6–10 ng. Nevertheless, the detection rate obtained with the MassARRAY system is similar to that with buffy coat-derived DNA, confirming the high sensitivity of the system. This suggests that MassARRAY can be applied to various samples with little DNA, including plasma, serum, and urine, as well as intact cells. 19
Fourth, compared with other MS-based methods, the MassARRAY system is more convenient. Recently, multisite SNP genotyping method for Mycoplasma pneumoniae based on MALDI-TOF MS was reported. 25 Thus, it is possible to examine genotypes at multiple SNP sites using a general MALDI-TOF MS system other than the MassARRAY system. However, the MassARRAY system includes all that is required from reagent kit to dedicated genotype analysis software, making analysis easy and usable by nonspecialist users of MS systems, and is also used for detection of omicron and other SARS-CoV-2 variants. 26
Using our probe set, we detected 57 disagreements (1.07%) between 5291 cell samples (3035 LCLs and 2256 constructed T cells) and the corresponding genome information (Table 2). After checking with our LIMS, we found that 50 of the 57 errors could have been caused by sample swapping. We found that the main errors occurred at the sample-registration step for multiple samples. Therefore, we modified this step to register only one sample at a time.
After the protocol was modified, we did not encounter the same kind of human errors, and the number of inconsistencies between cells and genomic information decreased (Fig. 4A). This indicates that a combination of a sample identification system and the trial system in the LIMS is useful for identifying potentially error-prone steps in a protocol and improving the standard operating procedure. We cannot avoid manual steps in the collection of LCLs and T cells; however, we can find and correct errors with a suitable system composed of the MassARRAY system and LIMS.
In conclusion, in this study, we demonstrated that both the MassARRAY system and LIMS are essential to manage LCLs and T cell samples in the TMM biobank. Thus, the MassARRAY system can be well adapted to the management of biobank samples, and it would be especially useful in cases where genome analysis has been performed and the biobank holds participant genomic information.
Ethics statement
All relevant research protocols and procedures were approved by the Ethics Committee of Tohoku University Tohoku Medical Megabank Organization, Sendai, Japan. All adult subjects provided written informed consent.
Footnotes
Acknowledgments
We thank all members in the Tohoku Medical Megabank project group, especially E. Aoki, M. Tsuda, E. Tomita, I. Shoji, M. Sato, T. Kitaura, Y. Yamamoto, M. Kohiruimaki, K. Tada, B. Li, and the other members in the Department of Biobank for their helpful technical support.
Authors' Contributions
H.K. and N.I. contributed equally to the article. R.Y., K.K., N.I., and H.K. designed the study. R.Y., T.N., N.I., K.K., H.K., and M.Y. wrote the article. K.K. and N.M. organized the TMM biobank. N.I., T.N., and I.N. conducted the biobanking of the cell resources. H.K., S.S., and T.T. conducted the biobanking of the DNA resources. K.K. and Y.A. analyzed the MassARRAY data and genomic information. N.I. analyzed the MassARRAY data and LIMS information.
Author Disclosure Statement
No conflicting financial interests exist.
Funding Information
This work was supported by grants from the Japan Agency for Medical Research and Development (AMED; Grant No. JP21tm0124005 and JP21tm0424601), the AMED Advanced Genome Research and Bioinformatics Study to Facilitate Medical Innovation (GRIFIN) project (Grant No. JP16km0405203), and Research Support Project for Life Science and Drug Discovery (Basis for Supporting Innovative Drug Discovery and Life Science Research [BINDS]) from AMED under grant number JP22ama121019. All computational resources were provided by the Tohoku University Tohoku Medical Megabank Organization supercomputer system, which is supported by the Facilitation of R&D Platform for AMED Genome Medicine Support conducted by AMED (Grant No. JP16km0405001).
References
Supplementary Material
Please find the following supplemental material available below.
For Open Access articles published under a Creative Commons License, all supplemental material carries the same license as the article it is associated with.
For non-Open Access articles published, all supplemental material carries a non-exclusive license, and permission requests for re-use of supplemental material or any part of supplemental material shall be sent directly to the copyright owner as specified in the copyright notice associated with the article.