
Abstract
Background and Objectives:
The aim of the study was to store urine samples at different temperatures and humidity levels and analyze common biochemical test results and point-of-care testing (POCT) indicators according to different storage times and evaluate whether the samples should be centrifuged to study the best storage conditions for urine samples.
Methods:
Random midstream urine samples (100 mL) were collected from 10 healthy individuals. A portion of the samples was centrifuged. The remaining samples were not centrifuged and were stored under different temperature and humidity conditions for different periods. We measured urine indicators ([Na+], [K+], [Cl−], gamma-glutamyl transpeptidase [GGT], urea, and creatinine [Cr]) at 2, 4, 24, and 72 hours and 7 and 55 days, and we used POCT to measure myoglobin (Mb) and microalbumin (mAlb) concentrations.
Results:
Centrifugation of urine samples decreased the measured GGT and increased the measured Mb. In urine samples stored at 4°C and room temperature, electrolyte concentrations were scarcely affected by storage time. After storage at 50°C for 24 hours, the measured [Na+] and [Cl−] levels changed. Metabolites (urea and Cr) underwent no obvious change across temperatures. GGT did not change during long-term storage at 4°C. The mAlb level changed significantly only after storage at 4°C. When stored at 4°C, Mb changed little within 4 hours. Under humid conditions, [Na+] and [Cl−] increased significantly after 24 hours, and urea decreased significantly after 7 days of storage. Under dry storage conditions, urinary Cr and GGT decreased, and under humid conditions, these concentrations increased. At high humidity, mAlb increased significantly after 72 hours.
Conclusions:
Electrolyte and amino acid metabolite concentrations were less affected by storage time at 4°C and room temperature than at other temperatures. Some proteins are sensitive to environmental changes; samples collected for quantification of these proteins can be stored briefly at 4°C after centrifugation. Normal humidity conditions meet most physiological testing requirements.
Introduction
The quality of biological samples is crucial in the fields of life science and medical research. In the process of biological sample collection, processing, and storage, various environmental variables can directly affect the quality of samples, which will significantly impact subsequent scientific research. 1 Due to the noninvasive nature of urine collection and the fact that no medical supervision is needed to collect urine, research on urine samples has received increasing attention. 2 Research focusing on urine preservation is currently in its infancy, but many large-scale studies on this topic are currently being prepared and performed.
As a common medical test, the evaluation of chemical components and markers in urine is of great significance in the diagnosis and treatment of urinary, cardiovascular, endocrine, and multisystem diseases; chemical component examination is also widely used in epidemiological research.3–5 In prospective and longitudinal studies, particular attention must be paid to metabolite stability as not all analyses can be performed immediately after collection.
The stability of analytes in urine depends on many factors, such as the sample collection procedure and storage temperature.6,7 In real-world environments, urine samples for medical testing are affected by complex factors, such as high temperature, high humidity, storage time, and other factors that occur before analysis; current research on how these factors will affect urine sample biochemical test results is still unclear and insufficient.
In response to this need, the present study compared and analyzed the changes in biochemical indicators and point-of-care testing (POCT) indicators (myoglobin [Mb] and microalbumin [mAlb]) of urine samples at different storage times by simulating different temperature and humidity conditions.
In addition, this study evaluated whether to centrifuge samples obtained in the field environment. The above tests were conducted to determine the optimal collection and handling procedures for urine samples in a field environment.
Materials and Methods
Participant information
We recruited 10 healthy volunteers from our hospital in September 2021 as research participants. These volunteers included five females and five males, with an age distribution of 25–31 years. For the short-term storage study in the POCT project, another 10 healthy volunteers from our hospital were recruited as research participants for technical reasons. These volunteers included five females and five males, with an age distribution of 25–34 years.
The inclusion criterion was normal previous physical examination results.
The exclusion criteria were as follows: strenuous exercise in the past 3 days; a history of drug use in the past week; long-term history of smoking and alcoholism; history of urinary system diseases; history of metabolic abnormalities; and history of any other medical condition that could affect the results of urine biochemical tests.
Instruments and reagents
A Roche Diagnostics cobas 8000 ISE analyzer and supporting electrolyte detection reagents, a Roche Diagnostics cobas 8000 c701 analyzer and supporting biochemical index detection reagents, and Mb and mAlb detection reagents were obtained from Beijing Danda Biotechnology Co., Ltd. The Mb standard was from Beijing Danda Biotechnology Co., Ltd., and the concentration of the standard was 5 μg/mL.
Sample processing
Fresh, random, midstream urine samples (100 mL) were collected from the research participants.
Five milliliters of each sample was added to 0.01 mL of Mb standard, and the mixture was then divided into 10 tubes.
Another 5 mL of each sample was centrifuged (4500 rpm, 20 minutes) and then divided into 10 tubes.
The remainder of each sample was directly divided into 70 tubes (500 μL/tube) without centrifugation.
The above samples were kept in different environments. At the set time points, one to two tubes were removed for measurement of study indicators.
No preservatives or other additives were added to the samples during the study.
Observation indicators
Trends in the measured concentrations under the following conditions were observed (Fig. 1).
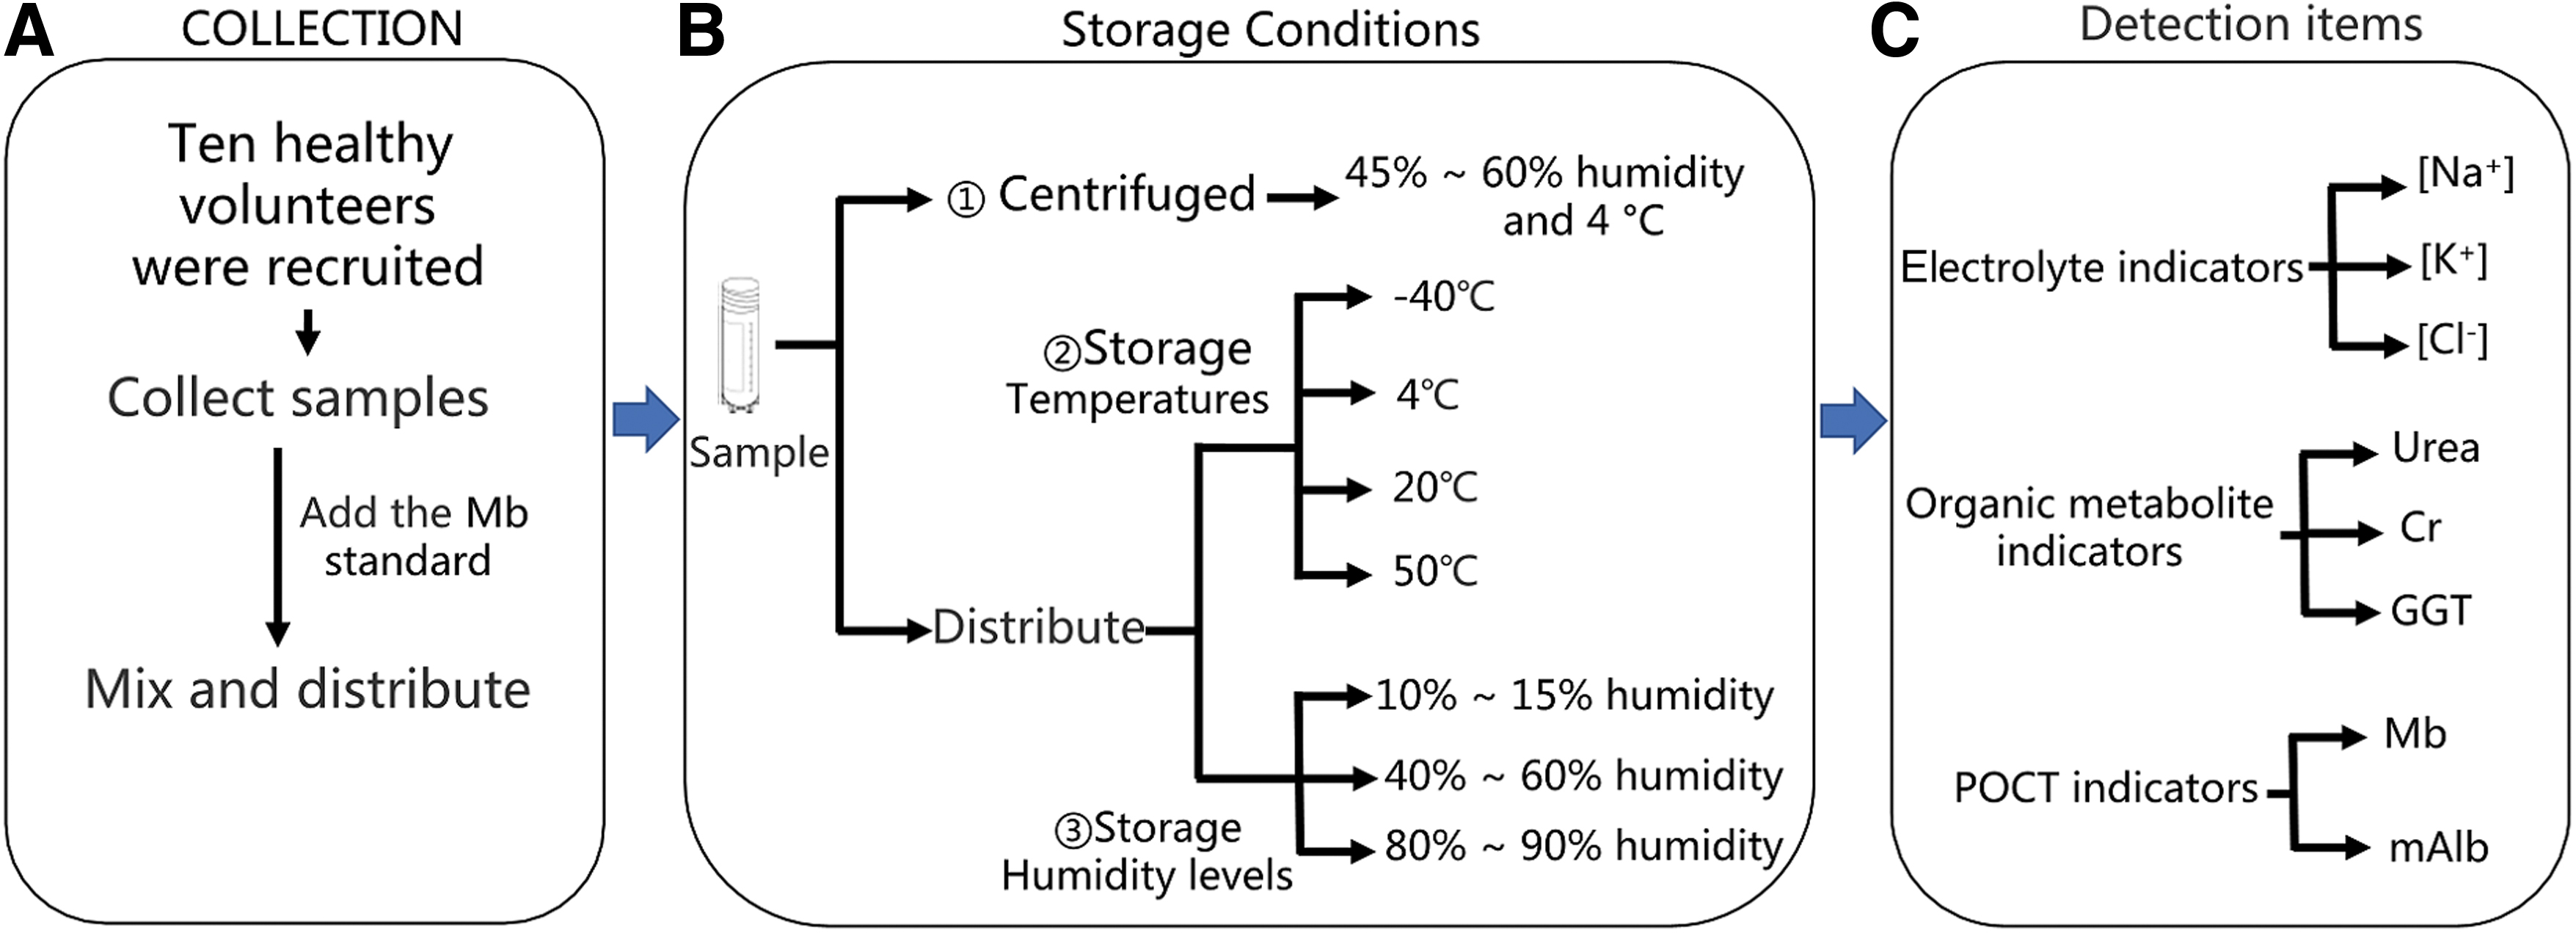
Research Schedule A, sample collection. Research Schedule B, the experimental groups were treated separately before the test: ① centrifugation and storage conditions of 45%–60% humidity and temperature of 4°C; ② stored at 4°C, −40°C, 20°C, and 50°C; and ③ stored separately at different humidity levels (10%–15% humidity, 40%–60% humidity, and 80%–90% humidity). Samples of each group were preserved for 1 hour, 2 hours, 4 hours, 24 hours, 72 hours, 7 days, and 55 days. Research Schedule C, detection items.
Measurement methods
Urine biochemical indicators and POCT indicators were measured at the above time points. [Na+], [K+], and [Cl−] levels were measured by an ion-selective electrode method; gamma-glutamyl transpeptidase (GGT) and creatinine (Cr) concentrations were measured by enzyme colorimetry; and urea concentration was determined through measurement of urease and glutathione concentrations.
Amino acid dehydrogenase concentrations were measured by a kinetic method. Urine Mb and mAlb concentrations were both measured by fluorescence immunochromatography. The specific procedures were performed according to the kit instruction manuals.
Statistical analysis
Statistical analysis was performed by using IBM SPSS 22.0 software. A two-sided p-value <0.05 indicated statistical significance. The Shapiro–Wilk test was used to test normal distribution. In the present study, statistical analysis showed that the electrolyte indicators, organic metabolite indicators, and POCT indicators conform to a normal distribution.
Normally distributed variables are presented as mean ± standard deviation (SD). A paired sample t-test was used for comparisons between the two sets of data. The Friedman test was used for comparison of multiple sets of data.
Results
Effect of centrifugation on electrolyte and organic metabolite indicators
Under storage conditions of 45%–60% humidity and temperature of 4°C, there was no significant change in the detection results of electrolytes ([Na+], [K+], and [Cl−]) or organic metabolites (urea and Cr) in the centrifuged and uncentrifuged groups within 7 days as the storage time increased. After long-term storage (55 days), the concentrations of [K+], [Cl−], and Cr increased slightly, but there was no significant difference (p > 0.05), and the concentration of urea was not significantly changed (p > 0.05). After 4 hours, the GGT concentration was significantly lower in the centrifuged group than in the uncentrifuged group (p < 0.05) (Fig. 2).

Changes in biochemical indicators before and after centrifugation. The asterisks (*) indicate values compared with noncentrifuged samples, p < 0.05.
Effect of centrifugation on POCT indicators
Under storage conditions of 45%–60% humidity and 4°C temperature, as storage time increased, there was no significant difference in the mAlb concentration between centrifuged samples and noncentrifuged samples, and the changes between samples were relatively stable. The concentration of Mb was relatively stable within 24 hours of centrifugation, and after 24 hours, the concentration began to decrease significantly.
Uncentrifuged samples showed a significant downward trend after 1 hour of storage. The concentration of Mb in centrifuged samples was significantly higher than that in noncentrifuged samples (p < 0.05). Thus, centrifugation can slow the downward trend of the measured concentration (Fig. 3).
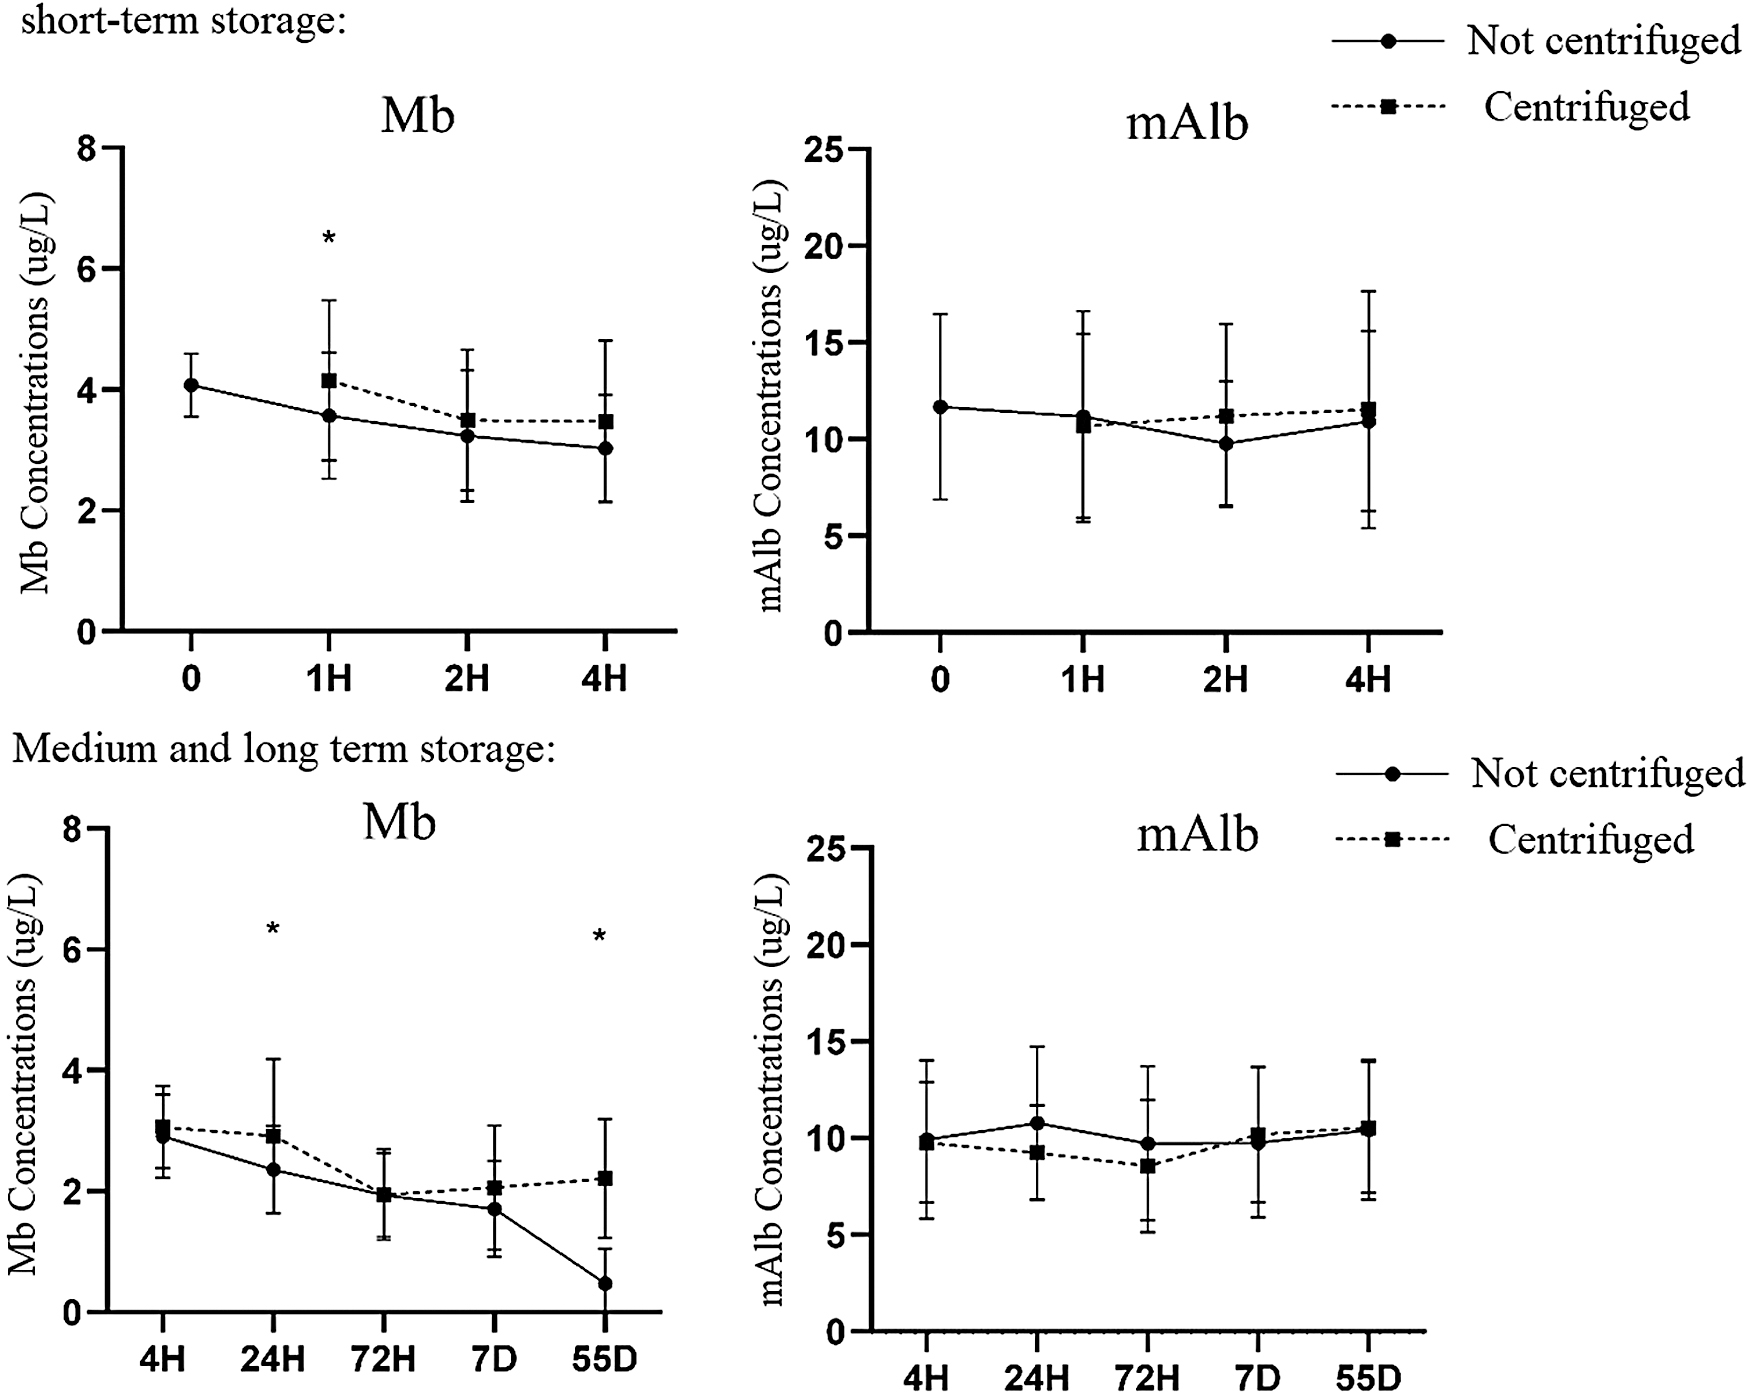
Changes in POCT indexes before and after centrifugation. The asterisks (*) indicate values compared with noncentrifuged samples, p < 0.05. POCT, point-of-care testing.
Effects of different storage temperatures on electrolyte and organic metabolite indicators
The measured concentrations of electrolytes ([Na+], [K+], and [Cl−]) in urine were less affected by the storage time at 4°C and room temperature, and the changes in [Na+] and [Cl−] levels were statistically significant (p < 0.05) at 50°C and increased significantly after longer (55 hours) storage. Under freezing conditions at −40°C, the change in these ion concentrations was statistically significant (p < 0.05), but the change was small.
Urea was very stable at different storage temperatures, and the measured concentration was slightly increased after storage at −40°C for 55 days (p < 0.05). At 50°C, the difference in concentration of urine Cr at 4 hours, 72 hours, and 7 days was statistically significant (p < 0.05), but the overall variation was small, and there was no significant difference in the measured concentration at 55 days (p > 0.05).
GGT exhibited good stability under 4°C storage conditions. Under room temperature storage conditions, the concentration difference measured at 4 hours was statistically significant (p < 0.05), but the overall change was small, and the concentration difference measured at 72 hours was statistically significant (p < 0.05), showing a significant downward trend.
Under storage at 50°C, the concentration difference was statistically significant after 24 hours of storage (p < 0.05) and showed a downward trend. Under storage at −40°C, the concentration difference measured after 2 hours of storage was statistically significant (p < 0.05), reflecting a significant downward trend (Table 1).
Changes in Biochemical Indicators at Different Storage Temperatures
Note: *p < 0.05 and **p < 0.001 compared with the 0-hour group.
Cr, creatinine; GGT, gamma-glutamyl transpeptidase.
Effects of different storage temperatures on POCT indicators
Further research on concentrations of protein in urine showed that the Mb concentration did not change significantly over a short period of time (4 hours) under storage at 4°C, and the measured concentrations at 4 hours under storage at other temperatures decreased to a certain extent (p < 0.05). The most significant changes are described below.
After medium-term and long-term storage of urine samples (more than 4 hours), the concentration of Mb changed significantly within 72 hours (p < 0.05), there was a significant decrease (p < 0.05) under various temperature storage conditions, and the measured concentration of Mb changed under a minimum temperature storage condition of 4°C. At 7 days, the measured Mb concentrations at 4°C and −40°C were higher than those at 20°C and at 72 hours.
At 55 days, Mb could no longer be detected under 20°C and 50°C storage conditions, the measured Mb concentration under 4°C storage conditions was further reduced, and the average measured Mb concentration under −40°C storage conditions increased, but the SD value showed a large increase in magnitude. The mAlb concentration changed slightly with time under different temperature storage conditions, but the change in the measured concentration was significant only under 4°C storage conditions (p < 0.05) (Fig. 4).
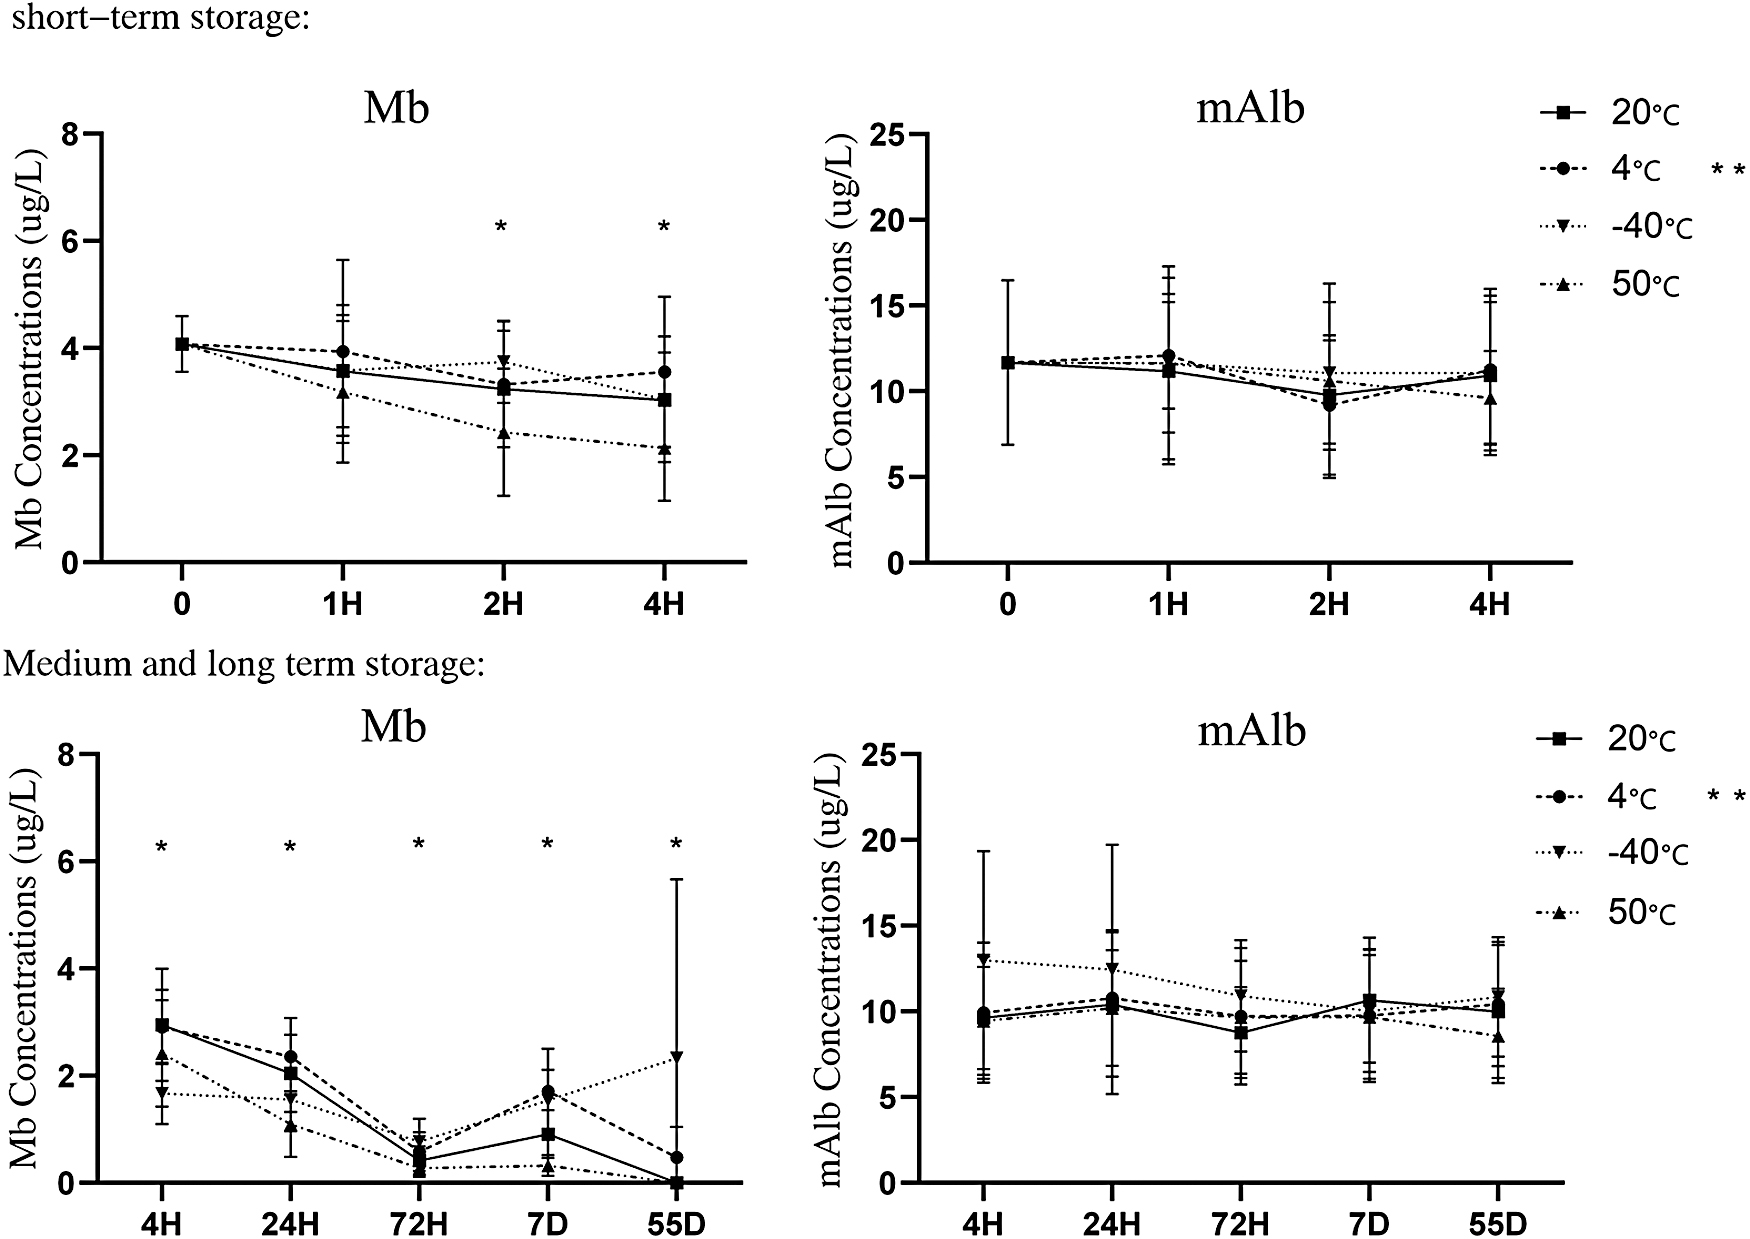
Changes in POCT indexes under different storage temperature conditions. The asterisks (*) indicate the comparison between groups at the same storage time, p < 0.05. The asterisks (**) indicate the comparison between groups at the same storage temperature, p < 0.05.
Effects of different storage conditions on electrolyte and organic metabolite indicators
Under dry conditions, the concentrations of electrolytes ([Na+], [K+], and [Cl−]) in urine changed little in both short-term and long-term storage. Under humid conditions, changes in [Na+] and [Cl−] levels were statistically significant (p < 0.05), and the measured concentrations increased significantly after 24 hours.
Urea was very stable under both normal humidity conditions and dry conditions. In short-term storage samples, there was no significant difference in the measured concentrations in the humid environment, and the measured concentrations decreased significantly after 7 days (p < 0.05). Under dry conditions, the measured concentration of urinary Cr decreased significantly after 72 hours (p < 0.05); under humid conditions, the measured concentration increased significantly after 24 hours (p < 0.05).
Under dry conditions, the measured concentration of GGT decreased significantly after 4 hours (p < 0.05) and the range of decrease increased significantly after 72 hours; under humid conditions, the measured concentration increased significantly after 24 hours (p < 0.05) and the range of increase increased significantly after 72 hours (Table 2).
Changes in Biochemical Indicators Under Different Storage Humidity Conditions
Note: *p < 0.05 and **p < 0.001 compared with the normal humidity group; ap < 0.05 and bp < 0.001 compared with the 0-hour group.
Because of deterioration of urine after 55 days of storage in humid conditions, electrolyte and organic metabolite indicators were not detectable.
Effects of different storage conditions on POCT indicators
Further research on the concentrations of protein in urine showed that humidity did not significantly change the measured concentration of mAlb within 4 hours (p > 0.05); the measured concentration of Mb was significantly increased after 4 hours of storage in high-humidity conditions compared with normal humidity conditions (p < 0.05).
After long-term storage of urine samples, there was no significant difference between the measured mAlb values under dry conditions and those under normal humidity conditions (p > 0.05). Under high-humidity conditions, the measured concentration of mAlb increased significantly after 72 hours (p < 0.05), and the increase after 7 days of storage was even greater. The measured concentration of Mb decreased significantly with time spent under each tested humidity condition (p < 0.05) (Fig. 5).
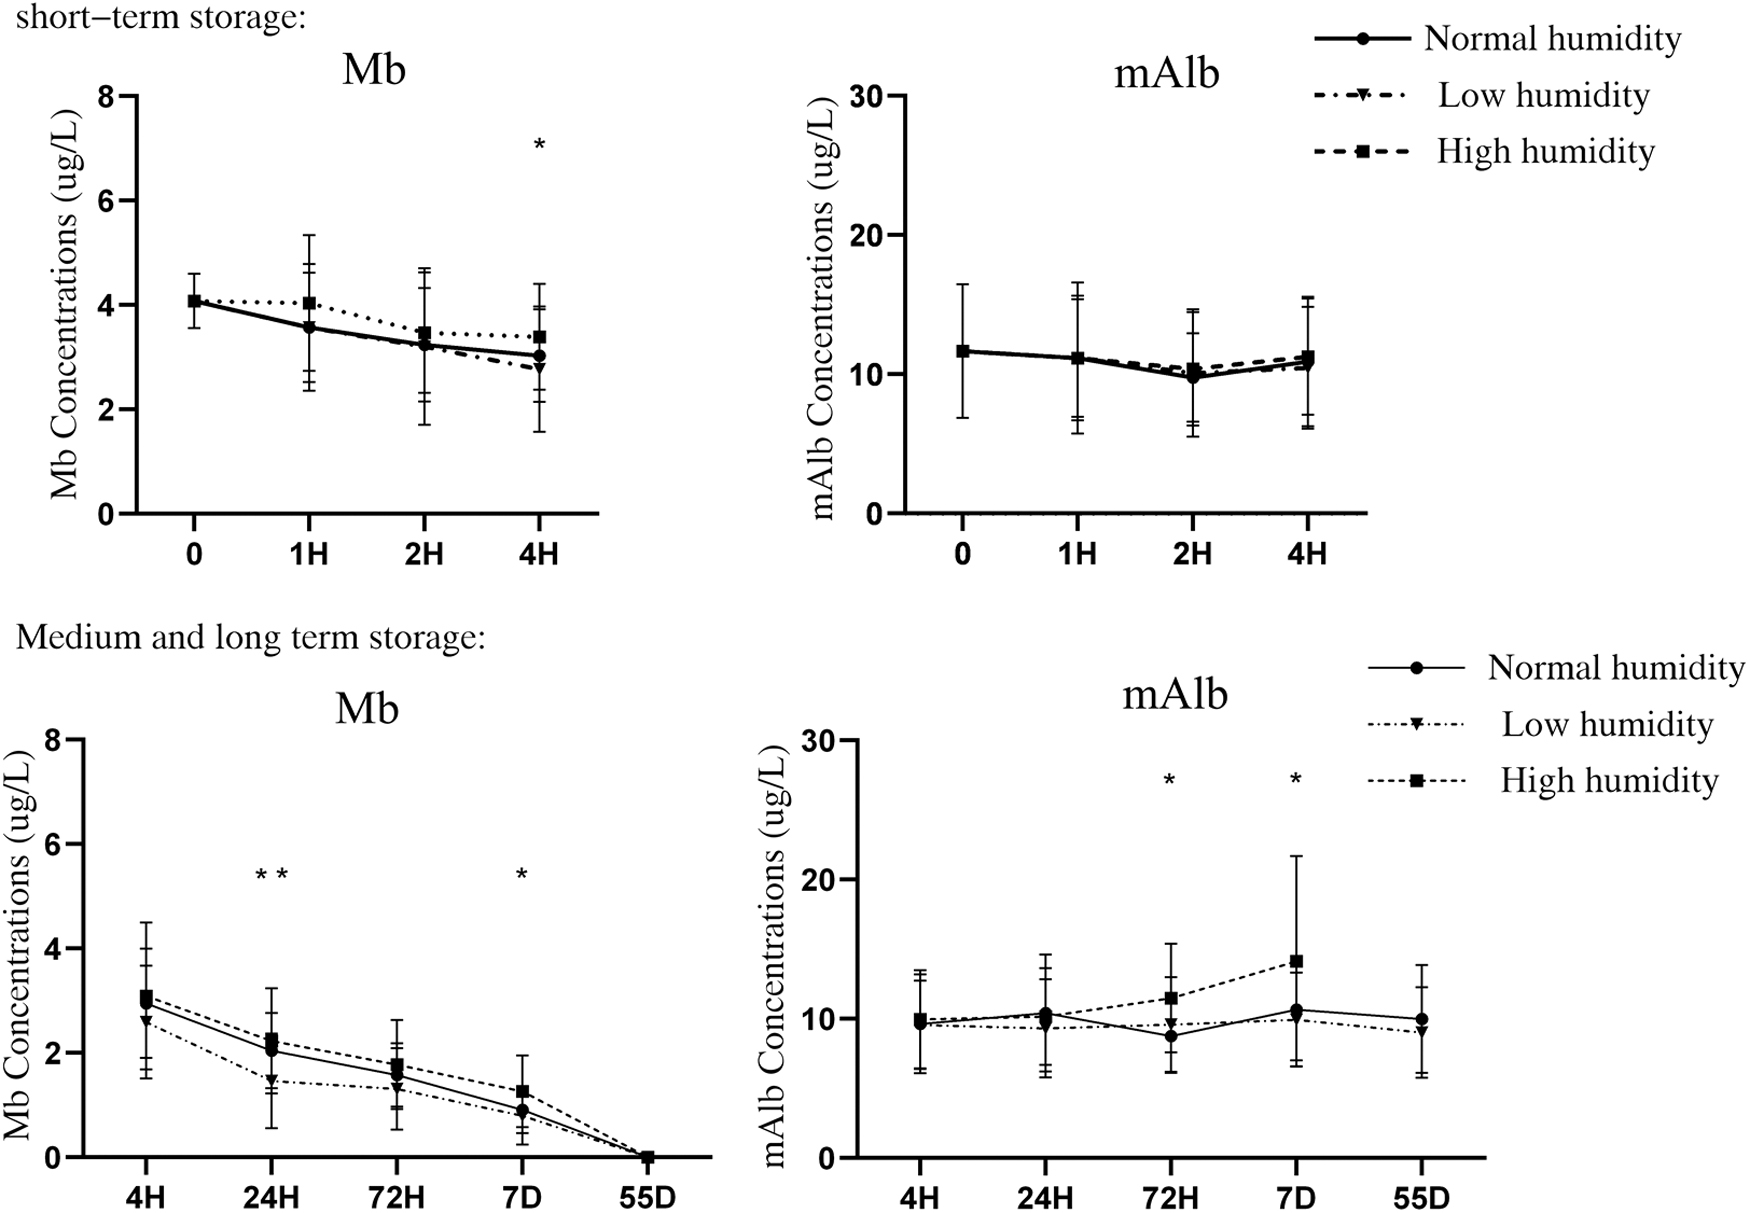
Changes in POCT indexes under different storage humidity conditions. The asterisks (*) indicate the comparison between the normal humidity group and high-humidity group, p < 0.05. The asterisks (**) indicate values compared with the low-humidity group, p < 0.05.
Discussion
Because of the lack of homeostatic mechanisms, markers in urine change earlier and more sensitively than many other biofluid-based markers over the course of disease. Urine specimens are convenient for measurement of biochemical indicators and are widely used in the diagnosis and treatment of metabolic and urinary diseases. In recent years, developments in modern testing technology have further improved the sensitivity, specificity, and accuracy of routine urine examination, with high application value. 8
The accuracy of results of current urine tests is often affected by many factors, such as collection factors, preservation factors, and personnel and instrument factors. 9 Research on the preservation conditions of urine samples and the changing trends of urine markers are of great significance for detection of diseases.
The collection and preservation environments of samples in the field are diverse, and it is of great significance to field medicine to study the effects of changes in the preservation environment on the measured concentrations of various urine indicators. The indicators discussed in this study are commonly used physiological and chemical indicators that reflect the physiological health status of research participants and are widely used and easy to measure and control.
Studies have shown that electrolytes, such as sodium, chloride, and potassium, in urine are stable within 48 hours when samples are stored at room temperature.7,10,11 This study verified some of the findings of these previous studies. The results of this study showed that the measured [Na+] and [Cl−] levels increased significantly after 24 hours in a high-temperature environment (50°C), which may be related to the obvious volatilization effect on the sample caused by high temperature.
Under 4°C storage conditions, electrolyte concentrations in urine changed slowly and the results of quantitative analyses after long-term storage were unaffected. Under low-temperature freezing conditions (−40°C), the changes in electrolyte concentrations in urine were statistically significant, but the range of change was very small. Low-temperature refrigeration and storage in a frozen environment had little effect on electrolyte concentrations in urine, and electrolyte indicators could be detected after a long period of storage.
Urea and Cr are the main amino acid metabolites and important physiological indicators in urine. We observed that urinary urea was relatively stable within 55 days under room temperature, low-temperature, and high-temperature storage conditions. Previous studies have shown that the physicochemical properties of urinary urea are stable. Urea can produce carbonic acid through hydrolysis by microorganisms or urease during long-term storage of urine samples, releasing ammonia and carbon dioxide, but hydrolysis is diminished at low temperatures and in a stable environment. 12
Studies have shown that the urinary Cr level is stable at room temperature, −4°C, and −20°C for a short period of 28 days, but it is only stable for 2 days at 55°C. 13 Prolonged storage of samples at −20°C or −70°C for 6 months also had little effect on urinary Cr levels.14,15
In the present study, we found that urinary Cr levels did not change significantly when stored at 4°C and at room temperature for 55 days, and there were some differences in the measured values at 50°C and −40°C, but the differences were not statistically significant after increased storage time, which indicated that the measured values of Cr were stable during long-term preservation of urine samples.
Another study reported that the urine Alb/Cr ratio (uACR) was stable for 7 days when samples were stored between 4°C and 6°C. 16 Measurement of the uACR is often used to monitor urinary protein excretion and it is a recommended indicator of early renal injury.
GGT is a membrane-bound enzyme with a molecular weight of 90 kDa and is mainly derived from renal tubules and cannot be filtered from glomeruli. Urinary GGT levels reflect renal parenchymal lesions, and quantitative detection is helpful for the diagnosis and monitoring of various diseases, such as diabetic nephropathy, and monitoring after kidney transplantation. 17 In addition, studies have shown that the activity of GGT in the urine of healthy people is twice that in serum and the diagnostic significance is different. 18
In this study, the stability of GGT was better when samples were stored at 4°C, the degree of change was small when samples were stored at room temperature for 7 days, and the concentration of GGT decreased significantly after sample storage at 50°C for 24 hours and at −40°C for 4 hours. Possible reasons for the above phenomena include the fact that higher temperatures increase the decomposition of enzymes by microorganisms, and freeze–thaw cycles may lead to further protein degradation. 19
The stability of mAlb stored under cryogenic freezing conditions was still a controversial issue in previous studies. Based upon an analysis of the primary structure of human albumin, the molecule is formed from three homologous domains, which themselves comprise two separate helical subdomains. Human albumin is very stable to changes in pH, exposure to heat, and denaturing solvents. 20
In the present study, we found that none of the mAlb measurements changed significantly when preserved under different temperature conditions over the 55-day study period. Collins et al. 21 found no significant difference in urinary albumin concentration between fresh urine and urine stored at either 4°C or 20°C for up to 7 days. Frozen urine samples can be stored for up to 6 months before assay without any loss of albumin concentration. Our study confirmed the stability of albumin in different storage conditions.
In a study of children and adolescents with diabetes in the United Kingdom, the mAlb concentration was significantly lower in samples frozen at −20°C than in fresh samples. 22 In another study, storage at −20°C for 6–8 months resulted in lower measured mAlb concentrations in samples than storage at −70°C. 14 Aggregation of mAlb caused by cryopreservation is a possible reason for the different observations.
Aggregated mAlb sinks low-abundance proteins in solution and irreversibly lowers their concentration. 15 No significant changes in urinary albumin were observed in our study except under high-humidity conditions. This may be due to the short duration of our study and the fact that we studied a healthy population.
Because there are trace amounts of Mb in the blood and urine of healthy individuals, detection of Mb in urine is more conducive to screening and diagnosis of diseases. 23 Mb is not stable and degrades easily. In this study, we found that the degradation rate of Mb could be reduced if samples were evaluated within 4 hours of urine storage at 4°C, and the measured concentrations of Mb were significantly reduced after storage at each temperature for 24 hours. Therefore, for the timely detection of Mb in urine, samples should be collected and stored at 4°C.
Centrifugation is routine in specimen processing. The findings of this study showed that centrifugation had little or no effect on the measurements of electrolyte and organic compound concentrations in urine. These substances are more soluble and less prone to aggregation. The measured concentration of GGT after centrifugation was significantly reduced, possibly because GGT aggregated before shaking and these aggregates were dissolved by centrifugation, indicating that GGT was soluble after shock treatment.
The measured concentration of Mb after centrifugation was higher than that without centrifugation at each time point, suggesting that centrifugation can slow down the degradation of Mb, which may be related to the removal of enzymes and microorganisms after centrifugation. In this study, there was no significant difference in the measured mAlb concentration after centrifugation and its stability was high.
The effect of humidity on urine storage is less studied, and there are inevitably large differences in humidity in field environments. A high-humidity environment has a great impact on electrolytes in urine, significantly increasing their measured concentration. However, low-humidity preservation can slow down the rising trend of detection levels. Urine urea and Cr remained relatively stable after 55 days of storage under normal humidity, and the detection level did not change significantly.
Under dry conditions, the detection level of urine GGT decreased significantly after 72 hours and the subsequent decrease was also higher than that of normal humidity. Compared with normal humidity, the detection levels of GGT and Mb in the short-term high-humidity storage condition increased, but the declining trend slowed down compared with the initial value. The above results may suggest that water evaporation is an important interference factor. 24
During a long period of storage at high humidity, the detection levels of GGT and mAlb increased significantly compared with those at normal humidity, but the detection level of Mb did not change significantly. Under dry conditions, the detection levels of Mb and mAlb did not change significantly compared with normal humidity. The above results suggest that urine collected for detection of GGT, Mb, and mAlb should be maintained at normal humidity (45%–60%) if stored for a long time.
In conclusion, during urine storage, some substances are sensitive to storage conditions, while some substances can remain stable for a long time. There are differences in the stability of electrolytes, metabolites, and some macromolecular substances. We should further increase the study period and track the long-term storage stability of protein-based biomarkers under common storage temperature and humidity conditions.
Storage conditions that affect the stability of substances in urine are diverse, and this study did not evaluate all conditions. For example, studies have shown that higher urine pH may also prevent protein degradation in frozen samples stored at −20°C; furthermore, different preservatives affect the stability of urine in storage. 25 We need to consider more factors when planning future research, explore better conditions for prolonging the storage time of various substances in urine, and ensure the accuracy of each sample detection method.
Footnotes
Authors' Contributions
J.J., H.L., Y.W., and Y.T. were involved in conceptualization and writing—review and editing; J.J., H.L., and Y.T. were involved in data curation; J.J., H.L., and Y.W. were involved in formal analysis; M.Z., Y.W., and Y.T. were involved in funding acquisition, resources, and supervision; J.J., W.N., F.G., and M.Z. were involved in investigation; J.J., H.L., W.N., J.P., Y.W., and Y.T. were involved in methodology; J.J., M.Z., and F.G. were involved in project administration; J.J. and H.L. were involved in software and writing—original draft; Y.W. and Y.T. were involved in validation; and J.J., H.L., W.N., J.P., and F.G. were involved in visualization. All authors have read and agreed to the published version of the article.
Ethical Approval
This study was approved by the Ethics Committee of Chinese PLA General Hospital (approval no. S2021-019-01).
Author Disclosure Statement
No conflicting financial interests exist.
Funding Information
This study was supported by the National Key Research and Development Program of China (grant no. 2020YFC2004604).