




Abstract
This study examined the influence of heat exposure on DNA samples during polymerase chain reaction (PCR) detection. In this study, λDNA samples, as model DNA, were exposed to 105°C for 3–90 minutes or to 105°C–115°C for 15 minutes by autoclaving. The exposed samples were subjected to real-time PCR using nine primer sets with amplicon sizes of 45–504 bp. Regarding DNA samples exposed to 105°C by autoclaving, the data showed negative correlations between the logarithm of λDNA concentration (log λDNA) calculated using real-time PCR and exposure duration and a good relationship between the slope of the regression line and amplicon size. Regarding λDNA samples exposed to heat for 15 minutes, the data showed negative correlations between the log λDNA and exposure temperature and a good relationship between the slope of the regression line and amplicon size. These results showed that the equations used in this study could predict the degree of degradation in λDNA samples by autoclaving, and the PCR detection levels of the DNA at each amplicon size.
Introduction
Polymerase chain reaction (PCR) is a principal detection method for target DNA sequences used for various examinations. However, DNA fragmentation accompanied by DNA degradation leads to decreased sensitivity and accuracy of PCR detection. Accordingly, the relationship between DNA degradation and PCR detection should be investigated.
DNA degradation is induced by biological stresses such as nucleases (especially DNase I1–3 ); physical stresses such as heat,4–23 sonication,1,3,24 and ultraviolet radiation 25 ; and chemical stresses such as acids 26 and mutagenic agents.27,28 Heat exposure-induced depurination of DNA, followed by phosphodiester cleavage,23,29 cannot be detected using PCR. To investigate the relationship between DNA degradation and PCR detection, several studies have used heat-exposed model samples in foods5–9,11–17 and biomaterials,19,20 which were prepared mainly by exposure to dry heat using an oven or moist heat using an autoclave. Heat exposure using an autoclave induces severe DNA degradation.8,21 Thus, this method can be used to eliminate DNA and prevent DNA contamination.22,25 However, the relationship between the degree of DNA degradation and autoclaving conditions (time and temperature) remains unclear. Therefore, the present study focused on DNA degradation by autoclaving.
The above previous studies reported that the degree of DNA degradation differed between crude samples, such as foods and biomaterials, even if the same heat exposure method was used.9,13 These differences were attributed to the presence of coexisting DNA-stabilizing substances, such as salts, 30 and protection conferred by the cell structure in crude samples. 21 Some studies exposed DNA extracted from crude samples to heat. This extracted DNA might contain PCR inhibitors (humic acid and hematin 31 ) and DNA-unstabilizing substances (cellular lipids 32 ). Other studies attempted to clarify the process of DNA degradation by heat exposure using a pure DNA solution and reported that it was easily degraded under high temperature (>100°C) and high pressure.21,33,34 These results are useful for understanding DNA degradation by heat, thereby necessitating further investigation.
A method for clarifying the relationship between DNA degradation and stress exposure is by using the equation. Previous studies used the random degradation process for estimating the degree of DNA degradation by oven heat, 23 mutagenic agent use,27,28 and DNase I digestion. 2 In this process, the degree of DNA degradation was estimated according to a random Poisson model. Deagle et al. 35 optimized the model for real-time PCR detection in degraded DNA samples, used the model for detecting predator and prey DNA in fecal samples, and formulated equations for estimating the degree of DNA degradation. The model could predict real-time PCR detection levels of degraded DNA in each amplicon size and produce the λ value (an indicator of the intensity of stress-induced damage to DNA).
Many other studies also applied a random Poisson model for the PCR detection of degraded DNA in blood,1,19 tooth, 36 and bone 20 samples. Accordingly, this model might be useful for PCR detection of DNA degraded by autoclaving.
The present study used λDNA, a 48,502 bp linear double-stranded DNA that is commercially available as a high-purity reagent, as a model DNA sample. The pure λDNA solution was autoclaved at various temperatures for different durations. The autoclaved solutions were measured by real-time PCR using primer sets with various amplicon sizes. These data were applied to a random Poisson model to formulate the equations used in this study. This study explored the relationship between amplicon size and heat-exposed conditions (duration and temperature) in real-time PCR detection of λDNA samples exposed to heat using an autoclave.
Materials and Methods
Materials
A 0.5 μg/μL solution of λDNA in 10 mM tris-HCl (pH 8.0) and 1 mM EDTA was purchased from Fujifilm Wako Chemicals (Osaka, Japan) and was diluted using pure water to obtain the required concentrations. All chemicals were reagent-grade quality.
Preparation of degraded λDNA samples by autoclaving
λDNA samples degraded by exposure to heat and high pressure were prepared by autoclaving (HICLAVE HV-50; Hirayama Manufacturing, Saitama, Japan). To investigate the effect of exposure duration on DNA degradation, 200 μL of 100 ng/μL λDNA solution in a 1.5-mL tube was exposed to 105°C (0.12 MPa) for 3, 6, 9, 12, 15, 30, 45, 60, and 90 minutes. To investigate the effect of exposure temperature on DNA degradation, 200 μL of 100 ng/μL λDNA solution in a 1.5-mL tube was exposed to 105°C, 107°C, 109°C, 111°C, 113°C, and 115°C (0.12, 0.13, 0.14, 0.15, 0.16, and 0.17 MPa, respectively) for 15 minutes. All exposure durations did not include the time required for increasing and decreasing the temperature during autoclaving. All degraded λDNA samples were prepared twice. After autoclaving, the samples were stored at −20°C until analysis. Before performing real-time PCR, the samples were diluted to 100 pg/μL.
Preparation of nucleotides
To compare detection levels using primer sets of various product sizes, nine primers were designed to amplify 45, 60, 75, 90, 104, 190, 302, 416, and 506 bp products for λDNA sequencing (GI:9626243) (Table 1). These primers were synthesized by Nippon Gene (Tokyo, Japan). The primers were located at the median region (21164–21669 nucleotides) of the λDNA sequence (Fig. 1) and possessed almost the same Tm values.
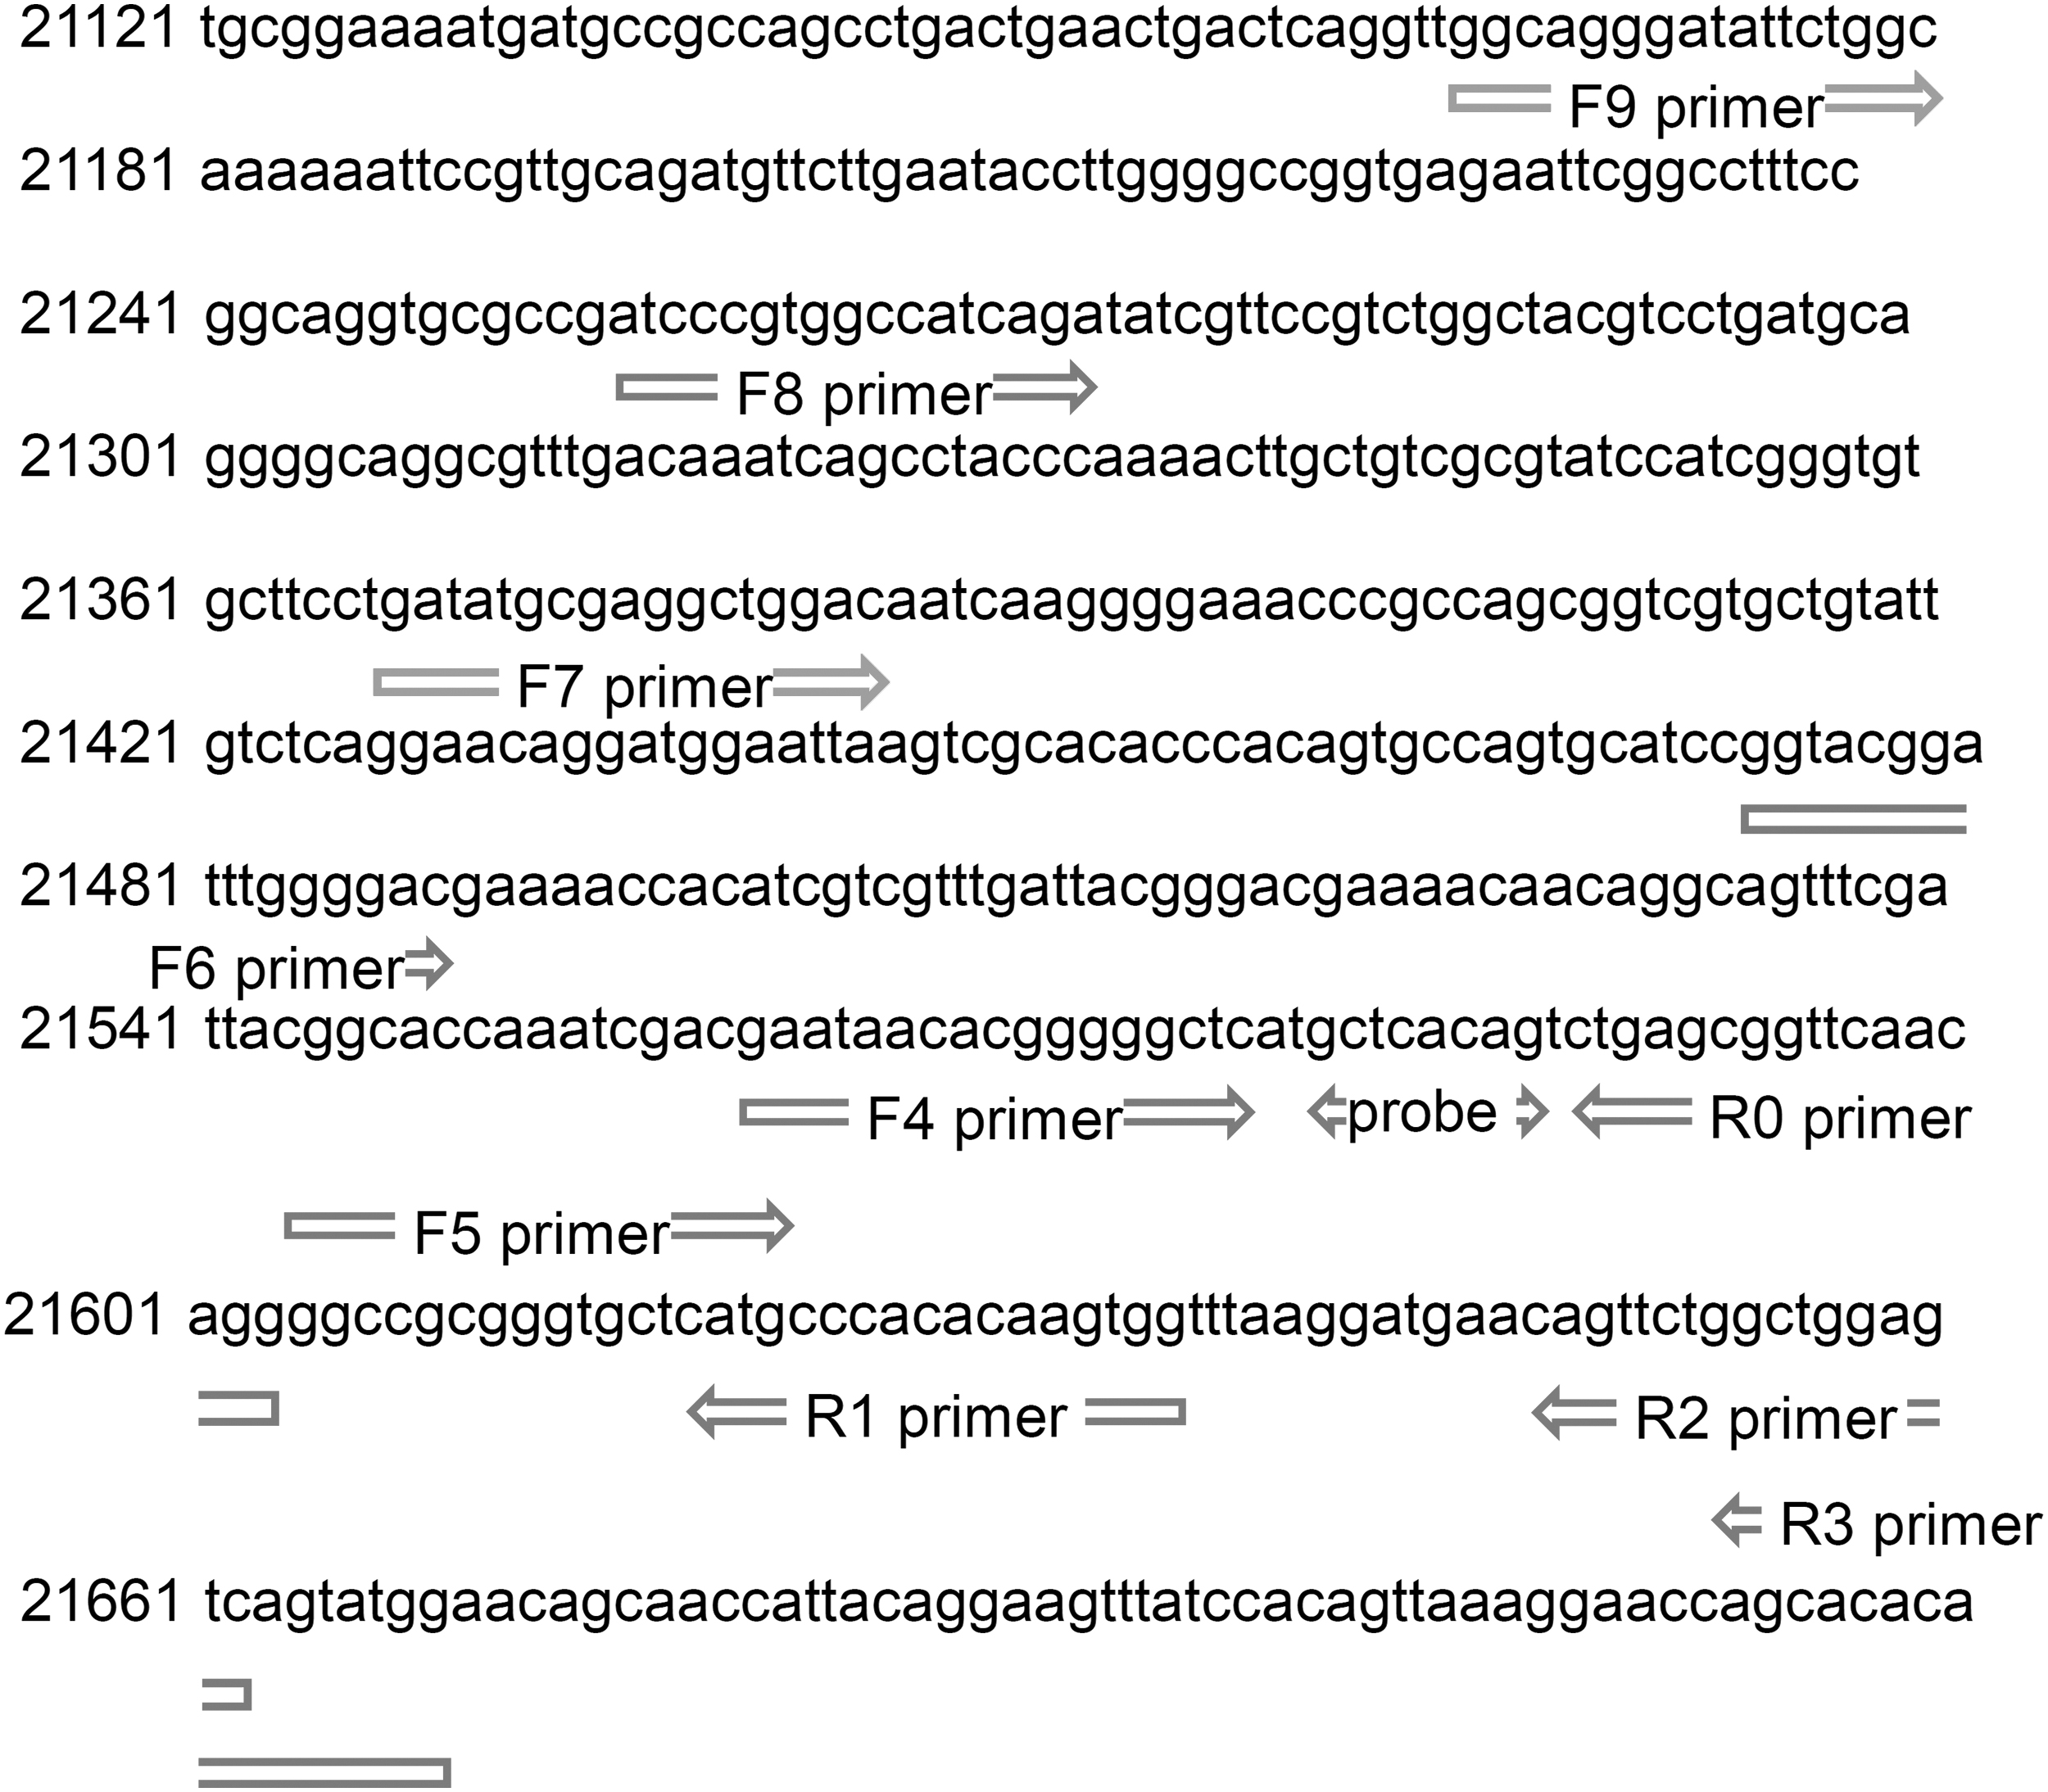
Nucleotide sequence from position 21121 to 21720 of λDNA. Each arrow represented the locations of primers on λDNA in this study.
List of Primers Used to Determine Polymerase Chain Reaction Detection Levels in an Amplicon Size-Dependent Manner
Numbers in location show the nucleotide number on the λDNA sequence.
Real-time PCR
The PCR was run according to the manufacturer's instruction. The reaction mixtures and thermal cycle program are briefly described here. A common fluorogenic hydrolysis probe, the Universal ProbeLibrary Probe#100 (Roche Diagnostics, IN), was used for all primer sets. The reaction mixture (10 μL) contained 1 × QuantiTect Multiplex PCR Master Mix (Qiagen, Hilden, Germany), 0.2 μM probe, 0.8 μM of each primer, and 1 μL of DNA sample. Real-time PCR was performed using the MxPro 3000 system (Stratagene, CA). The thermal cycle program was as follows: 2 minutes at 50°C, 15 minutes at 95°C, and subsequent amplification of the DNA for 40 cycles of 60 seconds at 94°C and 60 seconds at 60°C.
All samples were run in duplicate, and the mean values were used for calculating the DNA level using a standard curve. The standard curves for each primer pair were prepared from 0.02, 0.2, 2, 20, and 200 pg/μL of λDNA solution diluted using 1 ng/μL transfer RNA solution.
Electrophoresis
A 10-μL DNA sample was electrophoresed on 15% polyacrylamide gel and 0.025 M tris–0.19 M glycine buffer (pH 8.3). After electrophoresis, the gel was stained with GelRed (Fujifilm Wako Chemicals) and imaged using the Gel Doc XR+ equipped with Image Lab Software (Bio-Rad Laboratories, CA). A 10 bp DNA step ladder (10–100 bp) (Fujifilm Wako Chemicals) and a 2-log DNA ladder (0.1–10 kbp; New England Biolabs, MA) were used as size markers.
Data analysis
Linear regression analysis was performed using Excel software (Microsoft, CA).
Results and Discussion
DNA degradation has been an issue in DNA analysis, such as DNA staining and PCR.10,24,37 In this study, the electrophoresis of λDNA samples exposed to heat using an autoclave revealed a smeared band, and the smeared band shifted to a shorter size with an increase in the heat exposure duration and temperature (Fig. 2A, B). These results indicate that heat exposure induced DNA degradation, and the degree of degradation increased in a time- and temperature-dependent manner. A strong band around 20 bp was visualized in all degraded λDNA samples. A subsequent analysis using 15%–25% polyacrylamide gradient gel revealed that this strong band was not specific to a single 20 bp DNA fragment but constituted many DNA fragments sized <20 bp. Moreover, the intensity of this band weakened with an increase in heat exposure duration and temperature (e.g., exposure to 121°C for 120 minutes) (data not shown).
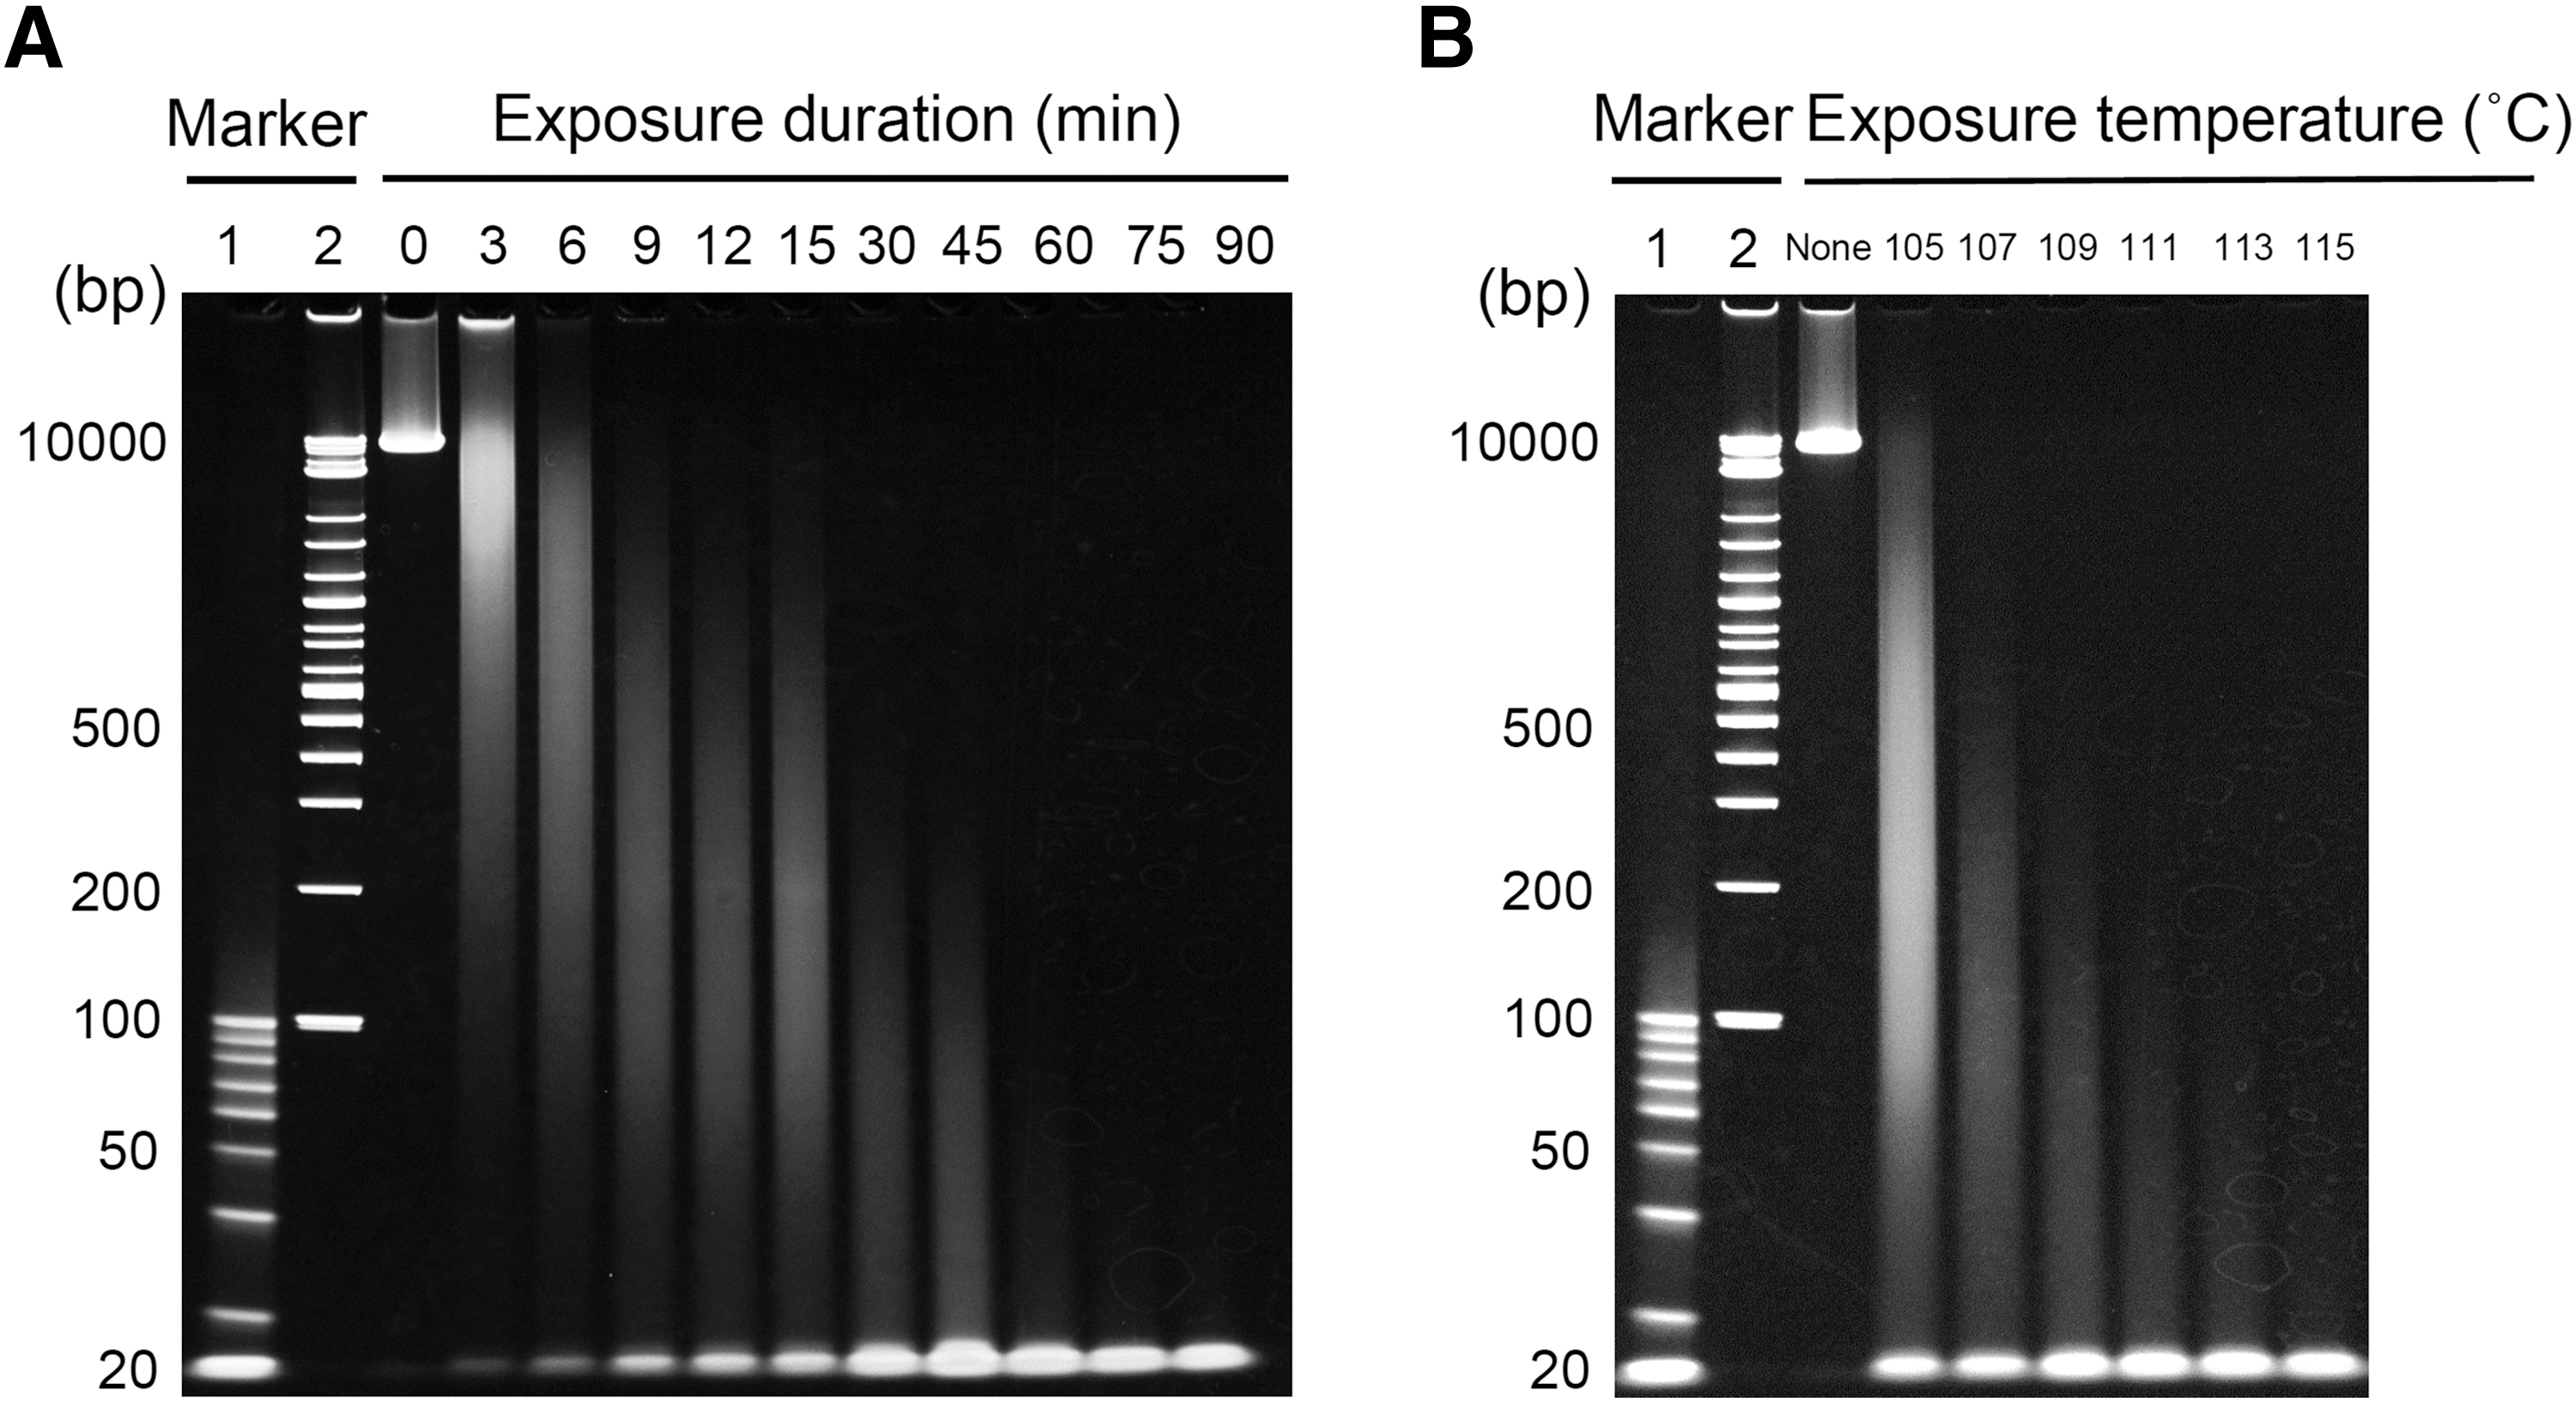
Polyacrylamide gel electrophoresis of degraded λDNA samples.
Similarly, previous studies also found (using electrophoresis analysis) that DNA bands were finally eliminated in DNA samples autoclaved for a long time.21,22 Thus, the heat exposure conditions used in the present study successfully induced DNA degradation, as in previous studies, and were suitable for analyzing DNA degradation. Furthermore, a few differences in PCR detection were found between different locations of PCR target regions in heat-exposed λDNA samples (Supplementary Data and Supplementary Table S1). Accordingly, the primer sets against the median region of the λDNA sequence were used to analyze decreasing PCR detection levels in heat-exposed λDNA samples (Fig. 1).
To analyze the degree of DNA degradation in heat-exposed λDNA samples, we used the random degradation process reported in previous studies on DNA degradation by oven heat,
23
mutagenic agents,27,28 and DNase I exposure.
2
In this process, the probability of DNA fragmentation in degraded DNA samples could be predicted using the random Poisson model. Furthermore, Deagle et al.
35
optimized this model for PCR detection in degraded DNA samples and proposed the following linear form model:
Nx: Copy number calculated by PCR amplification of x base pair in degraded DNA
N: Copy number predicted by PCR amplification of x base pair in assumptive undegraded DNA
λ: Decline rate of PCR detection in degraded DNA (damage intensity)
x: Amplicon size
This theoretical model was applied to analyze PCR data for predator and prey DNAs in fecal samples by fitting the data to the model using linear regression analysis. The random Poisson model was also applied to many types of samples, such as feeds, 38 blood,1,19 tooth, 36 and bone, 20 to clarify the relationship between amplicon size in PCR detection and stress in DNA. The equation could predict copy number in assumptive undegraded DNA from copy number calculated by PCR in degraded DNA. The λ value could estimate the damage intensity of stress for DNA. Similarly, Ct values in real-time PCR were also used instead of the logarithm of copy number in the equation.9,39
This model was useful for estimating the degree of DNA degradation within each crude sample. However, in examinations using stress-exposed crude samples, the presence of DNA-stabilizing agents (e.g., salts such as KCl 30 ) or DNA-unstabilizing agents (e.g., heavy metal ions such as Mn2+, 40 acids, 26 and lipids 32 ) within crude samples might influence DNA degradation. In addition, the quality of DNA samples extracted from crude samples can differ between extraction methods.15,41 According to studies on exposure of DNA extracted from crude samples to stress, DNA extraction method and operation might interfere with PCR detection by contaminating PCR inhibitors, for example, calcium, hemoglobin, polysaccharides, and humic acid 42 within the extracts. A model DNA sample of suitable molecular size and high purity is therefore needed to estimate the DNA damage intensity.
Calderón-Franco et al. 21 used λDNA as a control sample for DNA degradation using a microwave and autoclave. Mikutis et al. 23 synthesized a 113 bp DNA fragment study DNA degradation by oven heat.
Based on the above studies, the present study also used λDNA, a 48,502 bp linear double-stranded DNA that is commercially available as a high-purity reagent. The effects of heat exposure duration and temperature on the degree of degradation of the λDNA solution were investigated using an autoclave. Because the standard autoclaving temperature (121°C) has drastic effects on DNA degradation in the λDNA solution,22,25 low-temperature conditions (105°C–115°C) were used. The obtained results fit Equation (2), which was converted from the natural logarithm of Equation (1) to the common logarithm (log to the base 10) using linear regression analysis to determine the change in λDNA concentration.
The results of exposure at 105°C in a time-dependent manner revealed negative correlations between log λDNA and exposure duration (0–90 minutes) for each primer set (Fig. 3A). The negative slope, which was the λ value, increased in the primer set producing larger amplicon size, and was correlated with amplicon size (Fig. 3B). A negative correlation was observed between log λDNA and amplicon size for an exposure duration of 3–45 minutes, and the negative slope was correlated with exposure duration (Fig. 3C, D). These results indicated that the parameters—exposure duration and amplicon size—in DNA degraded by heat exposure individually fit the random Poisson model. The larger the values of the two parameters, the greater the λ value (an indicator of damage intensity).

Relationships between detection levels by real-time PCR and amplicon sizes in λDNA samples exposed to 105°C for each duration.
The results of exposure at 105°C–115°C for 15 minutes in a temperature-dependent manner revealed negative correlations between log λDNA and exposure temperature for each primer set (Fig. 4A). The negative slope λ value increased in the primer set producing larger amplicon size and was correlated with amplicon size (Fig. 4B). A negative correlation was observed between log λDNA and amplicon size, and the negative slope was correlated with exposure temperature (Fig. 4C, D). These results indicated that the parameters—exposure temperature and amplicon size—in DNA degraded by heat exposure were individually fit to the random Poisson model, and the λ value increased with an increase in the parameter values. Although it was difficult to clarify the DNA degradation process owing to the use of severe autoclave conditions (121°C) in previous studies,21,22 the adjustment of autoclaving conditions (duration and temperature) in the present study helped formulate equations related to PCR detection in λDNA samples degraded by autoclaving.

Relationships between detection levels by real-time PCR amplifying each product and exposure temperatures for 15 minutes in λDNA samples.
In addition, the equations provided more predictions. The x-intercepts of the equations in Figures 3B, D and 4B, D were the value of the x-axis parameter in the case of λ value = 0, which means that there is no influence on PCR detection. The 103°C of the x-intercept in Figure 4D is predicted as the minimum temperature required to induce DNA degradation by heat exposure for 15 minutes. The prediction coincided with the findings of previous studies, in which significant strand scission and irreversible loss of secondary structure occurred at temperatures >100°C.33,34 Conversely, other studies reported that DNA degradation was induced even by exposure to temperatures <100°C for a prolonged duration.18,23
The x-intercept in Figure 3B predicted the remaining 21.4 bp DNA fragment in λDNA samples exposed to 105°C for 0–90 minutes, while the x-intercept in Figure 4B predicted the remaining 16.7 bp DNA fragment in λDNA samples exposed to 105°C–115°C for 15 minutes. These predictions of remaining small DNA fragments in heat-exposed λDNA samples coincided with the strong band observed around 20 bp by electrophoresis (Fig. 2). However, the intensity of this band weakened with an increase in heat exposure duration and temperature (e.g., exposure to 121°C for 120 minutes). Thus, the proposed equations clarified the influence of PCR detection based on amplicon size and heat exposure duration and temperature under different experimental conditions in λDNA samples. Moreover, the λ values might indicate differences in the DNA samples, such as DNA length and the sample matrix used. In such cases, the λ values must be recalculated.
Conclusions
This study clarified the relationship between amplicon size and heat exposure conditions (duration and temperature) in real-time PCR detection of λDNA samples degraded by heat exposure using an autoclave and established the equations for the relationship. In addition, the equations based on the random DNA degradation process could predict the initial concentration of target DNA in DNA samples exposed to heat by PCR detection using two primer pairs, which produced amplicons of different sizes. 23 Thus, the equations proposed in this study might be useful for predicting the DNA degradation degree and PCR detection level at each amplicon size in λDNA samples degraded by autoclaving, although the λ value might have to be recalculated depending on the DNA sample. Autoclaving is a useful technique for preventing DNA contamination.22,25 The proposed equations might be useful for determining the elimination rate of DNA after autoclaving.
Footnotes
Acknowledgment
The authors would like to thank Enago for the English language review.
Authors' Contributions
N.H. designed the study. N.H., Y.T., and M.S. performed the experiments and analyzed the data. N.H. wrote the article. K.Z. and K.S. critically revised the article. All the authors have revised and approved the final article.
Author Disclosure Statement
No conflicting financial interests exist.
Funding Information
This work was supported by JSPS KAKENHI grant number 25860104 and by a Nihon University Chairman of the Board of Trustees Grant.

References
Supplementary Material
Please find the following supplemental material available below.
For Open Access articles published under a Creative Commons License, all supplemental material carries the same license as the article it is associated with.
For non-Open Access articles published, all supplemental material carries a non-exclusive license, and permission requests for re-use of supplemental material or any part of supplemental material shall be sent directly to the copyright owner as specified in the copyright notice associated with the article.
