
Abstract
Recently, we proposed a low-glycerol cryoprotectant formulation (consisting of 0.4 M trehalose and 5% glycerol) for cryopreservation of human red blood cells (RBCs), which greatly reduced the concentration of glycerol, minimized intracellular ice damage, and achieved high recovery. Although this study was successful in cellular experiments, the nonequilibrium phase transition behaviors of the cryoprotective agent solution have not been systematically analyzed. Therefore, it is essential to provide reliable thermodynamic data to substantiate the viability of this cryopreservation technique. In this study, the phase change behaviors and thermal properties of typical trehalose and/or glycerol solutions quenched in liquid nitrogen were investigated using differential scanning calorimetry and cryomicroscopy. It was found that the glass transition temperatures of both the trehalose aqueous solution (<1.0 M) and glycerol aqueous solution (<40% w/v) did not vary apparently with the concentration at low concentrations, while they increased significantly with increasing concentration at high concentrations. Moreover, it was revealed that the inhibitory effect of trehalose on ice growth was affected by glycerol. We further found that the addition of low concentrations of glycerol facilitates the partial glass transition of trehalose solutions at low concentrations. The results of this work provide reliable thermodynamic data to support the cryopreservation of human RBCs with unusually low concentrations of glycerol.
Introduction
Successful cryopreservation typically requires the addition of cryoprotective agents (CPAs) to minimize damage from ice formation at low temperatures. 1 In 1949, the first cryoprotectant (glycerol) was successfully used by Polge in sperm cryopreservation. 2 Later, CPAs for various cells were gradually discovered and used. In 1972, Mazur proposed two types of cold damage: solution injury and intracellular ice injury. 3 During the last four decades, it has been increasingly accepted that one of the major causes of cell injury is devitrification, rather than crystallization during freezing. 4
Devitrification is the process where molecules gain sufficient mobility, leading the nuclei to grow and transform from the irregular random arrangement of the glassy state into the ordered structure of the crystalline state. This transition occurs as the temperature rises during heating and rewarming. Typically, with faster rewarming rates, the sample will have less devitrification, less injury to the biomaterial, and higher cell recovery rates.5,6 Currently, cryopreservation is mainly divided into two categories: programmable slow freezing and vitrification. 7 Advanced cryopreservation engineering strategies are also increasingly being used in the preservation of biomaterials. 8 Therefore, understanding the phase change behavior and thermal properties of CPAs with different concentrations is essential in cryopreservation to prevent or mitigate devitrification.
Red blood cells (RBCs) are the most abundant and readily available cells in the human body. They have been widely used to validate cryobiological theories or test new cryopreservation technologies since the beginning of cryobiology.9–12 The classical high-glycerol/slow-freeze and low-glycerol/rapid-freeze RBC cryopreservation methods have been successfully used in clinical practice for over 50 years.13,14 However, removing high-concentration glycerol (20% or 40%) after thawing still poses significant problems for clinical staff, such as severe hemolysis due to osmotic imbalance, complex and time-consuming operations, and an inability to meet emergency needs.15,16 Shen and his collaborators optimized the intracellular water content of RBCs to the optimal level by optimizing the trehalose concentration. 17
In their work, they optimally chose 10% as the final hematocrit value for RBC cryopreservation with 0.4 M trehalose and 5% glycerol (0.4 M Tre +5% Gly), which took into account both the high recovery rate and clinical practice, and used polytetrafluoroethylene tubes to improve the efficacy. They took advantage of these techniques and achieved higher freeze-thaw recovery (95%–96%) compared to standard low-glycerol/rapid-freeze RBC cryopreservation methods. This method substantially reduces the glycerol concentration required in conventional RBC preservation protocols and has high clinical guideline significance. Although this study has been successful in cellular experiments, the nonequilibrium phase transition behavior of CPAs has not been systematically analyzed. Therefore, we focused on this CPA formulation and explored its components in depth.
Many studies have shown that trehalose is more effective than other disaccharides in suppressing the growth of ice crystals during freezing and warming. Trehalose is a disaccharide of α-glucose, which can bind water molecules, and is found in many biological organisms. It can effectively inhibit ice crystals' morphological instability and slow their growth rate.18–20 Studies have shown that it can be used as an additive to Me2SO-based freeze solutions to reduce the growth area of ice crystals and increase the number of ice crystals. 21
In addition, trehalose can stabilize cell membranes and proteins during the freezing process.18,22 Similarly, glycerol is one of the most commonly used cryoprotectants in cryobiomedical technology and was also the first cryoprotectant used and studied. Its molecular structure is simple, but representative.23,24 Hydrogen bonding between water molecules is the driving force of ice crystal formation. Glycerol molecules in glycerol aqueous solution have an inhibitory effect on the hydrogen bonding of water molecules.
Meanwhile, glycerol molecules can be adsorbed on the ice crystal surface instead of water molecules, occupy lattice sites, break the symmetry of ice crystals, and slow down the growth rate of ice crystals. Some previous studies have also reported certain concentrations of glycerol or trehalose solutions. Both glycerol and alginate have significant effects on inhibiting ice crystals. Currently, multivariate solutions as freezing agents are becoming more available, and adding small amounts of glycerol to PBS can eliminate the eutectic phase transition. Both glycerol and alginate have strong hydration capability and significant effects on inhibiting ice crystals. It is essential to systematically study mixed preservation solutions.
To the best of our knowledge, the specific phase change behavior of glycerol aqueous solution, trehalose aqueous solution, and their mixtures is still unclear. Glycerol inhibits the interaction of hydrogen bonding between water molecules and makes nucleation of ice crystal hydrogen bonding interactions between water molecules difficult. Glycerol increases the viscosity of the water solution and decreases the diffusivity of water molecules from the solution to the ice crystal face. More importantly, glycerol molecules have competitive adsorption with water molecules on the crystal face, even occupying the surface lattice site and taking place as two or three water molecules. 25 This behavior can break the symmetry of the ice crystal face and prevent further growth.
Trehalose has a strong capacity for intermolecular interactions, making it easy to build cluster structures that can contain a glass phase and have a modest impact on neighboring and remote water molecules. 26 Meanwhile, trehalose has excellent glass-forming properties because of its different polymorphic forms. 27 The glass transition temperature of the freeze-concentrated trehalose solution is near −30°C. Therefore, the solution viscosity of trehalose rapidly increases during the freezing process to form a stable glass matrix that acts like a cocoon, which is another benefit, as an increase in viscosity might lead to reduced crystal growth. These benefits do not damage the cell structure.28,29 Thus, they have a promoting effect on vitrification.
Therefore, studying the extended thermal and kinetic property database is still needed. Differential scanning calorimetry (DSC) and cryostage are typical tools for studying cryobiology. In recent years, cryostage has been increasingly used for the study of thermodynamic nonequilibrium phase change, 30 evaluation of the inhibition of ice crystal growth using graphitic carbon nitride derivatives, 31 and evaluation of the effect of ions on ice recrystallization. 32
In this study, the external cooling method of liquid nitrogen is used first. After that, the thermodynamic nonequilibrium phase change of glycerol aqueous solution, trehalose aqueous solution, and their mixtures is explored. Finally, we measured and analyzed the growth of ice crystals for each component of the CPA of 0.4 M Tre +5% Gly w/v by cryomicroscopy. This provides comprehensive thermodynamic data for the scalable volume cryopreservation method, which uses it as a cryoprotectant.
Materials and Methods
Cryoprotective solutions
Trehalose (MW 342.30; Sinozyme, China) or glycerol (BC grade, Sangon, China) was dissolved in pure water to prepare different concentrations of trehalose aqueous solutions (0.2–1.5 M), glycerol aqueous solutions (5%–50% w/v), and trehalose-glycerol mixed solutions. All concentrations mentioned in this article were determined using the mass to volume ratio (w/v).
DSC under the external liquid nitrogen cooling
To understand the phase change of normal saline with trehalose and glycerol, we scanned the samples in DSC. Before experimentation, DSC (DSC 250, TA Instruments) was calibrated by scanning indium and sapphire. A high-precision analytical balance (ME55, METTLER TOLEDO) weighed 5.00 ± 1.00 mg of solution sample mass.
Distinguishing it from traditional constant rate cooling, the “Equilibrate” function is selected for the cooling program, and the temperature inside is cooled down to the target (−150°C) at the maximum cooling capacity of the instrument. During the following 5-minute equilibration period, the sample trays were quickly transferred to the DSC furnace with liquid nitrogen precooled in the cell culture dishes. After the equilibration period, all samples were rewarmed at the programmed constant rate (10°C/min). The sample trays were completely submerged in liquid nitrogen during the freezing period to prevent floating, as shown in Figure 1. In this article, the reading method of Tg is standardized as the half-height method instead of the inflection point method.
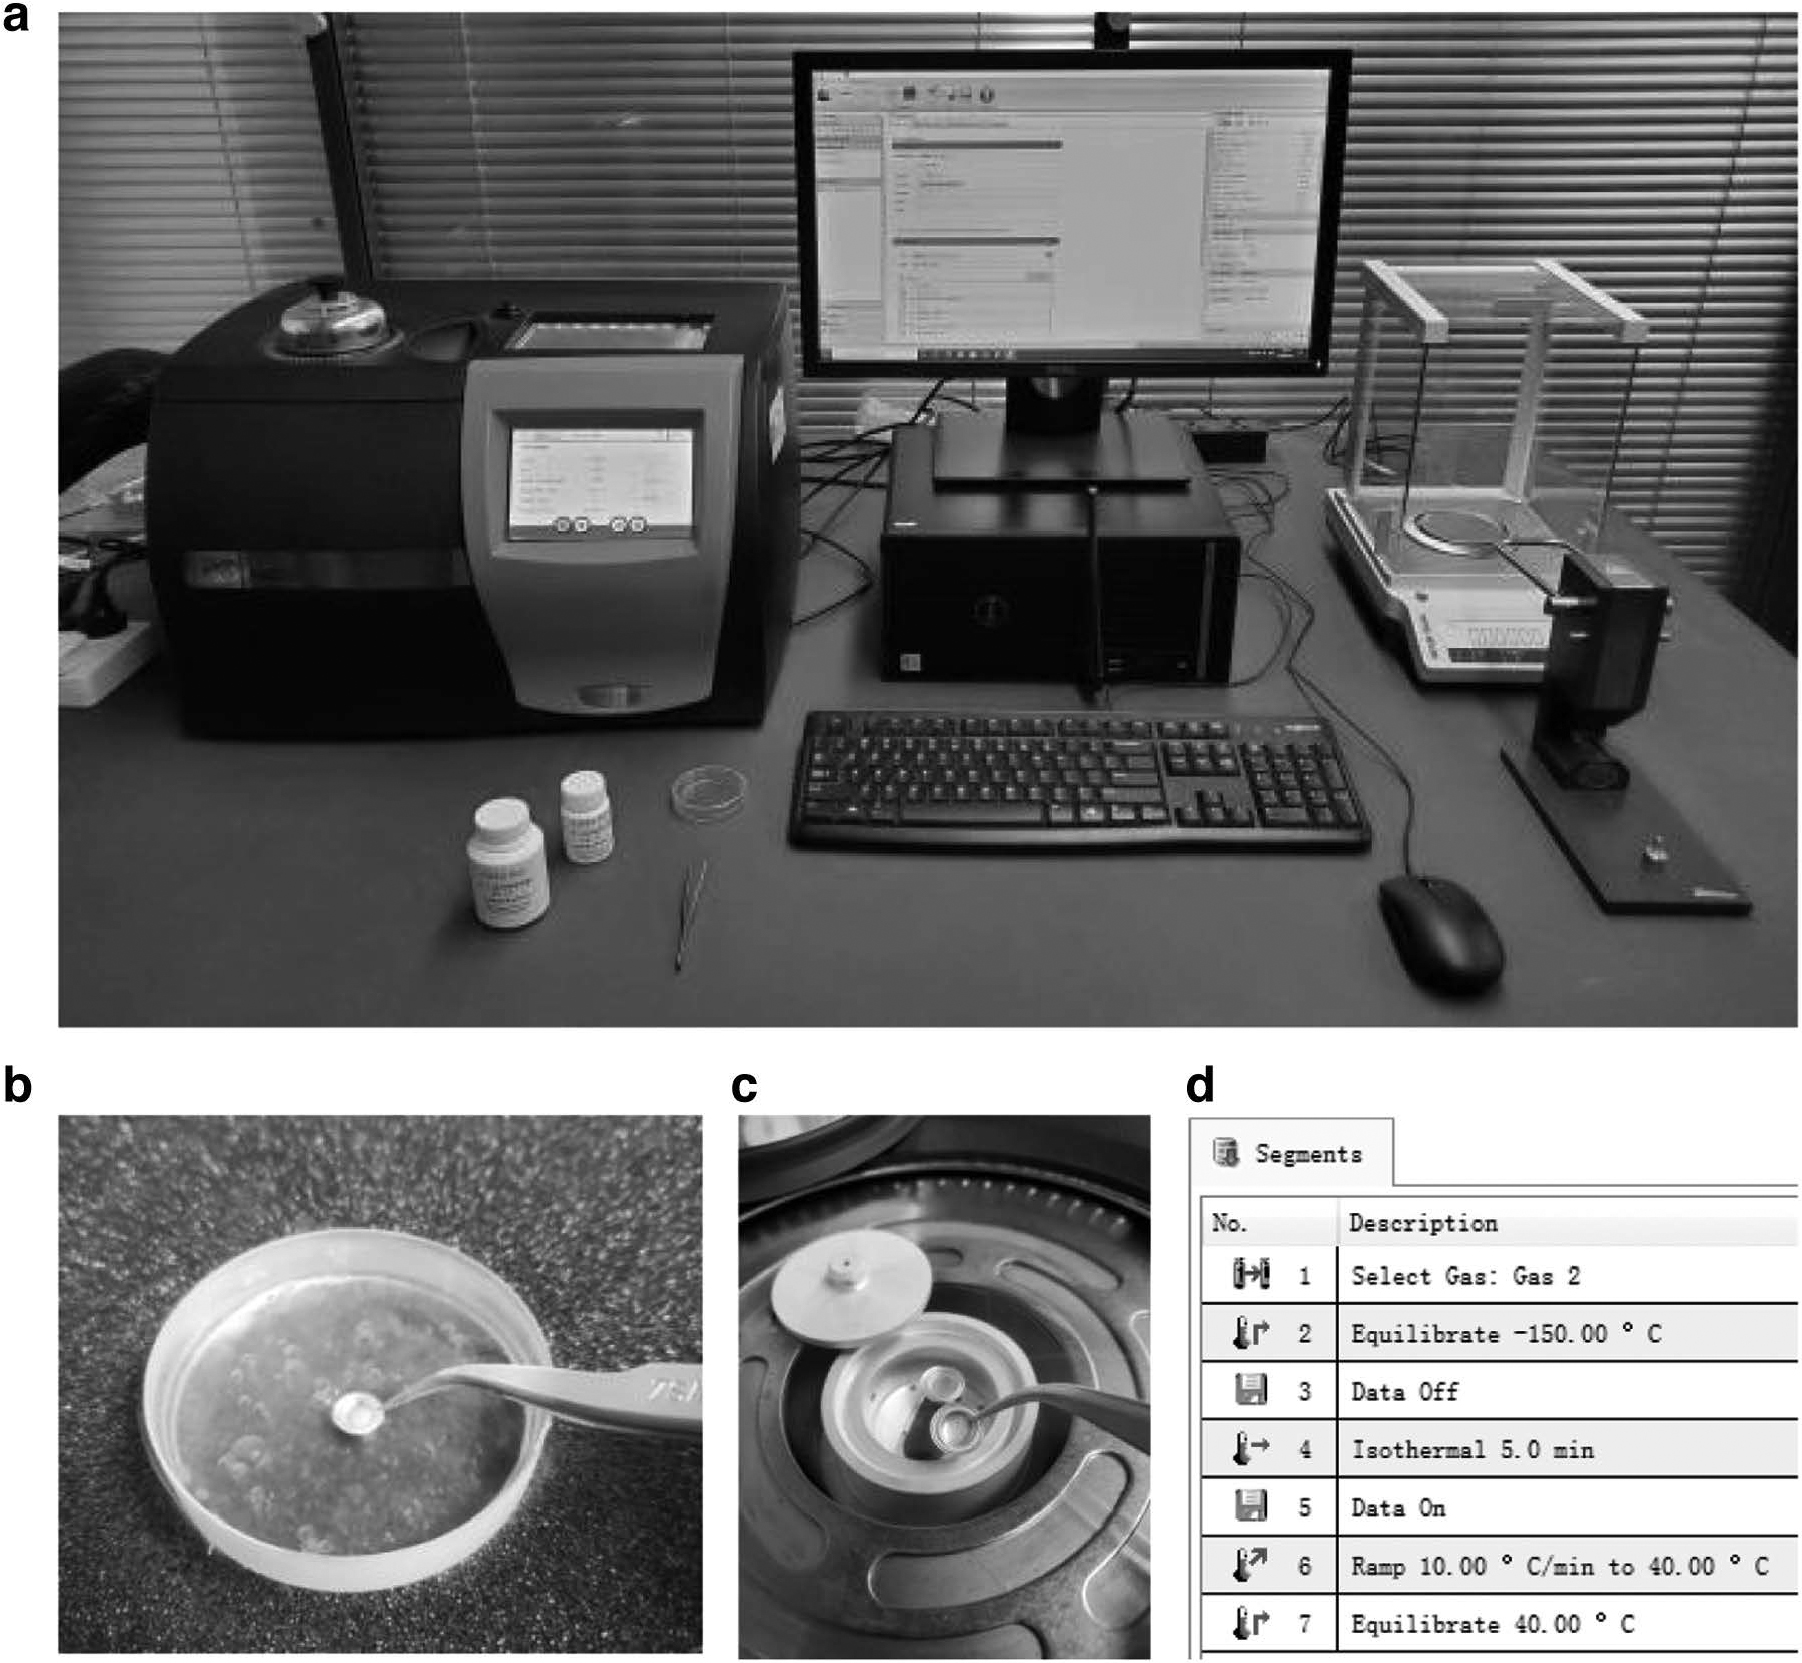
TA DSC 250 experimental platform.
We used scanning crystallization theory to study the devitrification kinetics under the external liquid nitrogen cooling method using Ozawa–Chen's and Kissinger's scanning kinetic model with the following equations:
Kissinger
36
:
where Q is the rate of rewarming (K/min), Tp is the peak temperature of devitrification (K), R is the molar gas constant (8.314
Cryomicroscopy under the external liquid nitrogen cooling
The cryomicroscope system consists of a vacuum cryostage (INSTEC, HCS421VXY), a temperature controller (INSTEC, mK2000B), a liquid nitrogen cooling pump (INSTEC, LN2-P8C), a Benchtop Chiller (INSTEC, C100W), a liquid nitrogen cooling system (INSTEC, LN2-D3), and an upright metallurgical biological microscope (YUESHI, YM710TR, Suzhou China) equipped with a camera (YUESHI, U920FL, Suzhou China).
Observation of phase change behavior by cryomicroscopy
During the rewarming of the phase change experiment, a minimal amount of 10 μm SiO2 microspheres was first added to the CPA. The addition of microspheres provided better control of the spacing between the slides, to ensure that the solution was not entirely compacted and to facilitate the determination of the focal plane of the solutions during the observation process. After mixing, 2 μL was dropped over the coverslips, which had been cleaned with alcohol. During the operation with the cryostage, the water cooling system was turned on in advance, and the temperature of the cryostage was rapidly cooled down to −150°C using the “Hold” procedure. The coverslips containing the CPA were completely immersed in liquid nitrogen for precooling. Then, the coverslip was quickly opened, and the sample was transferred to the cryostage. The rewarming rate was set to 10°C/min.
Analysis of the ice crystal growth rate of CPAs
Cryomicroscopy was used to observe the process of ice growth and test the growth rate of ice crystals from different CPAs. The samples were prepared in the same way for rewarming of the phase change experiment with liquid nitrogen cooling to −60°C at a cooling rate of 20°C/min when ice formation was achieved in the full field of view. Then, we used the precision X-Y micromanipulator in the slide table to fine-tune the position of the coverslip, ensuring that only a single ice nucleus was left in the field of view.
Avoiding the simultaneous growth of multiple ice nuclei would affect the calculation of ice crystal size. After obtaining a single nucleus, it was cooled to −60°C at a uniform rate of 20°C/min. The ice crystal growth experiment is observed with a 10 × objective, and the entire second cool-down is recorded with a camera. Finally, ice crystal dimensions were measured and analyzed using ImageJ. The distance between the center and the front of the ice crystals was used to assess the growth rates of the crystals quantitatively.
Ethical waiver
This thesis does not involve biological cellular experiments or clinical experiments that require ethical approval.
Results
The external cooling method with liquid nitrogen promotes the glass transition to improve the stability of glasses
The results of the devitrification kinetic analysis with 50% glycerol aqueous solution cooled by external liquid nitrogen cooling are shown in Figure 2. As the rewarming rate increased from 10°C/min to 80°C/min, the enthalpies of devitrification peaks were in the range of 25–28 J/g for all rewarming rates. And the melting peak enthalpy decreases from ∼60 to ∼50 J/g. The range of melting enthalpy is larger compared with devitrification crystallization enthalpy. Scanning crystallization theory was used to investigate the kinetics of devitrification under the external liquid nitrogen cooling method, and the results are shown in Table 1. It shows that the crystallization activation energy Ea of the 50% Gly (w/v) solution was higher compared with the 56.4% Gly (w/v) solution measured by the external liquid nitrogen cooling method. Therefore, all subsequent studies were based on the external liquid nitrogen cooling method.

Effect of maximum constant rate cooling and liquid nitrogen cooling method on the heat flow profile during rewarming.
Results of Activation Energy Calculation for Devitrification Crystallization of 50% Gly (w/v) Solution Under the External Liquid Nitrogen Cooling Method
Partial vitrification transition of low-concentration glycerol aqueous solution
Figure 3a and c show that the glycerol aqueous concentration only reaches above 45% to display a visible devitrification transition, while below 45% concentration, visible vitrification can only be seen by widening the Y-axis. The signal of the vitrification heat flow is clear for the 15%–40% Gly. The signal of the 5% group is present, but not obvious. In addition, the glass transition temperatures (Tg) for 5%–40% Gly are all ∼−100°C (Fig. 3b). This result demonstrates that Tg is the glass transition temperature of the maximally freeze-concentrated sample and does not vary with solution concentration at low concentrations.
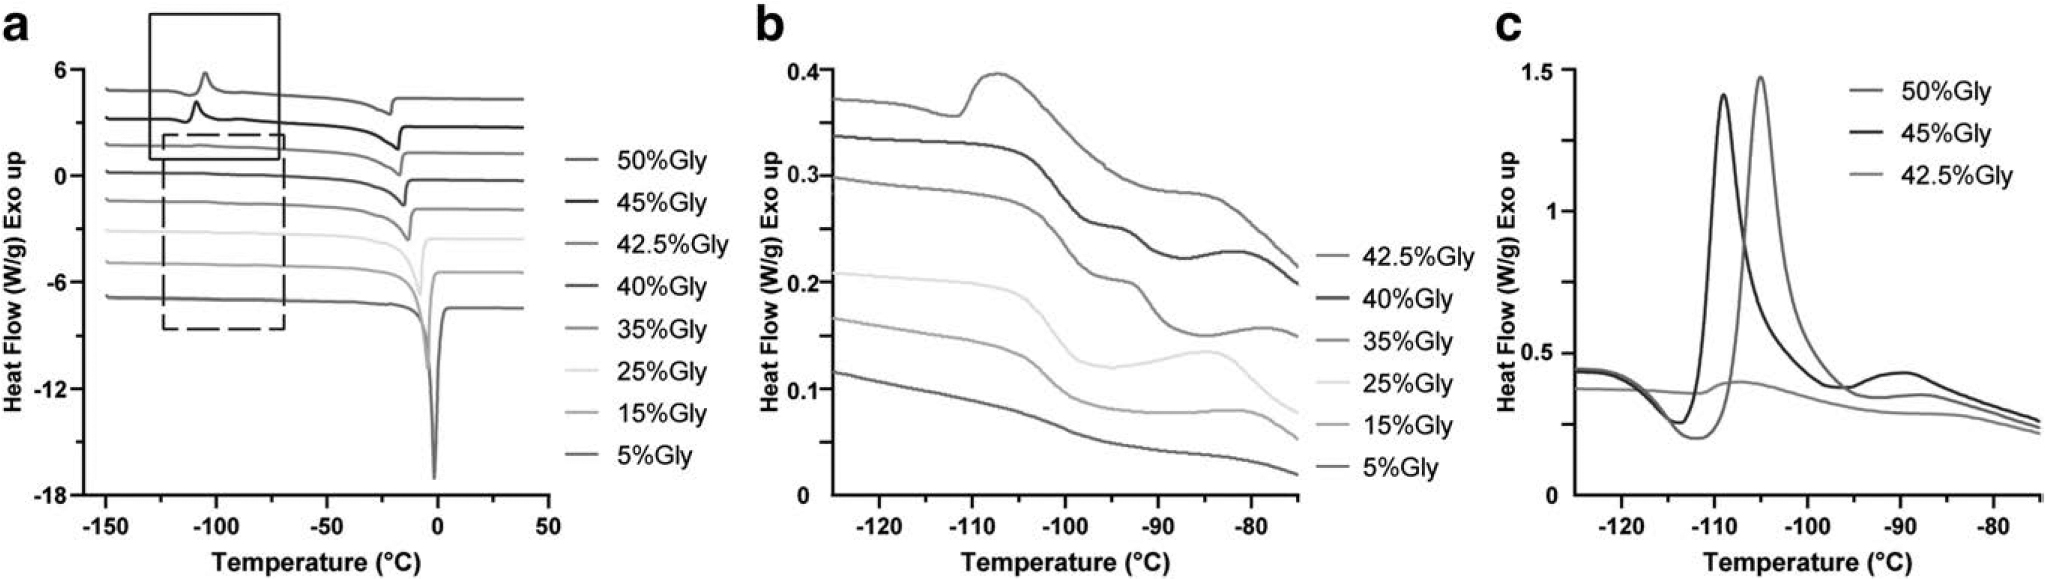
DSC thermograms of different concentrations of glycerol during rewarming.
Partial vitrification transition of trehalose aqueous solution
The external liquid nitrogen cooling method is used in DSC to test the heat flow curves of the rewarming process for different concentrations of trehalose. According to the solubility of trehalose at room temperature (43.0 g/100 mL), we set the experimental concentration of trehalose to a maximum of 1.2 M. As shown in Figure 4, compared with 5% Gly, there was no obvious devitrification even if the trehalose concentration was raised to 1.2 M. When the Y-axis was enlarged, the DSC analysis of the trehalose solutions at each concentration was performed. The measured data of thermal events at each concentration are shown in Table 2.
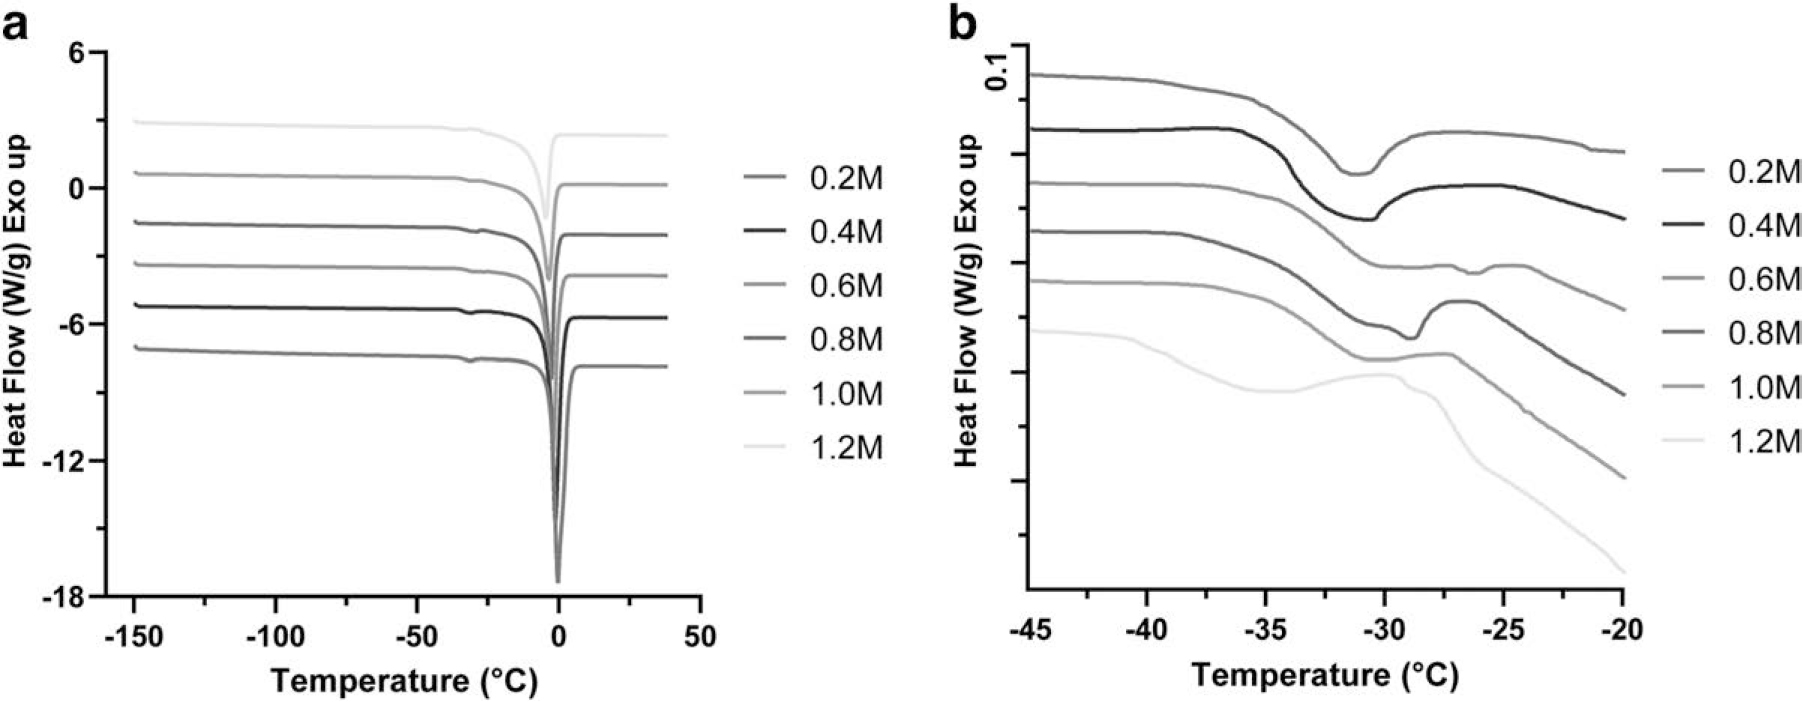
DSC thermograms of different concentrations of trehalose during rewarming.
Results of Thermal Event Data Measured Using Differential Scanning Calorimetry for Trehalose Aqueous Solutions
(−) Indicates no devitrification; (+) indicates the presence of devitrification.
Effect of different concentrations of trehalose on the vitrification of trehalose-glycerol aqueous solutions
As shown in Figure 5a, the addition of 5% glycerol to different concentrations of trehalose aqueous solution has little impact on the thermal flow curve of the rewarming process. It is similar to Figure 4a; there is no devitrification phenomenon. When the Y-axis was further enlarged (Fig. 5b), a partial glass transition was also observed for different concentrations of trehalose-glycerol solutions. However, the glass transition temperature changed significantly compared to the pure trehalose solution and in the opposite pattern.
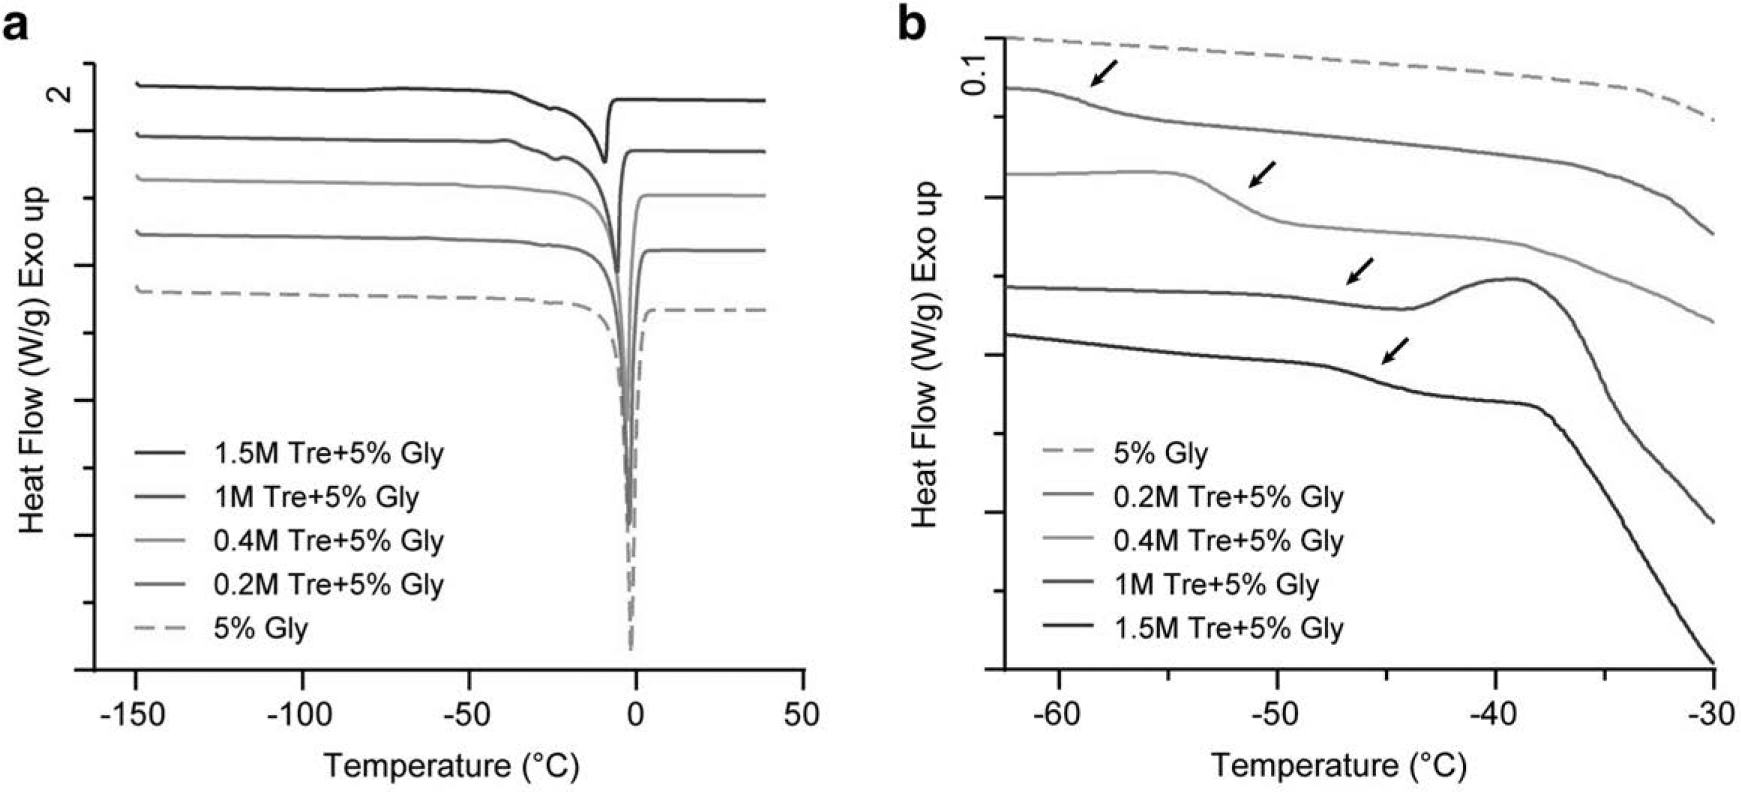
Heat flow curves of the rewarming process of trehalose-glycerol aqueous solutions with different concentrations.
First, the Tg’ of the pure trehalose solution decreased with the increasing concentration, but after adding 5% Gly, the Tg’ increased with increasing concentration. Cryomicroscopic views of 5% Gly, 0.4 M Tre, and 0.4 M Tre +5% Gly under liquid nitrogen cooling are shown in Figures 6 and 7. The ice formed by 5% Gly is larger in size and smaller in number. Furthermore, there are very thin ice nuclei on the surface, making the ice rougher and three-dimensional. The whole picture is foggy, but the fog will dissipate with increasing temperature. The ice formed by 0.4 M Tre +5% Gly is more similar to the ice of 50% Gly cut into numerous pieces, which has an overall transparent and flat appearance. We believe that 0.4 M Tre +5% Gly should be more likely to form partial vitrification.
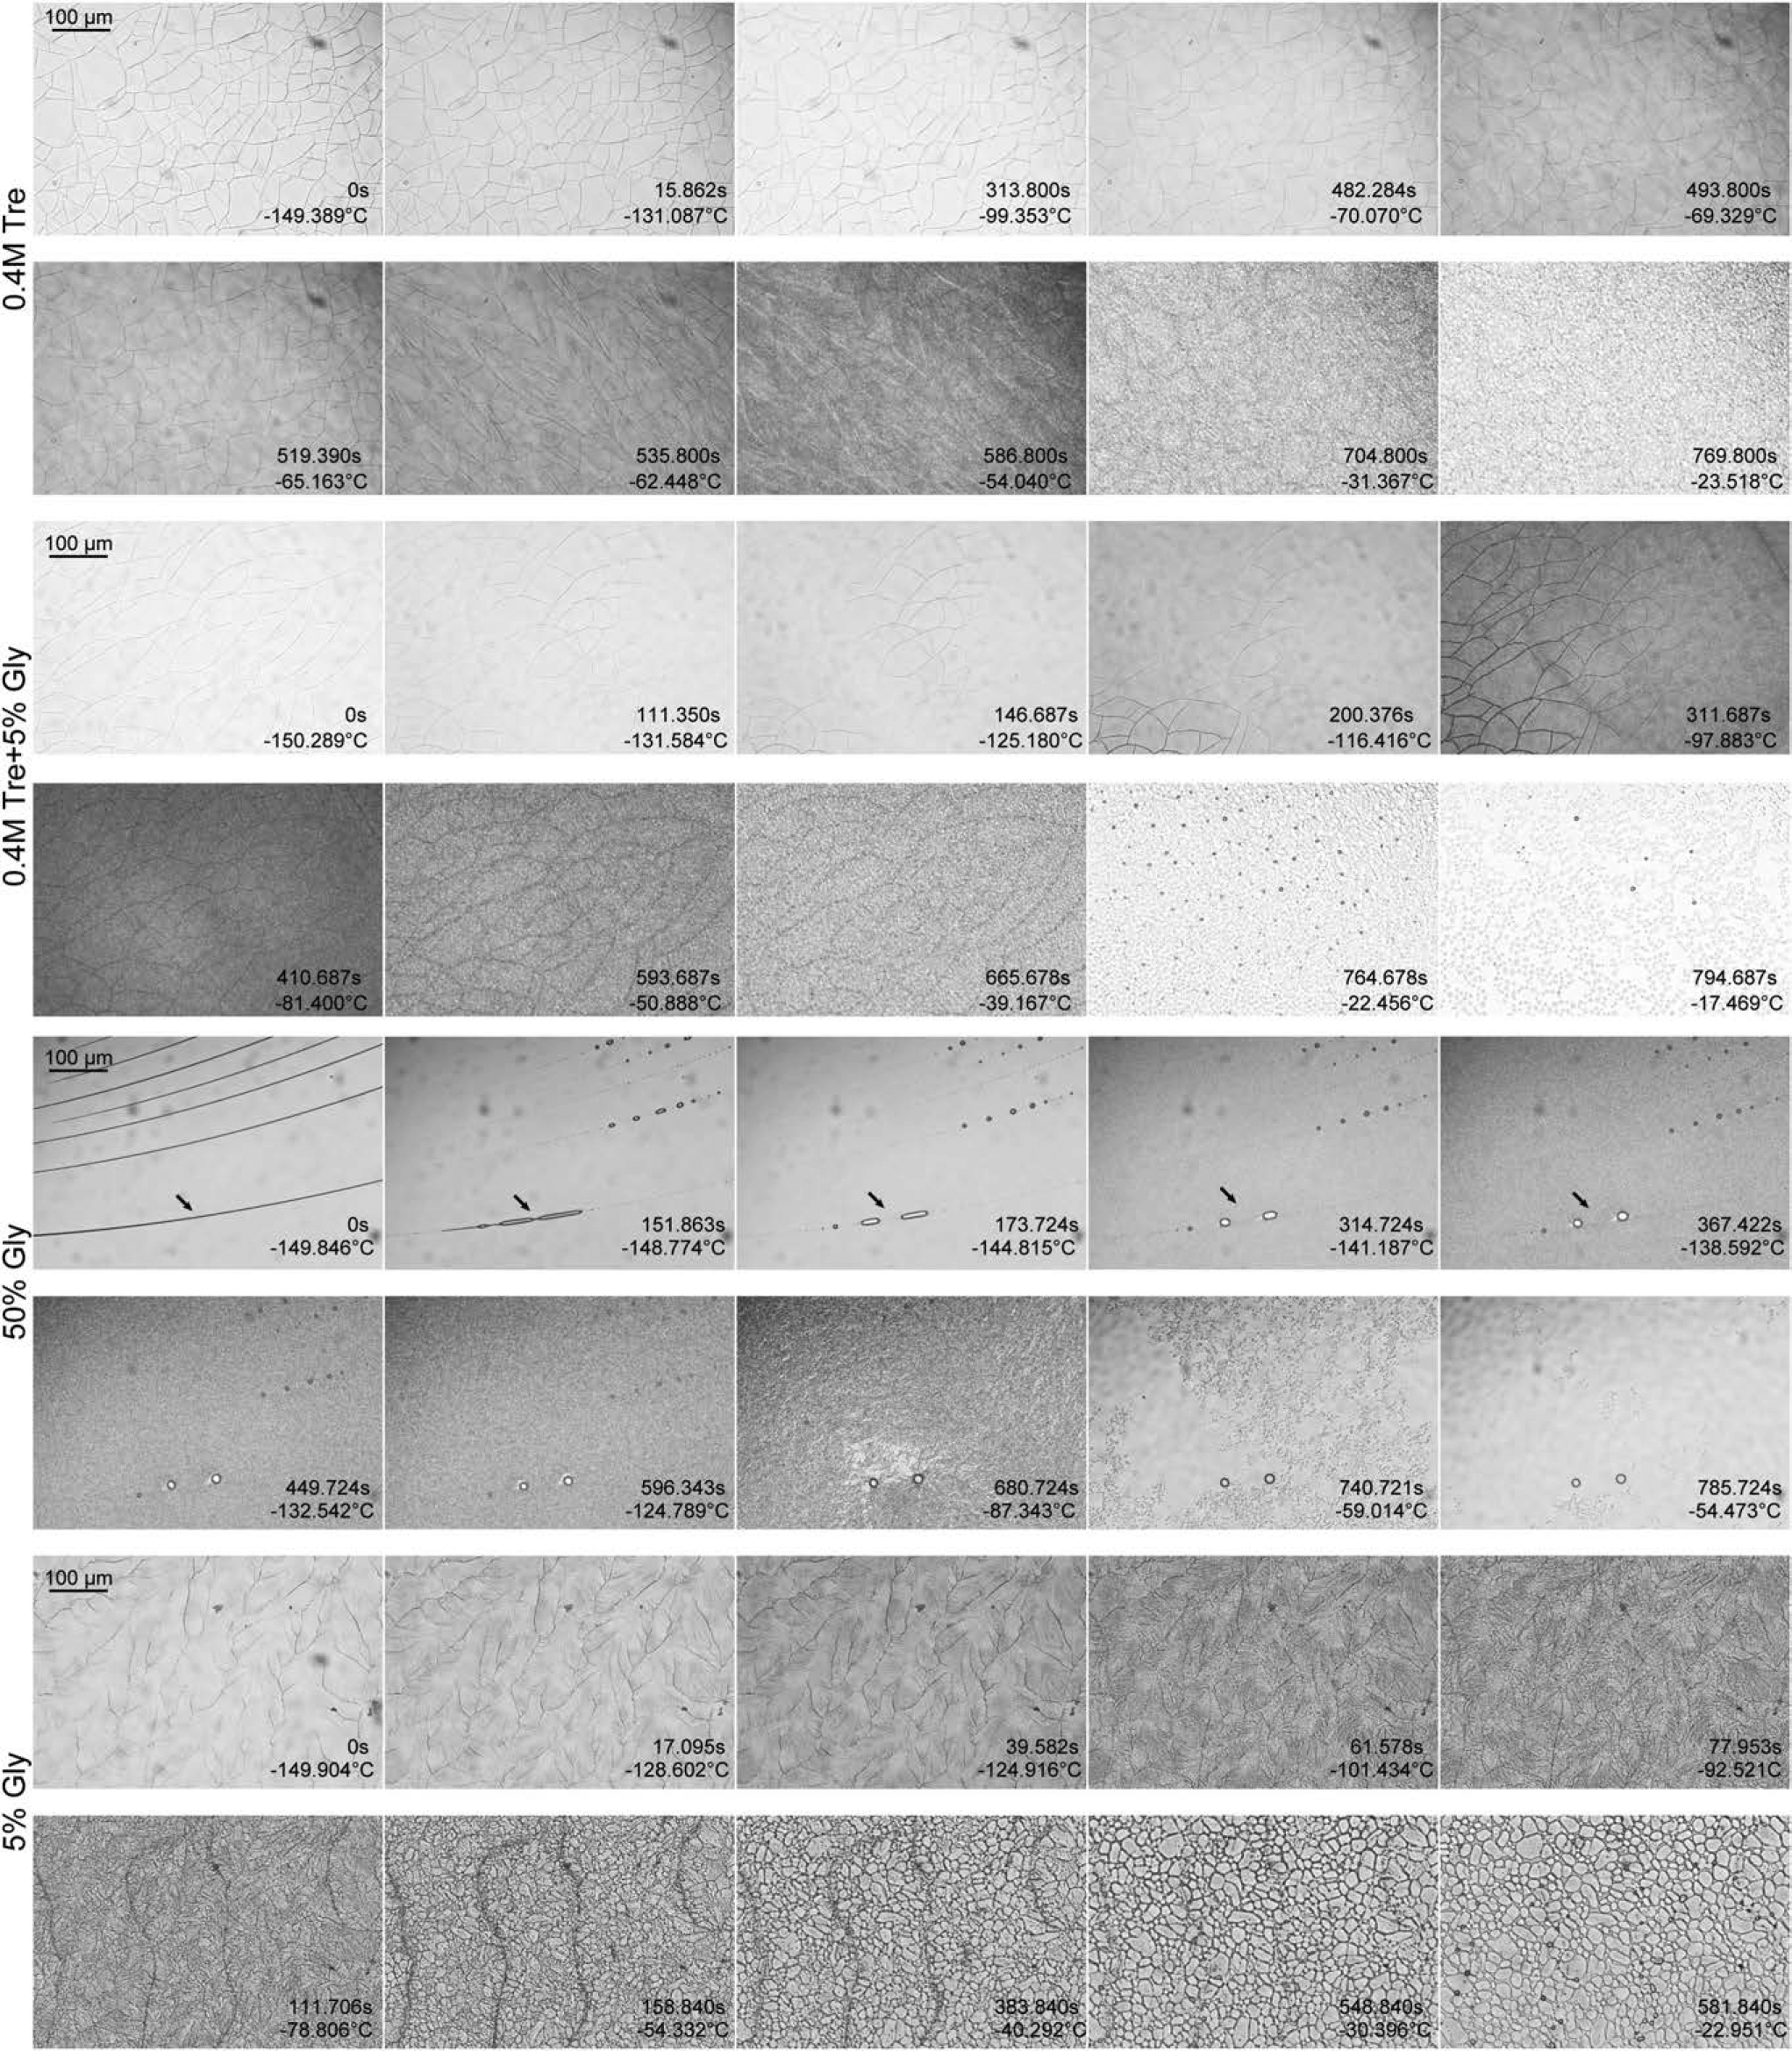
Photos of ice crystal growth on the cryostage during rewarming with different protectants.
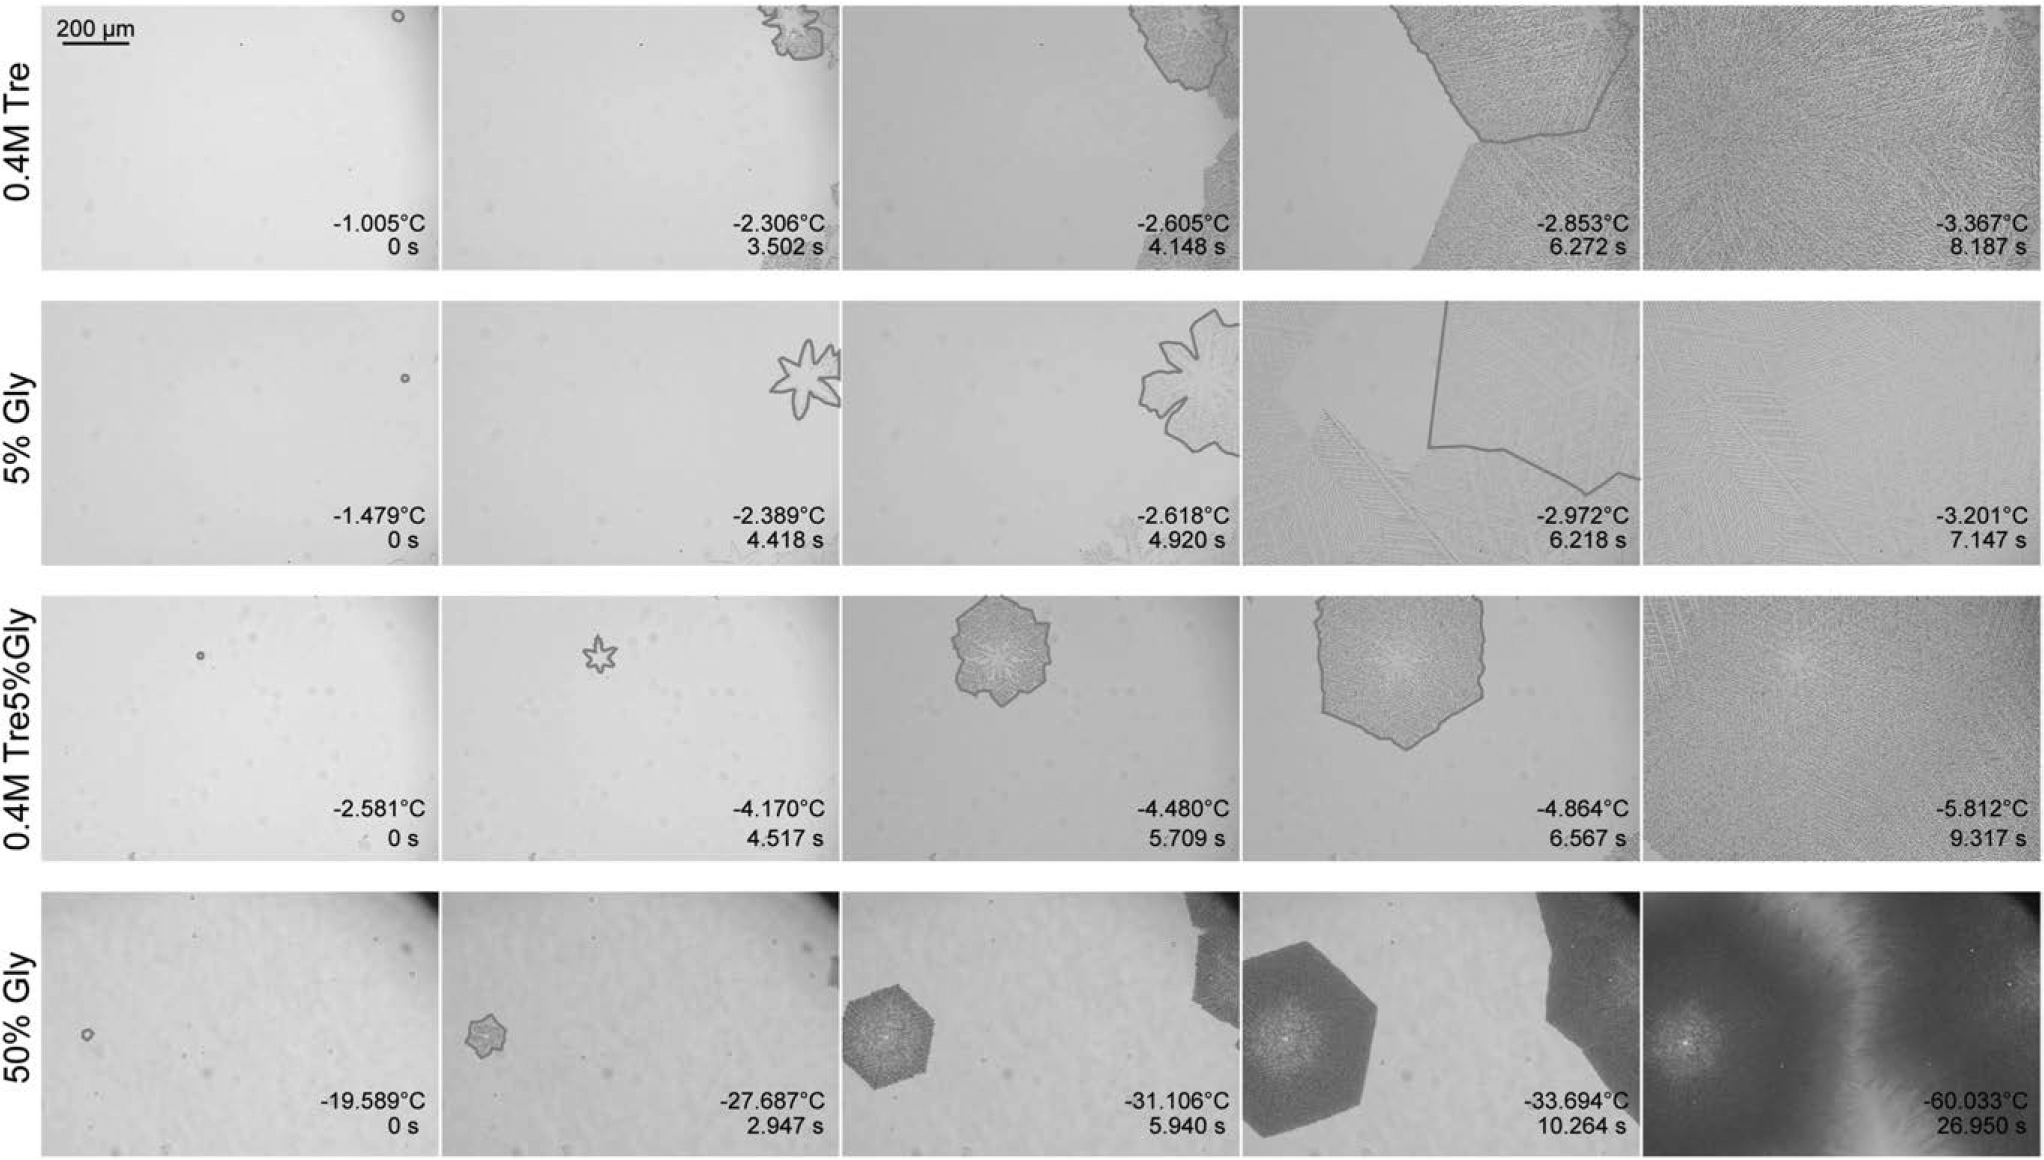
Photos of ice crystal growth during rewarming in pure water with 0.4 M Tre and 0.4 M Tre +5%Gly.
Rates of ice crystal growth during rewarming
As the concentration of CPA increases, the growth rate of ice crystals decreases. Since the osmolarity of 5% Gly is slightly higher than 0.4 M Tre, the growth rate of 5% Gly ice crystals is overall slower than 0.4 M Tre. However, in the later stage of ice crystal growth, the growth rate of 5% Gly ice crystals may be faster than 0.4 M Tre (Fig. 8). The growth rate of three relatively low concentrations of CPAs (0.4 M Tre, 5% Gly, and 0.4 M Tre +5% Gly) is exponential with time; in other words, the growth rate is slower then faster. According to the statistical data, the growth rate of ice crystals of 50% Gly is more like a linear relationship. Usually, ice crystal growth rates are exponential with temperature, as seen in the literature. We have not yet found a suitable reason to explain this phenomenon.
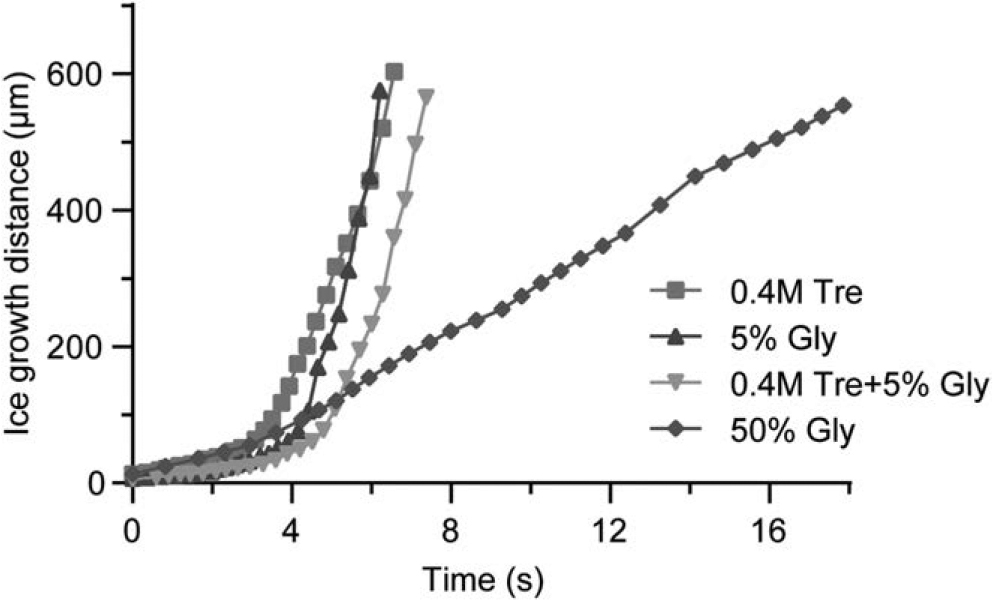
Scatter plot of ice front growing distance as a function of time.
Discussion
The data obtained in this study were performed by DSC and cryomicroscopy using the external liquid nitrogen cooling method. It can be seen clearly from these figures that a devitrification crystallization exothermic peak follows the glass transition, and the interval between the two thermal event signals is larger as the rewarming rate increases. The enthalpies of the devitrification peaks were in the range of 25–28J/g for all rewarming rates. For successful experimental vitrification cryopreservation, the devitrification phenomenon should be avoided during the rewarming process, in addition to increasing the CPA concentration or accelerating the cooling rate. Devitrification is understood as a process of rewarming.
The glass body gradually changes into supercooled liquid with increasing temperature. At this time, the temperature range of the supercooled liquid remains within the crystallizable temperature range, which will lead to the phenomenon of exothermic crystallization. The ice crystals that appear in devitrification can gradually melt until the temperature rises to the melting point. In addition, there is another understanding of devitrification, which is that the glass formed during the cooling process almost always contains a high density of ice nuclei. Although the faster cooling rate inhibits the ice nuclei during the cooling process and does not grow beyond the critical ice nuclei size, they will continue to grow to form harmful ice crystals once they enter the dangerous temperature zone during rewarming.
We used scanning crystallization theory to study the devitrification kinetics under the external liquid nitrogen cooling method. The higher the activation energy (Ea), the greater the energy required for the growth of ice crystals during devitrification. This results in increased difficulty in ice crystal growth, ultimately contributing to higher stability in the glasses. 37 The crystallization activation energy increases as the concentration of CPA increases because crystallization becomes more and more difficult as the concentration increases.
The Ea of the 50% Gly (w/v) was measured by the external liquid nitrogen cooling method, and it was higher compared with the 56.4% Gly (w/v) solution (Table 1). This confirms that the external liquid nitrogen cooling method significantly increases the cooling rate, effectively promotes the vitrification transition, and improves the stability of the glass. This result is consistent with the basic knowledge that vitrification can be achieved at ultra-fast cooling and verifies the superiority of using liquid nitrogen for cooling in this study. The devitrification amount is related to time and temperature, and the devitrification peak, Td, corresponds to the temperature, where d2H/dt 2 = 0 on the DSC thermogram; H is the heat received by the sample. Based on the derivation, Td increases as the warming rate increases. 38
The glycerol concentration in the 50% Gly solution is too high for routine biospecimen cryopreservation. Although glycerol is a classical nontoxic protectant, its transmembrane water transport capacity is much lower compared with water. Therefore, adding glycerol to biospecimens at high concentrations can result in significant osmotic damage, leading to cell death due to overcontraction. Therefore, we are more interested in the thermophysical properties of low concentrations of protective agent solutions than in high concentrations.
In the heat flow graphs tested, we measured the heat flow curves of glycerol aqueous solutions from 5% to 50%. Figure 3 shows that the 40% concentration was the critical point. Under this concentration, there was a smaller signal of vitrification transition during rewarming, but there was no devitrification after the end of vitrification. This indicates that partial vitrification may have occurred; in other words, bulk ice formation occurred during rapid cooling when the sample was plunged into liquid nitrogen. During the freezing process, the solution crystallizes a lot, and little vitrification appears in the remaining part of the solution due to the increased concentration. However, the glass body also contained ice crystals, which would directly affect the cells' survival after crystallization of the solution.
However, it is interesting to note that a second consecutive glass transition step is also observed for 35% Gly and 40% Gly. Although it has been previously noted that if the temperature of the second step signal (−75°C in the literature) is higher than the glass transition temperature of completely amorphous glycerol (Tg of pure glycerol solution, −78°C in the literature), then even if a step signal occurs, it cannot be considered to be glass transitioning. 39 However, as previously tested, the second glass transition temperatures for 35% Gly and 40% Gly are significantly lower than the Tg of 100% Gly, −82°C to 83°C, so a second glass transition may have occurred here.
The available literature shows that the magnitude of the Tg’ of trehalose should not vary significantly with the concentration, whose maximum freezing concentration is ∼80% w/w. However, Tg’ measurable data vary widely, and values of 20°C–40°C have been reported.40–43 The results of Nicolajsen and Hvidt showed that even though the trehalose aqueous concentration of 5.91% w/w increased to 39.98% w/w, the range of Tg’ values still fluctuated between −29.9°C and −31.5°C, 44 and Table 3 gives more of the literature measurements of the maximum freezing concentration glass transition temperatures of trehalose.
Literature Measurements of the Maximum Freezing Concentration Glass Transition Temperature of Trehalose
Table 2 shows the data obtained in this study, and by comparing it with the literature data, our data are in the range included in the literature data. When the concentration is lower than 1.2 M, Tg’ changes less. When the concentration is 1.2 M, although saturation has not been reached in the calculation, by comparing it with the 1.5 M group, we hypothesize that 1.2 M may have reached saturation in reality.
A study by Green and Angel showed that at the same water content, the trehalose system has a significantly higher glass transition temperature than any other disaccharide or glycerol. 45 This also coincides with our conclusion. Furthermore, DSC experiments of trehalose reflected a significant increase in the vitrification signal with increasing trehalose concentration, but no significant devitrification signal appeared even when the concentration was increased to near saturation concentration of 1.2 M (41.072% w/v). Compared to 42.5% Gly at the same cooling program, the trehalose aqueous solution was less capable of complete vitrification compared to the glycerol aqueous solution.
However, after adding 5% Gly, the Tg’ increased with increasing concentration. The specific Tg’ was −57.09°C ± 0.92°C for 0.2 M Tre +5% Gly, −51.08 ± 0.92°C for 0.4 M Tre +5% Gly, and −46.77°C ± 0.23°C for 1 M Tre +5% Gly. The lower the trehalose aqueous solution concentration was, the more Tg’ decreased with the addition of 5% Gly.
The higher the trehalose solution concentration was, the less Tg’ decreased with the addition of 5% Gly. Therefore, there exists a possibility that the vitrification patterns of trehalose and glycerol are not the same. Under the low concentration of trehalose, glycerol's hydration and vitrification ability is more obvious in the vitrification process of the solution. Under the high concentration of trehalose, the vitrification ability of trehalose was higher, with stronger hydration, and the water molecules formed more cluster structures with the molecules of trehalose so that the hydration of glycerol was subjected to some inhibitory effects. Therefore, the change in Tg may not be so significant.
Finally, since the osmolarity of 5% Gly is slightly greater compared with 0.4 M Tre, the growth rate of 5% Gly ice crystals is slower overall compared with 0.4 M Tre. The slower growth rate of 0.4 M Tre +5% Gly can obtain more dehydration time for the cells, which is beneficial for the cryopreservation of cells. Through the three solutions and growth dynamic characteristics derived from the observation, we believe that 0.4 M Tre +5% Gly should be more likely to form partial vitrification, and it is also obvious that during the cooling process, it did not produce ice nuclei, but blocks of glasses. This may be due to the lower concentration of the solution, and the formation of glasses is not strong enough.
Therefore, compared with 5% Gly and 0.4 M Tre, 0.4 M Tre +5% Gly showed a more uniform devitrification transition throughout the rewarming process than 50% Gly. The devitrification of the solution was not observed in the DSC, which may be attributed to the fact that the cooling rate of the DSC sample tray immersed in liquid nitrogen was still slower than the cooling rate of the two thin coverslips.
Conclusion
To successfully implement and further optimize the cryopreservation of biological samples, it is necessary to understand the thermal properties of biological materials or protectant solutions involved in the freezing process. In this study, the thermodynamic nonequilibrium phase transition of glycerol, trehalose, and glycerol-trehalose aqueous solutions during rewarming was investigated using a method of external liquid nitrogen cooling. By utilizing this method, we can derive experimental conclusions that closely mimic the process of actual biological rapid cooling. Through DSC and cryostage observations, we conclude that,
The external cooling method with liquid nitrogen can effectively compensate for the lack of cooling performance in the instrument (TA DSC 250).
The partial vitrification of glycerol and trehalose solutions at low concentrations was also systematically investigated by external liquid nitrogen cooling. It was found that the glass transition temperature Tg’ of trehalose aqueous solutions and glycerol aqueous solutions hardly varied with low concentrations. The vitrification ability of low concentration of trehalose solution was more affected by a small amount of glycerol. In contrast, the vitrification ability of a high concentration of trehalose solution was more stable.
The dynamic study of ice growth properties in three solutions shows that trehalose-glycerol aqueous solution has a better ability to inhibit ice growth. The results of this study can provide reliable thermodynamic data to support a low concentration of glycerol RBC cryopreservation protocol based on 0.4 M Tre +5% Gly cryoprotectant.
Footnotes
Acknowledgments
The authors thank Faryal Farooq for her help in editing the article.
Authors' Contributions
X.J.W. designed and completed most of the experiments and data analysis and wrote the article. L.X.S. conceived the experiments. G.Z. directed the research and edited and supervised the article. All authors discussed the study results and participated in editing and revising the article.
Author Disclosure Statement
No conflicting financial interests exist.
Funding Information
This work was supported by the Anhui Provincial Natural Science Foundation for Distinguished Young Scholars (No. 2108085J37).