
Abstract
Background:
Serum indices (hemolysis, icterus, and lipemia; HIL) are known to impact clinical chemistry assay results. This study aimed to investigate the impact of HIL indices on serum metabolite profiles and the association of serum metabolite levels with pre-analytical factors of serum samples.
Methods:
A cohort of serum samples (n = 12,196) from the Korean Genome and Epidemiology Study (KoGES) was analyzed for HIL indices and the pre-analytical variables (SPRECs) which were generated in the process of serum collection. We further performed targeted metabolomics on a subset comprising hemolyzed (n = 60), icteric (n = 60), lipemic (n = 60) groups, and a common control group of non-HIL samples (n = 60) using the Absolute IDQ p180 kit.
Results:
We found 22 clinical chemistry analytes significantly associated with hemolysis, 25 with icterus, and 24 with lipemia (p < 0.0001). Serum metabolites (n = 27) were associated with all of hemolysis, icterus, and lipemia (p < 0.05). The PC ae C36 2 had exhibited a significant association with pre-analytical factors corresponding to the third (pre-centrifugation delay between processing) and sixth (post-centrifugation) elements of the SPREC.
Conclusions:
This study showed the association of the serum index and pre-analytical factors with serum metabolite profiles. In addition, the association of pre-analytical factors with serum metabolite concentrations would corroborate the utility of SPRECs for the quality control of biobanked serum samples.
Introduction
More than two decades ago, the National Biobank of Korea (hereinafter referred to as NBK) started collecting human bioresources from population-based cohort studies at the Korea National Institute of Health.) Since then, the NBK has expanded its role as a nationwide central hub for collecting and managing human bioresources from population-based to disease-based biobanks. Currently, NBK is recognized as the representative institution for bioresource management in Korea, storing a significant quantity of over 10 million sample vials derived from more than 450K participants for various national cohort studies. 1 Serum samples are a major portion of biobanked materials in the NBK. The NBK has employed serum indices and SPRECs for the quality control of serum samples. The quality of the serum samples can substantially impact downstream molecular applications such as clinical diagnostic tests or proteo-metabolomic analyses. However, no gold standard of quality control methods exists for validating serum quality.
Serum indices of hemolysis, icterus, and lipemia can impact the outcomes of clinical examinations. Hemolysis is defined as the destruction of blood cells, resulting in the release of hemoglobin and various substances present within red blood cells into the serum. It is known that hemolysis can affect the serum concentrations of lactate dehydrogenase, calcium, magnesium, total protein, AST(GOP), ALT(GPT), phosphate, creatine kinase (CK), LDL, γ-GTP, and alkaline phosphatase. 2 The lipemic index indicates the presence of lipemia, which occurs if the individual does not fast appropriately before blood collection or if blood triglyceride levels increase for various reasons. Lipemia can affect bilirubin values or electrolyte values owing to increased absorbance. 3 Icterus can falsely increase bilirubin levels, whereas lipemia can interfere with triglyceride and cholesterol tests. If total bilirubin levels are higher (≥10 g/dL), this is significant to the icterus index. Furthermore, total bilirubin can affect triglycerides. 4
Biobanks often encounter serum samples with varying levels of HIL (hemolysis, icterus, and lipemia) measurements. However, there has been only a few studies for the quality control of biobanked serum samples.5,6 Limited research has been conducted to assess the utility of HIL indices for serum sample quality control. Furthermore, no studies have been reported on the associations between HIL indices and the Standard PREanalytical Code (SPREC). Here we report that the HIL indices are associated with a serum metabolite profile of which some metabolites are associated with pre-analytical factors.
Materials and Methods
Study participants
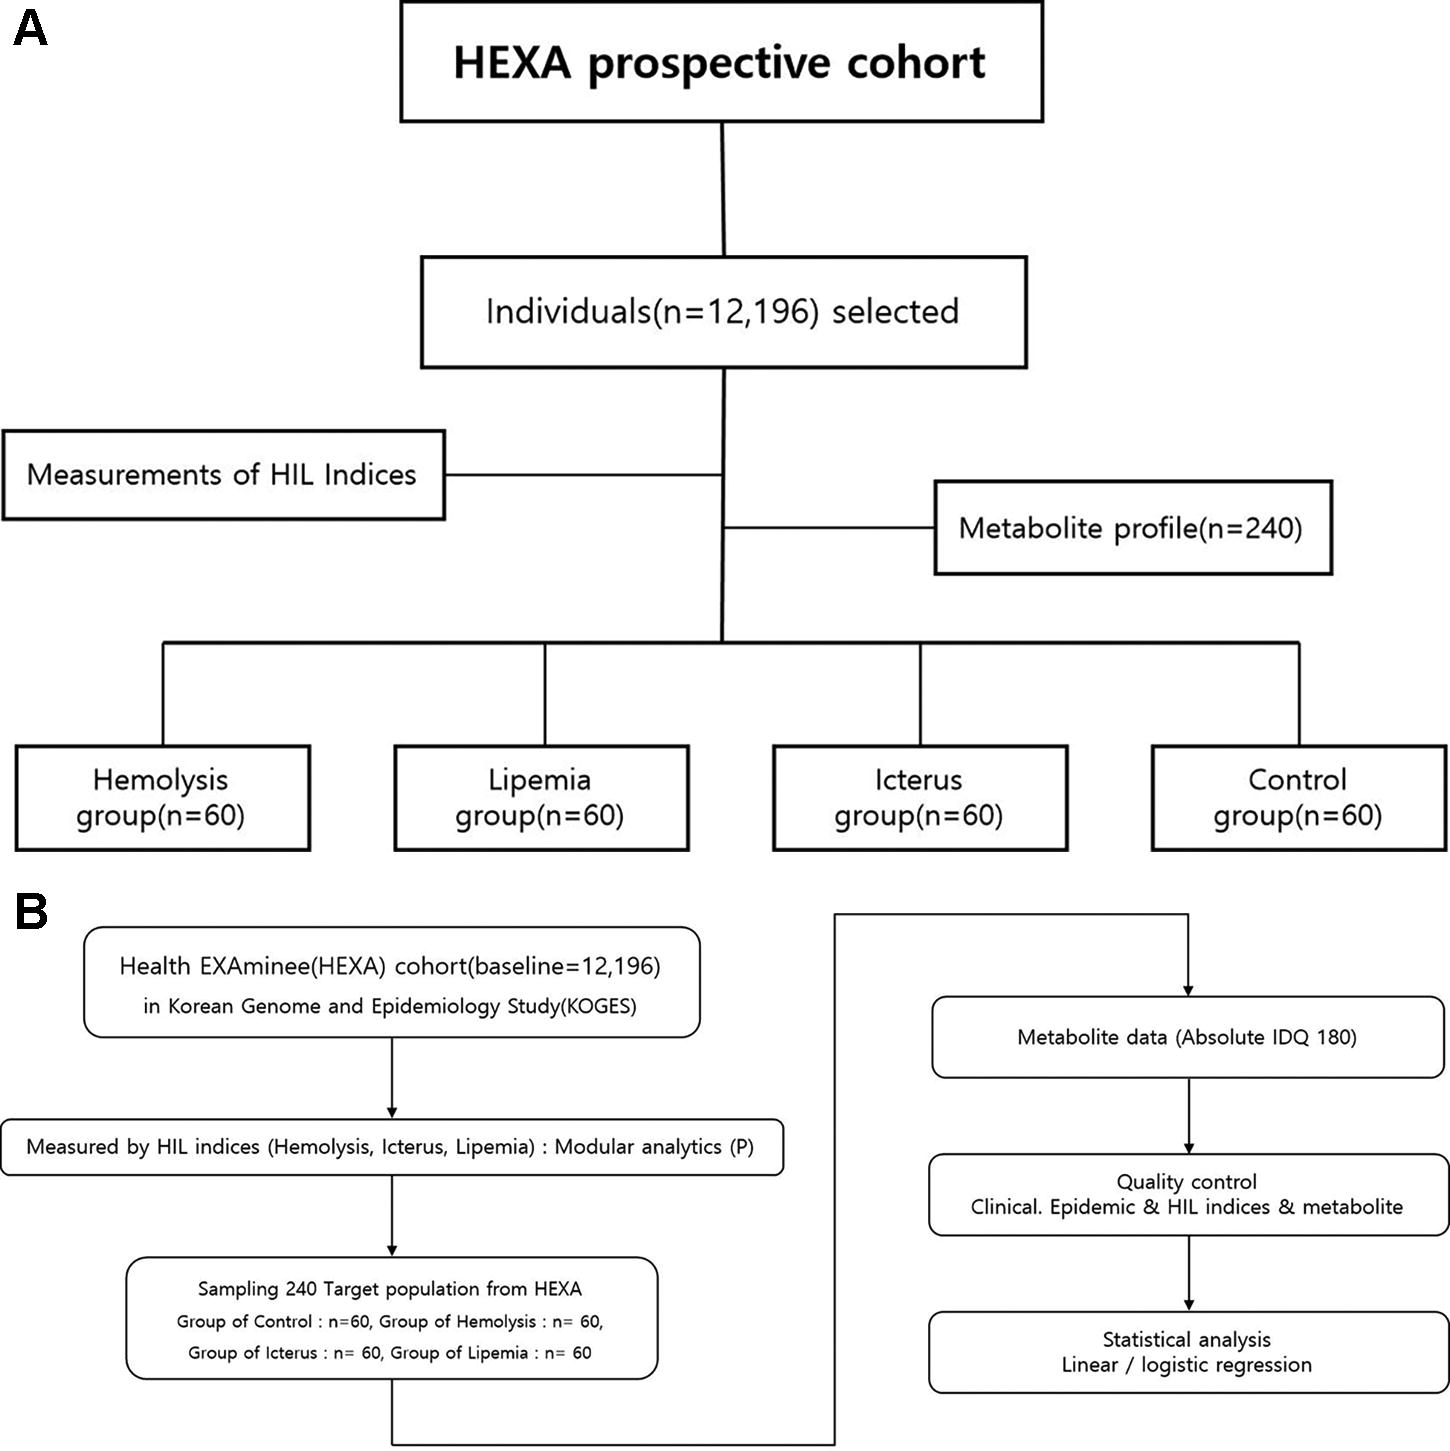
The clinical laboratory data used in this study was obtained from the Health EXAminee (“HEXA”) cohort, which is a prospective population-based study as part of the Korean Genome and Epidemiology Study (“KoGES”). 7 The HIL indices and pre-analytical variables (SPRECs) of serum samples were also obtained from the HEXA participants (n = 12,196). Metabolite measurements and LC-MS/MS analysis (Absolute IDQ p180) were conducted on a subset of selected participants (n = 240) from the HEXA population (baseline, n = 12,196). These 240 individuals were chosen to represent four groups of high hemolysis (n = 60), high icterus (n = 60), high lipemia (n = 60), and a control group (n = 60) which were matched for age and sex (Fig. 1A, B).
Study scheme: Target population
The study protocol was approved by the Institutional Review Board (IRB) of the Korea Disease Control and Prevention Agency (KDCA) (IRB approval number: 2017-09-01-PE).
Case–control criteria and sample selection
For this study, we focused on selecting 12,196 participants who had serum indices measured using a specific single instrument (Modular Analytics, Roche Diagnostics) for measuring the serum index. Of these serum samples from 12,196 participants, we further selected a total of 240 samples from participants with hemolysis (n = 60), icterus (n = 60), lipemia (n = 60), and common control (n = 60) for the case-control study. For example, the case groups of hemolysis, icterus, and lipemia were selected to include the top highest 60 measurements of hemolysis, icterus, and lipemia out of 12,196 participants, respectively, whereas the common control group was selected to include serum samples without any of hemolysis, icterus, and lipemia. To justify our sample size of a total 240 samples (H = 60, I = 60, L = 60 vs control = 60), we performed a power analysis using G-power software (release 3.1.9.3) with the assumption of effect size of 0.35, a significant level of 0.05, and a power of 0.75. With an anticipated analysis failure rate of 10%, the desired sample size was calculated to be about 60 samples for each case group. The common control group was also matched with age and sex to each case group of hemolysis, icterus, and lipemia.
Quality control of metabolites (metabolite profiling)
In this study, we performed the targeted metabolomic study using the commercial Absolute p180 kit. The absolute IDQ p180 kit is an LC-MS/MS-based assay for the targeted metabolomics the simultaneous identification and quantification of over endogenous 180 metabolites in biological samples. The procedure for preparing and confirming the quality control was carried out following the method outlined in Lee’s article. 8 The results of the quality control assessment were conducted for metabolites using the same methodology. 8
To ensure optimal data quality control, we applied three criteria to our metabolites: (1) the coefficient of variation (CV) for the metabolites <15%, (2) measured metabolite concentrations ≥50%, and (3) missing value <20%. 8 For quality control criteria regarding metabolites, the CV can have a critical value depending on the data distribution.8,9 Following the quality control based on the mentioned criteria, 132 metabolites were finally selected to analyze the associations between HIL indices and metabolite profiles.
Statistical analyses
We performed statistical analyses using SAS version 9.4 (SAS Institute Inc., Cary, NC). The metabolomics data were normalized using log transformation and analyzed using analysis of variance (ANOVA), Student’s t-test, and generalized linear model. The ANOVA was employed to examine the significant differences between these four groups (Table 1) and post-analyses using Bonferroni correction were performed to compare variables across multiple groups (p < 0.05 after Bonferroni correction). 8 Using the regression model, the clinical analytes such as bilirubin and cholesterol were estimated for their associations (beta) with HIL indices (Table 2). These betas and 95% confidence intervals (CI) were estimated in Table 2 (*p < 0.05, **p < 0.01, ***p <0.001). Metabolites were analyzed by their significance and mean metabolite concentration with 95% CI. For each variable, the mean and 95% CI were calculated and reported after performing an anti-log transformation (Table 3). The association for PC ae C36: 2 and SPEC was evaluated by Student’s t-test (A-G, A-I) in Table 4.
Demographic Characteristics of the Study Participants
Data presented as n (%) or mean ± SD. SD, standard deviation. Analysis of variance (ANOVA) was used to analyze the significant difference between the four groups and post-analysis using Bonferroni correction was performed to compare variables across multiple groups.
The difference between control and hemolytic, icteric, or lipemic (p < 0.05 after Bonferroni correction).
The difference between icteric and lipemic (p < 0.05 after Bonferroni correction).
The difference between hemolytic and icteric (p < 0.05 after Bonferroni correction).
A List of the Clinical Analytes Associated with the HIL Indices
Clinical and epidemiological data were analyzed by their significance and mean clinical and epidemiological data with 95% confidence intervals (CI). The lists were all significant results that groups of hemolysis, lipemia, and icterus serum samples were compared with the control.
p < 0.05.
p < 0.01.
p < 0.001.
Metabolites Showed Significant Differences in Concentrations in All Three HIL Indices Compared with the Non-HIL Control Group
Metabolites (μM) were analyzed by their significance and mean metabolite concentration with 95% confidence intervals (CI). The lists were all significant results that groups of hemolysis, lipemia, and icterus serum samples were compared with the control.
p < 0.05.
p < 0.01.
p < 0.001.
The Result of Metabolite PC ae C36: 2 Student’s t-Test (A-G, A-I) in SPREC
Std dev, standard deviation; Std err, standard error.
Equality of variances (p = 0.8744).
A (third code, pre-centrifugation)–I (sixth code, post-centrifugation): RT <2 hours, 1–3 days 2°C–10°C.
A (third code, pre-centrifugation)–G (sixth code, post-centrifugation): RT <2 hours, 8–24 hours at 2°C–10°C.
For the study, we also selected 60 participants to serve as a control group. These individuals were used as the common control for the hemolysis, lipemia, and icterus groups. The differences between each of these groups and the control were then analyzed. When multivariate analyses of various covariates were calculated, corrections for multiple comparisons were applied, after univariate analyses. The significance of the hemolysis, lipemia, and icterus indices was assessed using the generalized linear model applied to the metabolite data of the HEXA cohort (Table 3). When estimating the effects of HIL indices on the clinical analytes, interactions between HIL indices and clinical analytes were considered.
Results
We performed the association study using HIL indices, clinical laboratory test data, SPREC variables, and metabolite profiles from serum samples derived from the HEXA cohort, a part of the KoGES. Table 1 presents the characteristics of the study population (HEXA cohort, n = 12,196) and subgroups of 240 individuals, which included the groups of hemolysis (n = 60), icterus (n = 60), and lipemia (n = 60), as well as common control group (n = 60).
The hemoglobin level was found to be significantly different among all groups with high levels of hemolysis, icterus, and lipemia (p < 0.0001). In addition, total bilirubin, direct bilirubin, and cholesterol were significant within the hemolysis and icterus groups (all p < 0.0001) (as detailed in Table 2). We also found that 27 serum metabolites were identified among the groups of hemolysis, icterus, and lipemia, compared with the normal control group (Table 3). More details for the 240 participant samples are described in Supplementary Tables S1 and Supplementary Tables S2.
Association between HIL indices and clinical chemistry analytes (HIL vs clinical data)
We analyzed the associations between the blood levels of clinical chemistry analytes and HIL indices using generalized linear models (Table 2). In the HEXA, we found 22 clinical chemistry analytes significantly associated with hemolysis, 24 with icterus, and 25 with lipemia (p < 0.0001). For example, the hsCRP level was significantly decreased (p < 0.0001), whereas the total bilirubin level was significantly increased as the icterus index was increased (p < 0.0001), which was consistent with the previous report. 3 In addition, the ALT and AST levels were significantly associated with all of the hemolysis, icterus, and lipemia indices, whereas the fasting blood glucose was significantly associated with only the lipemia index.
Identification of serum metabolites associated with HIL indices (HIL vs metabolites)
We examined the association of metabolites in each group: -hemolysis, icterus, lipemia, and control groups. Table 3 presented the metabolites significantly associated with all the hemolysis, icterus, and lipemia groups. These 27 metabolites included acylcarnitines (n = 1), amino acids (n = 2), biogenic amines (n = 1), glycerophospholipids (n = 21), and sphingolipids (n = 2). Notably, PC aa C34:2 and PC aa C38:3, both glycerophospholipids, showed significance in the hemolysis, icterus, and lipemia groups (all p < 0.01). The C10 in acylcarnitines and spermine in biogenic amines were also significant across these groups (all p values <0.01).
The mean value of PC aa C34:2 exhibited 391.27 (p = 0.0003) in the hemolysis group, 395.05 (p < 0.0001) in the icterus group, and 488.48 (p < 0.0001) in the lipemia group, compared with 336.0 in the control group. Similarly, the mean value of PC ae C38:3 was 3.06 (p = 0.0002) in hemolysis, 3.03 (p = 0.0005) in icterus, and 3.11 (p = 0.0001) in lipemia, compared with 2.68 in the control group.
The serum levels of the C10 in acylcarnitines and ornithine (Orn) and tryptophan (Trp) in amino acids were significantly different across all groups of hemolysis (p = 0.0089), icterus (p = 0.0008), and lipemia groups (p = 0.0091). The mean C10 value in the lipemia group decreased by 0.15 (p = 0.0091), compared with the mean value of 0.19 in the control group. In terms of sphingolipids, the mean values of SM(OH) C16:1 and SM C16:0 in the lipemia decreased in all the groups compared with the control group SM(OH) C16:1 (p = 0.0335), SM C16:0 (p = 0.0410). Furthermore, the concentration of the glycerophospholipid PC aa 36:2 changed significantly with HIL indices, increasing in the hemolysis (mean = 207.18), icterus (mean = 199.68), and lipemia (mean = 261.52) groups, compared with the control (mean = 176.04).
All of 27 metabolites showed significant differences in concentrations in all three HIL groups, compared with the non-HIL control subgroup. We also found that the concentration of glycerophospholipid PC ae 44:5 changed significantly with the hemolysis (mean = 1.42) and icterus (mean = 1.43) groups but decreased in the lipemia group (mean = 1.08), compared with the control group (mean = 1.25). The SM C16:0 and SM (OH) C16:1 demonstrated similar patterns to PC ae C44:5. Thus, among the 27 metabolites, PC ae 44:5, SM C16:0, and SM (OH) C16:1 displayed distinct tendencies, suggesting the need for careful consideration during blood collection and quality control.
We have tabulated each significant finding in Supplementary Table S2. In Supplementary Table S2, we found 57 metabolites significantly altered to the hemolysis index, encompassing acylcarnitines (n = 1), amino acids (n = 3), biogenic amines (n = 3), glycerophospholipids (n = 39), and sphingolipids (n = 11). Among these metabolites, PC aa C38:3, PC aa C38:6, PC aa C40:4, PC aa C44:5, SM (OH) C16:1, and SM C16:1 were significantly similar to those reported in a hemolysis study. 5 The lyso PC C18:0 also showed significant changes. 10
Supplementary Table S2 had summaries of the 77 metabolites significantly linked to the lipemia index, which included acylcarnitines (n = 8), amino acids (n = 17), biogenic amines (n = 2), glycerophospholipids (n = 44), sphingolipids (n = 5), and sugar (n = 1). Supplementary Table S3 showed 67 metabolites significantly related to the icteric index, including acylcarnitines (n = 7), amino acids (n = 10), biogenic amines (n = 3), glycerophospholipids (n = 37), and sphingolipids (n = 10)
Association between serum metabolite concentrations and pre-analytical conditions (metabolites vs SPREC)
Pre-analytical factors significantly influenced the clinical status of biospecimens and their basic derivatives during the stages of collection, processing, and storage. The seven elements of the SPREC are coded for the type of sample, type of primary container, pre-centrifugation, centrifugation, second centrifugation, post-centrifugation, and storage conditions. 11 In the association study of SPRECs and serum metabolites, we tested whether metabolites were associated with the third (time at the pre-centrifugation) and sixth (time at the post-centrifugation) codes of the SPRECs. Specifically, we examined whether the specific SPREC’s A-I (RT <2 hours for the third code A, 1–3 days at 2°C–10°C for the sixth code I) and A-G (RT <2 hours for the third code A, 8–24 hours at 2°C–10°C for the sixth code G) were associated with serum metabolite levels. In our association study, metabolite measurements from 240 serum samples were categorized to four subgroups (A-G, A-I, C-G, and C-I subgroups) according to the SPREC variables. But both C-G and C-I subgroups were excluded in the association study because of very small number of samples. After the log transformation for normality, the Student’s t-test was performed to show that the levels of ln PC ae C36: 2 were significantly different between the SPREC A-I group and A-G groups (with a metabolite mean of 2.1959[A-I] and 2.2962[A-G], p = 0.03330) (Table 4). Through the metabolome analysis, we found that the PC ae C36: 2 could be influenced by the third and sixth codes of the SPRECs. Therefore, the serum level of PC ae C36: 2 was possibly affected by pre-analytical conditions such as the 8∼24 hours of post-centrifugation delay at 2–10°C before freezing (G) and 1∼3 days of post-centrifugation delay at 2–10°C before freezing (I).
Discussion
This study investigated the correlation of the HIL indices with clinical laboratory test values and then performed targeted metabolomic analysis to examine the impact of the HIL indices and pre-analytical variables on serum metabolite profiles. Our association study showed that most clinical laboratory test values were related to the HIL indices. For example, the total bilirubin level was found to be significantly related to serum indexes of lipemia in a negative direction and icterus in a positive direction. The AST and ALT levels were shown to be related to the hemolysis index. These results were consistent with previous reports.2,6 On the other hand, some clinical laboratory analytes including bilirubin are closely related to disease conditions. For example, hyperbilirubinemia is associated with various diseases such as hepatitis, liver cirrhosis, and autoimmune liver diseases which cause obstruction of the hepatobiliary tract. 12 Therefore, the HIL index would be an important confounding factor to assess the quality of the serum sample for measuring the clinical analytes. Our metabolite profiling analysis showed that the serum concentrations of organics were higher in each of hemolysis (98.7, [CI] 90.04–106.82), icterus (95.07, [CI] 86.47–104.52) and lipemia groups (108.4, [CI] 100.60–116.79) than in the control group. In addition, the arginine concentration was lower in the hemolysis group (121.69, [CI] 115.98–127.68) than in the control group (133.19, [CI] 126.7–140.02), consistent with previous reports. 5 On the other hand, the metabolite concentration of lyso PC a C18:0 was found to be higher in the hemolysis group, compared with the non-HIL group. By contrast, previous reports showed that these lysophosphatidycholines such as lyso PC a C16:0, lyso PC a C18:0 were increased or decreased in hemolyzed plasma samples (n = 10) 10 or hemolyzed UCB serum samples (n = 13, 56). 5 Thus, replication studies would be needed to confirm these metabolite changes in hemolyzed serum samples using a large number of samples.
This study identified 27 serum metabolites that showed significant differences in concentrations in all three hemolysis, icterus, and lipemia groups, compared with the non-HIL control group. In addition, we identified serum metabolites associated with the pre-analytical conditions, indicating the potential of HIL indices as quality control biomarkers for serum samples For lipemia, Agarwal et al. reported that some analytes (e.g., C3 and C4) were significantly affected by severe lipemia. 6 However, the sample size for this finding was limited (n = 3). 6 In Supplementary Table S3, C3 and C4 were also significant for index of lipemia. In contrast, our analyses showed significant increases in the mean concentration of C3 and C4 metabolites with the lipemic index: C3 increased from 0.39 ([CI], 0.36–0.42) to 0.49 ([CI], 0.45–0.53), and C4 from 0.19 ([CI], 0.18–0.21) to 0.23 ([CI], 0.21–0.25) (see Supplementary Table S3). Only C4 was significant to the icterus group; 6 however, C3 and C4 were not significant in our results (Supplementary Table S4).
Key findings from this study include the identification of many metabolites associated with the HIL indices of hemolysis, icterus, and lipemia as well as the pre-analytical factors. In metabolite profile analysis, we found the PC ae 36:2 significantly changed in serum concentrations between the SPREC A-G and A-I groups. These results suggest that pre-analytical factors can influence the metabolite profile of serum samples. This demonstrated the practical utility of the SPRECs as a quality control method for the serum samples as there has not been a gold standard biomarker of quality control for serum samples.
Most previous studies of HIL indices were conducted with small sizes: a routine pediatric clinical chemistry study included three samples, 6 a metabolomics study of hemolysis index had a sample size of 10, 2 and a study analyzing the metabolomic profile of umbilical cord blood included 69 samples. 5 By contrast, our study analyzed a total of 240 samples (hemolysis (n = 60), icterus (n = 60), lipemia (n = 60), and control (n = 60)) for the case-control study, which to our knowledge, is the largest sample size yet reported for HIL indices. In addition, a more extensive, diverse dataset would be required to confirm these effects. To address the issue of small sample size, a bootstrap method was recently suggested. 13 Because of standardization and normalization, the indices of HIL were calculated using the same equipment. To mitigate the issue of standardization difficulty, all HIL indices were measured using the same instrument, the Modular Analytics(P). Another study reported that 2 of the 30 clinical analytes linked to hemolysis affected clinical chemistry results when measured using Vista and Modular DPE systems. 13 The influence of HIL indices on metabolite profiles suggests that metabolomic research should consider and analyze the HIL values of the used samples for more precise biomarker identification. In addition, special caution should be taken to obtain high-quality serum samples with less hemolysis, icterus, and lipemia.
Education and training are important for less hemolytic blood sampling. Other studies reported blood collection error rates owing to various reasons. In another study, hemolyzed sampling errors in outpatient samples were greater than in the emergency department (ED). 14
Our study has some limitations. First, the sample size is limited although the case-control study was designed for this current study. Further studies would be required with increasing sample sizes and different cohort samples for the replication studies. Second, confounding factors such as pre-analytical conditions were not considered when we analyzed associations between HIL indices and serum metabolites.
Conclusion
In conclusion, we investigated the association of the HIL indices with clinical laboratory test values. Then we identified serum metabolites significantly associated with hemolysis, icterus, and lipemia as well as the pre-analytical factors (SPRECs). This study suggests that the serum index would be one of the confounding factors to impact on the downstream post-analytical data such as clinical laboratory test values and metabolite profiles of serum samples.
Footnotes
Authors’ Contributions
J.-P.J. conceived the study and designed the experiments and conducted data interpretation. J.L., B.-G.J., and E.-J.H. carried out data analysis and interpreted the findings. J.L. wrote the article. J.-P.J. and E.-J.H. developed and managed the implementation of the Sample PREanalytical Code (SPREC). All authors have given their approval for the submission of the final version of this article for publication.
Author Disclosure Statement
The authors declare that they have no conflict of interest.
Funding Information
This work was supported by an intramural project from the
References
Supplementary Material
Please find the following supplemental material available below.
For Open Access articles published under a Creative Commons License, all supplemental material carries the same license as the article it is associated with.
For non-Open Access articles published, all supplemental material carries a non-exclusive license, and permission requests for re-use of supplemental material or any part of supplemental material shall be sent directly to the copyright owner as specified in the copyright notice associated with the article.