
Abstract
Background:
Human mesenchymal stem cells (hMSCs) are utilized preclinically and clinically as a candidate cell therapy for a wide range of inflammatory and degenerative diseases. Despite promising results in early clinical trials, consistent outcomes with hMSC-based therapies have proven elusive in many of these applications. In this work, we attempt to address this limitation through the design of a stem cell therapy to enrich hMSCs for desired electrical and ionic properties with enhanced stemness and immunomodulatory/regenerative capacity.
Materials and Methods:
In this study, we sought to develop initial protocols to achieve electrically enriched hMSCs (EE-hMSCs) with distinct electrical states and assess the potential relationship with respect to hMSC state and function. We sorted hMSCs based on fluorescence intensity of tetramethylrhodamine ethyl ester (TMRE) and investigated phenotypic differences between the sorted populations.
Results:
Subpopulations of EE-hMSCs exhibit differential expression of genes associated with senescence, stemness, immunomodulation, and autophagy. EE-hMSCs with low levels of TMRE, indicative of depolarized membrane potential, have reduced mRNA expression of senescence-associated markers, and increased mRNA expression of autophagy and immunomodulatory markers relative to EE-hMSCs with high levels of TMRE (hyperpolarized).
Conclusions
: This work suggests that the utilization of EE-hMSCs may provide a novel strategy for cell therapies, enabling live cell enrichment for distinct phenotypes that can be exploited for different therapeutic outcomes.
Introduction
Cell therapy based on mesenchymal stem cells (MSCs) is a promising treatment option for a variety of inflammatory and degenerative disorders. The therapeutic action of MSCs is due, in large part, to their ability to interact with the innate and adaptive arms of the immune system as well as delivery of regenerative cues through mostly paracrine signaling. 1 In addition, their ability to differentiate into different cell types, including osteoblasts, chondrocytes, myoblasts, stromal cells, and neurons, among others, contributes to their utility for clinical applications. 2 Having demonstrated some success in preclinical and early clinical trials,3–6 human MSCs (hMSCs) suffer from population heterogeneity, and this may contribute to variable clinical outcomes. Clinical trials typically inject about 1 to 5 × 10⁶ MSCs/kg of body weight,7–12 which must be expanded from about 50,000 MSCs collected from 18 to 55 mL of aspirated bone marrow.13–15 This indispensable expansion step may last several weeks and it is associated with the onset of cell senescence, 16 spontaneous differentiation, 17 loss of stemness, 18 and the general decrease in capacity of the MSCs to interact favorably with the immune system and target tissues. 19 In addition, MSCs can also be heterogeneous within the same population in terms of multipotency and differentiation potential,20,21 cell size and proliferation rates,22,23 metabolism, 24 and immunomodulatory capacity. 25
Collectively, the theme(s) that emerge from these and many other studies are that (i) our current knowledge of what factors render hMSCs most effective for therapy is incomplete, and (ii) some subpopulations within MSC colonies can be more therapeutically beneficial than others. Hence, efforts are needed to deepen and integrate knowledge of stem cell state by monitoring factors from different cell processes to identify and enrich specific subpopulations for clinical applications.
The overarching hypothesis of this work is that cell state can be defined, in part, by electrical and ionic biophysical parameters due to their established, emerging, and proposed role(s) in the regulation of a myriad of cell26–46 and physiological processes.47–55 In terms of stem cell state, undifferentiated stem cells with greater proliferative capacity (than their differentiated progeny) have been suggested to be associated with a depolarized plasma membrane, while terminally differentiated and quiescent cells tend to be hyperpolarized. 53 This relationship may be true for hMSCs as well; modulation of plasma membrane potential via pharmaceuticals or changing the ionic milieu has been shown to be able to override biochemical signaling to prevent hMSC differentiation, 47 or suppress their differentiated state, 56 even in the presence of the most potent chemical mediators known to drive differentiation down certain lineages. In addition, mitochondrial membrane potential may also be involved in differentiation and immunomodulatory functions of hMSCs. For example, hyperpolarization of mitochondrial membrane potential has been associated with osteogenic differentiation of hMSCs. 57 Finally, the mitochondrial membrane depolarized within a population of hMSCs in response to aggregation,58,59 a process known to preserve stemness60,61 and enhance immunomodulatory and regenerative capacity of hMSCs.58,62,63
Thus, the specific hypothesis of this study was that hMSCs isolated with depolarized electrical properties will exhibit features of reduced senescence, enhanced stemness, and improved immunomodulatory capacity. Here, we report the development of a strategy for generating electrically enriched hMSCs (EE-hMSCs) based on fluorescence-activated cell sorting (FACS) with tetramethylrhodamine, ethyl ester (TMRE), a lipophilic, cationic, nontoxic, fluorescent indicator of plasma and mitochondrial membrane potentials (ΔΨ). While few studies have been performed to isolate therapeutically competent MSCs before or during expansion,64–67 it is unknown if enrichment before injection after adequate cell numbers were achieved can improve therapies. Enrichment at this stage, rather than at the isolation stage, may be more appropriate because of the expansion needed to achieve adequate cell numbers. After determining the feasibility of the sorting procedures, the differences in phenotypes of populations with high and low TMRE intensities were investigated.
Materials and Methods
MSC culture
Cryopreserved human bone marrow-derived MSCs (Texas A&M Institute for Regenerative Medicine) from donors 7071L, 8004L, and 8001R were thawed and expanded in minimum essential medium-α (Gibco) supplemented with 16.5% MSC-qualified fetal bovine serum (FBS Premium Select; Atlanta Biologicals), 1% antibiotic solution (10,000 IU/mL penicillin and 10,000 μg/mL streptomycin; Life Technologies), and 1% glutamine (GlutaMAX; Life Technologies) in a 37°C, 5% CO2-jacketed incubator. 68 Cells were grown to 70–85% confluence and then harvested with TrypLE Express (Gibco) and replated for further expansion using a 1:4 split. At passages 5–6, MSCs were harvested for FACS. The specific passage numbers for electrical enrichment were chosen according to current cell therapy standards. 69
FACS of hMSCs
Human bone marrow-derived MSCs (passage 5–6) were collected and incubated with 25 nM of TMRE dye in phosphate-buffered saline (PBS) for 30 min before sorting. TMRE was selected based on studies showing its fast equilibration time, low mitochondrial binding, and almost negligible electron transport chain inhibition if used at concentrations lower than 1 μM. 70 The concentration of 25 nM was chosen to avoid overloading of mitochondria with the dye, which can result in self-quenching due to the formation of dye aggregates. 70 FCCP (carbonyl cyanide 4-(trifluoromethoxy) phenylhydrazone) was used as a positive control for mitochondrial depolarization (Supplementary Fig. S1). Sorting was performed using a BD FACSAria. hMSCs were gated to isolate live cells from dead cells and debris using forward scatter-area (FSC-A) and side scatter-area (SSC-A) channels. Live cells were then gated and sorted into two tubes to obtain two populations: Low 30% and High 10% of TMRE (PE-A channel) signal, labeled as MSC-ΔΨL and MSC-ΔΨH, respectively. A small aliquot of EE-hMSCs was reanalyzed with flow cytometry to confirm separation of hMSCs postsorting. EE populations were either collected right after sorting or seeded on 24-well plates at a density of 5 × 10⁴ per well and collected after 24 h of culture using 500 μL of lysis buffer (100 mM Tris, 500 mM LiCl, 10 mM EDTA, 1% LiDS, 5 mM dithiothreitol, pH ∼7.8). Postsorting analysis was performed using the FlowJo software (TreeStar).
MSC/macrophage activation and coculture
A vial of cryopreserved RAW 264.7 (ATCC) murine macrophages was thawed and expanded in monolayer culture. Macrophages were maintained at 37°C/5% CO2 in cell culture medium, which consisted of Dulbecco's modified Eagle's medium (DMEM; Corning Cellgro) supplemented with 10% FBS (Hyclone), 100 U/mL penicillin, and 100 μg/mL streptomycin (Gibco). A total of 2.5 × 10⁴ RAW 264.7 (passage 19 from our cryostocks) were plated in 0.4-μm-pore inserts for 12-well transwell plates (Falcon) in 500 μL of activation media (DMEM +10% FBS Premium Select +20 ng/mL IFNγ + 100 ng/mL LPS). To be consistent with macrophage nomenclature, we refer to our activated murine macrophages as M(LPS+IFNγ). After 24 h, 5 × 10⁴ of EE-MSCs were added to the bottom of separate transwell plates in 1 mL of media (DMEM +10% FBS) to achieve a 2:1 MSC:macrophage ratio. This was selected to be consistent and comparable with prior work that assessed immunomodulatory effects of hMSCs on target cell types. 71 After 4 h to allow for hMSCs to settle and attach, media were changed to remove dead cells and debris, and inserts containing M(LPS+IFNγ) were added to the appropriate hMSC wells. Fresh 500 μL of activated media was added into the transwells. After 24 h of coculture, cells were washed with Dulbecco's Phosphate Buffered Saline (DPBS) and collected using 500 and 250 μL of lysis buffer for MSC and M(LPS+IFNγ), respectively, and then stored at −80°C. The 24-h experimental time point was chosen to assess the phenotype of hMSCs within the expected time frame of in vivo homing and therapeutic effects.72–75
mRNA extraction and quantitative reverse transcription–polymerase chain reaction
mRNA extraction was performed using Dynabeads mRNA direct kit (Life Technologies). 68 Quantitative reverse transcription–polymerase chain reaction (RT-qPCR) was performed to compare mRNA levels across the various experimental groups using a StepOne Real-Time PCR system and the SuperScript III Platinum One-Step qRT-PCR kit (Life Technologies) according to the manufacturer's instructions. Primers were purchased from Eurofins (Operon) or OriGene, and the sequences are provided in Supplementary Tables S1 and S2. Gene expression was normalized to three reference genes (GAPDH, L32, and β-actin) for hMSCs and L32 for RAW264.7 and normalized across all groups. The choice of normalizers for hMSCs was based on the assumption that plasma and mitochondrial membrane potential differences may affect the expression of multiple housekeeping genes and hence using multiple reference genes may minimize any systematic errors due to normalization. The choice of reference genes for RAW 264.7 was based on relevant literature for macrophages.76–79 Melting temperature analysis was performed for each reaction to verify the appropriate amplification product, and these values are reported in Supplementary Tables S1 and S2.
Statistical analysis
All results are reported as the mean ± standard error. The sample size, donor number, and number of experiments performed for each figure are reported in their respective legends. To assess relative differences between groups in terms of FACS parameters and mRNA expression, the means of each marker were compared using an independent-sample Student's t-test between MSC-ΔΨL and MSC-ΔΨH or activated macrophages cocultured with either MSC-ΔΨL or MSC-ΔΨH. For all tests, a p-value <0.05 was considered significant. Homogeneity of variance was verified using Levene's test. SPSS software and Excel's data analysis tool plugin were utilized to conduct statistical analysis.
Results
Cell enrichment strategy to obtain EE-hMSCs
Populations of hMSCs were EE using TMRE, a lipophilic cationic dye that accumulates in the plasma and mitochondrial matrices depending on the magnitude of the voltage across these membranes. The events were inversely gated to remove dead cells and debris, and subsequently sorted for low 30% and high 10% of TMRE signal (MSC-ΔΨL and MSC-ΔΨH, respectively; Fig. 1A). The different percentages were chosen to achieve large enough TMRE separation after sorting, while maintaining a relatively comparable number of EE-hMSCs after sorting. Overall, across the sorting experiments we performed, postsorting analyses of our populations confirmed that MSC-ΔΨH had approximately an order of magnitude greater median TMRE signal than MSC-ΔΨL (15-fold, p < 0.001, Fig. 1B). MSC-ΔΨH also had significantly greater median forward scatter signal/cell size (2.4-fold, p < 0.001, Fig. 1B), and this was confirmed visually using light microscopy. In addition, MSC-ΔΨH had greater median side scatter signal relative to MSC-ΔΨL (1.5-fold, p = 0.038, Fig. 1B), which is an indicator of cell granularity/complexity. Throughout all experiments, we consistently observed a direct relationship between TMRE and FSC-A signal magnitudes (Fig. 1C). In addition to fluorescence and size differences, sorting populations also differed in terms of sorting yield, defined as percentage of cells sorted as determined by an automatic cell counter Eve (NanoEnTek) divided by the number of sorted events detected by FACS. Specifically, sorting yield was significantly lower for MSC-ΔΨL with a mean yield of 16%, relative to MSC-ΔΨH with a mean yield of 42% (p < 0.001, Fig. 1D). At the same time, average viability, assessed by trypan blue staining, between the two EE populations was not statistically different (p = 0.32, Fig. 1E).

Cumulatively, these results suggested that hMSC populations with distinct TMRE levels and no differences in terms of viability could be obtained, but this was associated with other differential parameters of the cells, including size and granularity.
EE-hMSCs exhibit phenotypical differences with respect to senescence, stemness, autophagy, and immunomodulation
After confirming our ability to sort cells via TMRE staining, we aimed to assess potential phenotypic differences of MSC-ΔΨL and MSC-ΔΨH that were persistent across cell donors. HMSCs sorted from three donors were collected immediately after sorting, and gene expression of some of the key markers associated with senescence, stemness (multipotency), immunomodulation, and autophagy was assessed. Postsorting analysis showed that TMRE, FSC-A, and SSC-A signals were greater in the MSC-ΔΨH group (Fig. 2A), with the most notable difference being detected in EE-hMSCs derived from donor 7071L (Supplementary Fig. S2A). In terms of gene expression for senescence, mRNA levels of cell cycle inhibitor p21 were significantly lower in MSC-ΔΨL (1.3-fold, p = 0.001, Fig. 2B). Conversely, the expression DNA methyltransferase (DNMT1), involved in maintenance of self-renewal of MSCs, was significantly upregulated in MSC-ΔΨL (1.4-fold, p = 0.009, Fig. 2B). Other senescence-associated lysosomal markers (β-galactosidase, GLB1, and α-fucosidase, FUCA1) were not statistically different across donors, although in one donor (7071L), they tended to be reduced in MSC-ΔΨL (Supplementary Fig. S2B).
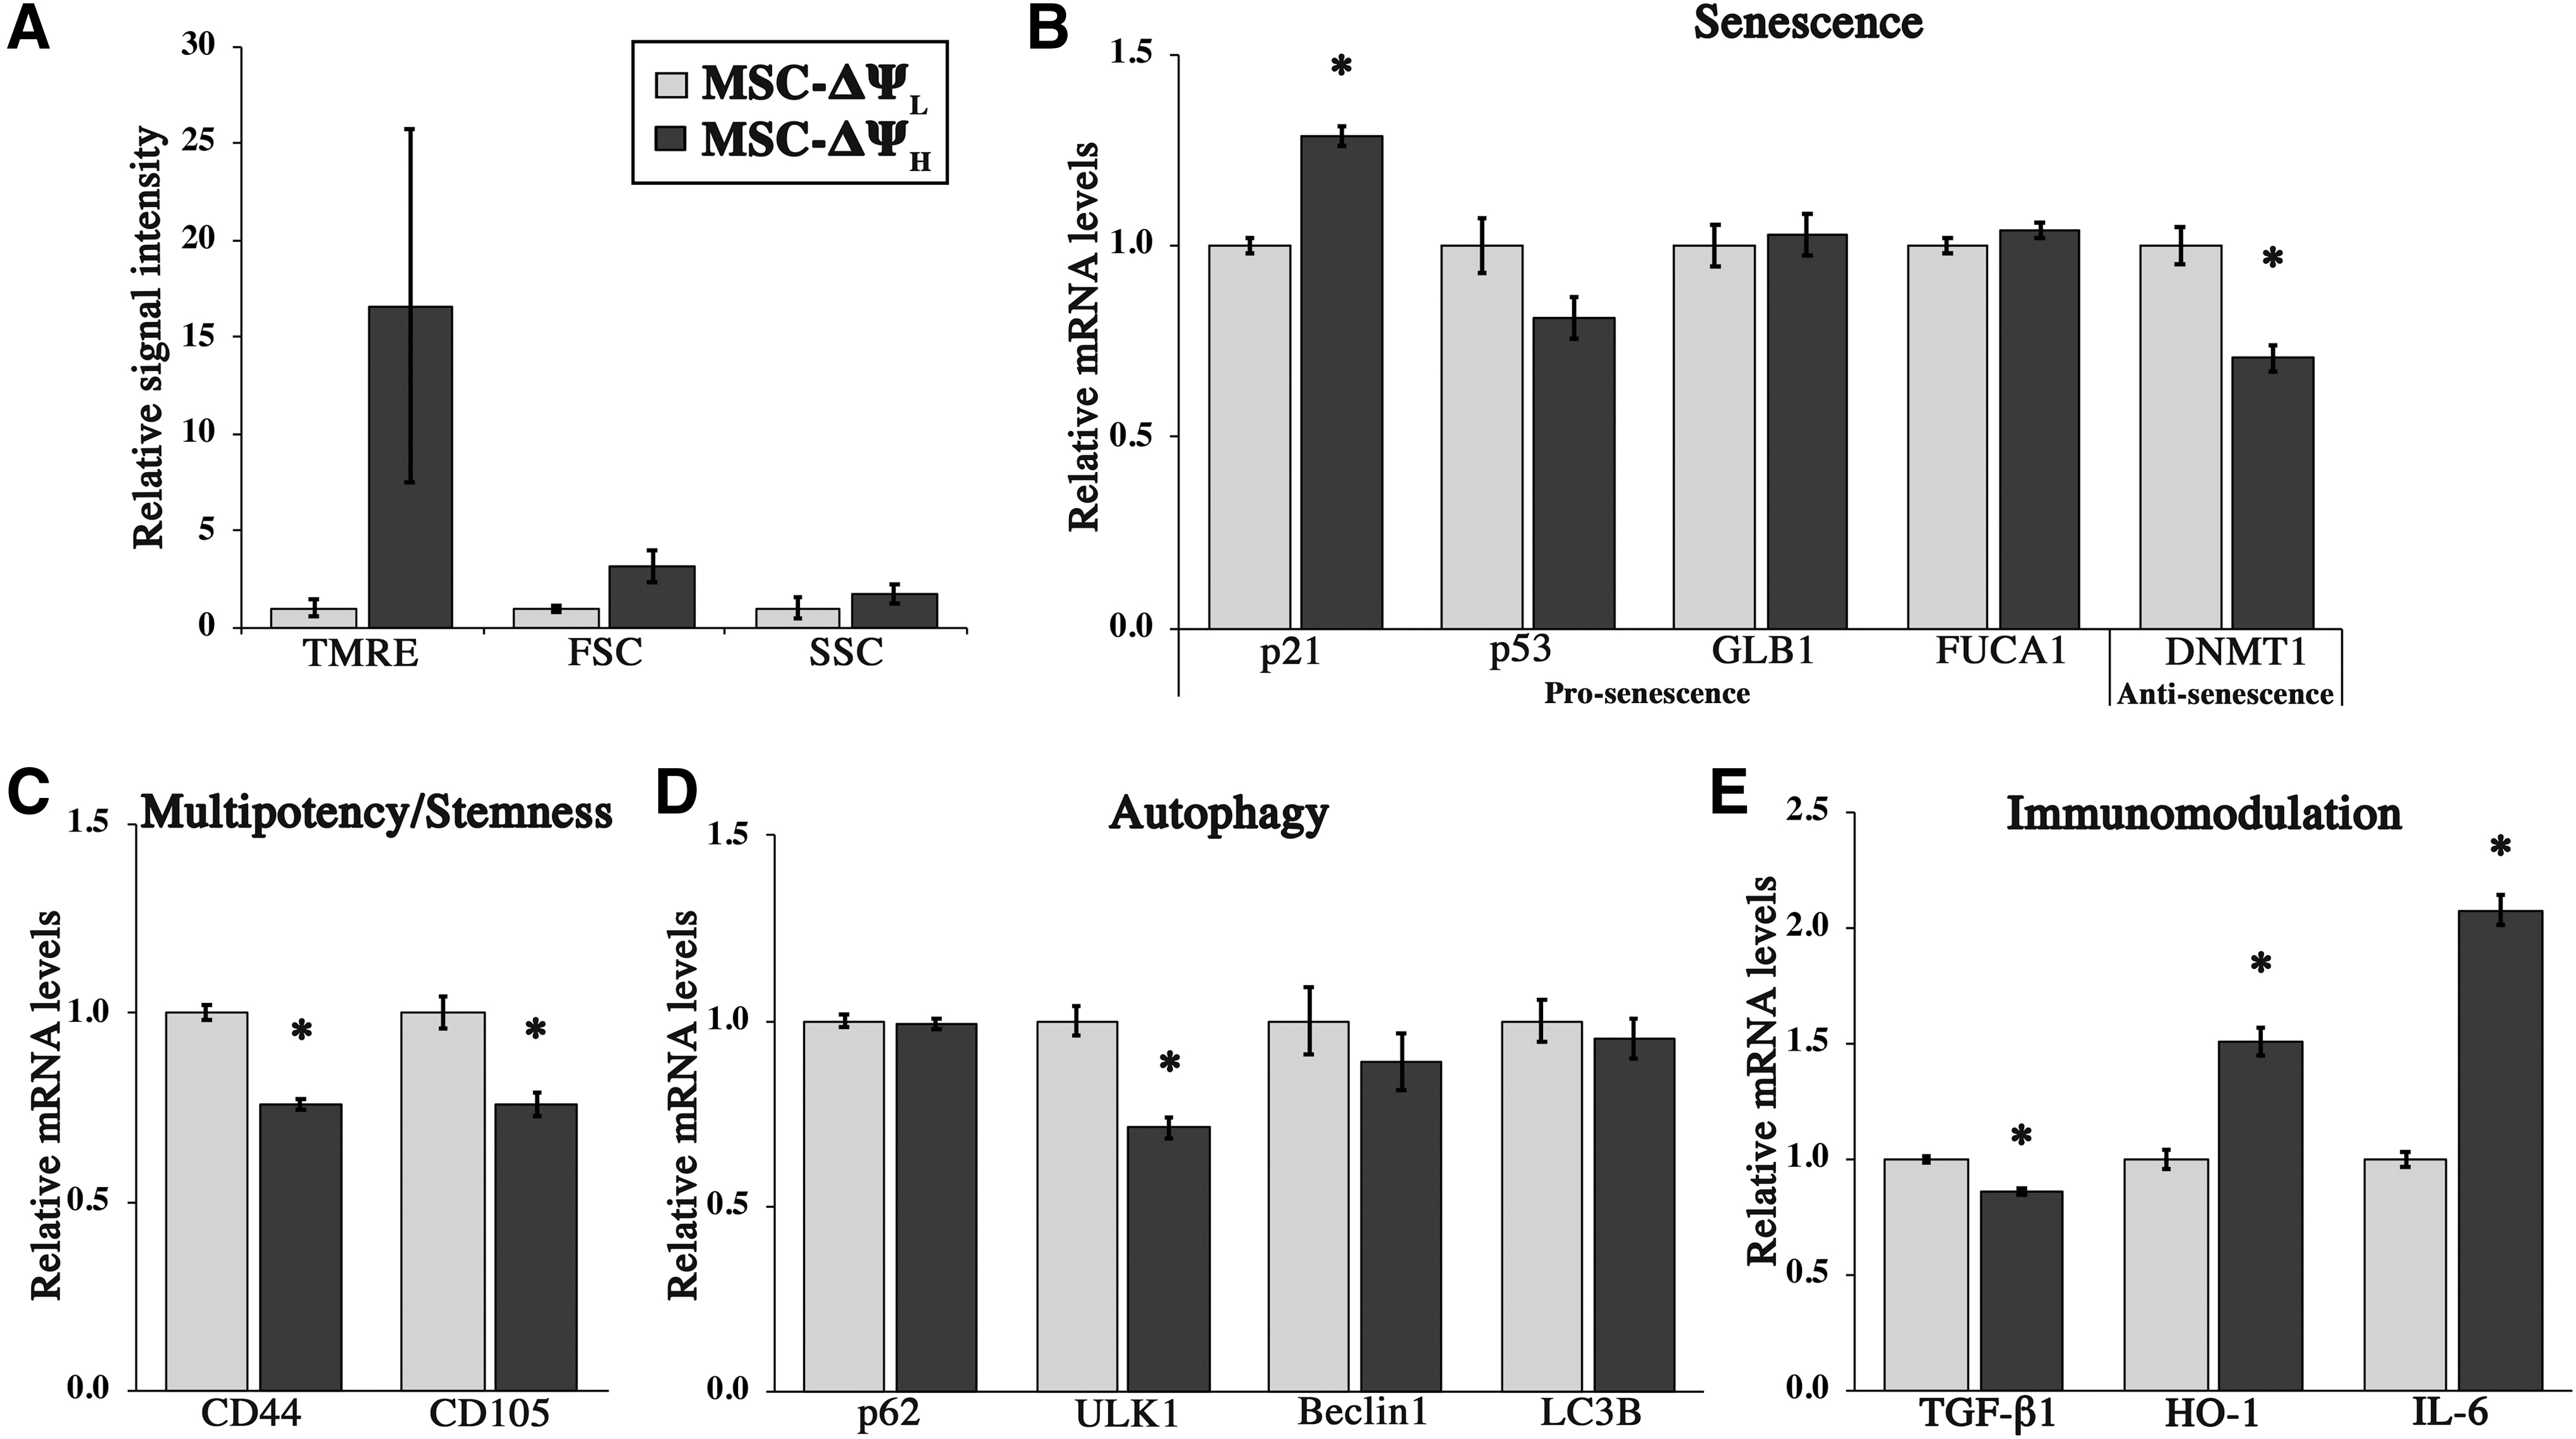
In terms of stemness markers, mRNA levels of CD44 (home cell adhesion molecule [HCAM]) and CD105 (endoglin) were significantly higher in MSC-ΔΨL relative to MSC-ΔΨH (1.4-fold, p < 0.001 and p = 0.009, respectively, Fig. 2C). In addition, we found that the expression of autophagy-related gene ULK1 was significantly upregulated in MSC-ΔΨL (1.4-fold, p = 0.003, Fig. 2D).
Finally, in terms of immunomodulatory markers, TGF-β1 was also significantly upregulated in MSC-ΔΨL relative to MSC-ΔΨH (1.2-fold, p = 0.003, Fig. 2E). In contrast, other prominent MSC-related immunomodulation markers HO-1/HMOX1 and IL-6 were significantly decreased in MSC-ΔΨL (1.5-fold, p = 0.003, and 2.1-fold, p < 0.001, respectively, Fig. 2E).
Overall, gene expression analyses immediately postsorting suggested that hMSCs with lower TMRE intensity may possess reduced senescence, enhanced stemness, and elevated levels of autophagy. However, immunomodulation profiling revealed a marker-dependent relationship between MSCs sorted via TMRE intensity.
EE-hMSCs are phenotypically different 24 h after electrical enrichment
Given the differences in mRNA expression immediately after the sorting, we asked whether the differences would persist in EE-hMSCs cultured for 24 h after sorting. The sorted cells from the donor with the most consistent mRNA expression in terms of stemness, immunomodulation, and senescence-associated markers were seeded (7071L; Supplementary Fig. S3). In contrast to day 0 analyses, the difference in expression of senescence-associated markers p21 and DNMT1 was lost at the 24-h time point. Other senescence-associated lysosomal markers GLB1 and FUCA1 were significantly lower in MSC-ΔΨL relative to MSC-ΔΨH (1.5-fold, p < 0.001, and 1.2-fold, p = 0.003, respectively, Fig. 3A).

In terms of stemness markers, there was no difference in CD44 expression, while significantly lower levels of CD105 were noted in MSC-ΔΨL (1.3-fold, p < 0.001, Fig. 3B). In contrast, relative to MSC-ΔΨH, MSC-ΔΨL had significantly increased mRNA levels of the autophagic indicators p62 (1.8-fold, p = 0.012), ULK1 (1.2-fold, p = 0.045), and LC3B (1.2-fold, p = 0.002; Fig. 3C) in parallel with increases in mRNA levels of immunomodulatory markers HO-1 (1.8-fold, p = 0.01) and IL-6 (1.6-fold, p = 0.009; Fig. 3D). Results for CD105, HO-1, and IL-6 were all opposite of what we observed at 0 h.
Cumulatively, these data supported the notion that cells sorted via TMRE intensity remain as distinct cell states even after culture. Moreover, focusing on consistencies between time points suggested that MSC-ΔΨL exhibit features of reduced senescence and enhanced autophagy. At the same time, acknowledging differences between the two time points highlighted diverging mRNA expression in terms of immunomodulatory markers HO-1 and IL-6, as well as the stemness marker CD105 (Supplementary Fig. S4).
MSC-ΔΨL suppresses features of M(LPS ± IFNγ) in coculture
To characterize possible functional differences between our two hMSC populations, we evaluated the potential immunosuppressive effect of EE-hMSCs through a coculture with M(LPS+IFNγ). EE-hMSCs were generated using the same gating strategy as in Figure 1, and representative FSC, SSC, and TMRE spectrums postsorting are shown in Supplementary Figure S5. After 24 h of coculture, the mRNA levels of macrophage activation markers were assessed. Relative to MSC-ΔΨH, M(LPS+IFNγ) exposed to MSC-ΔΨL expressed significantly lower levels of classical proinflammatory (M1) markers NOS2 (1.3-fold, p = 0.048), IL-1β (1.8-fold, p = 0.04), IL-6 (1.3-fold, p = 0.002), and MCP-1/CCL-2 (1.02-fold, p < 0.001, Fig. 4A). In addition to “M1” markers, MSC-ΔΨL also decreased the expression of markers typically associated with the “M2” state, such as IL-10 (1.3-fold, p = 0.01), CCL-1 (2.5-fold, p = 0.026), TGF-β1 (1.1-fold, p < 0.001), and SOCS3 (1.1-fold, p = 0.014, Fig. 4B).
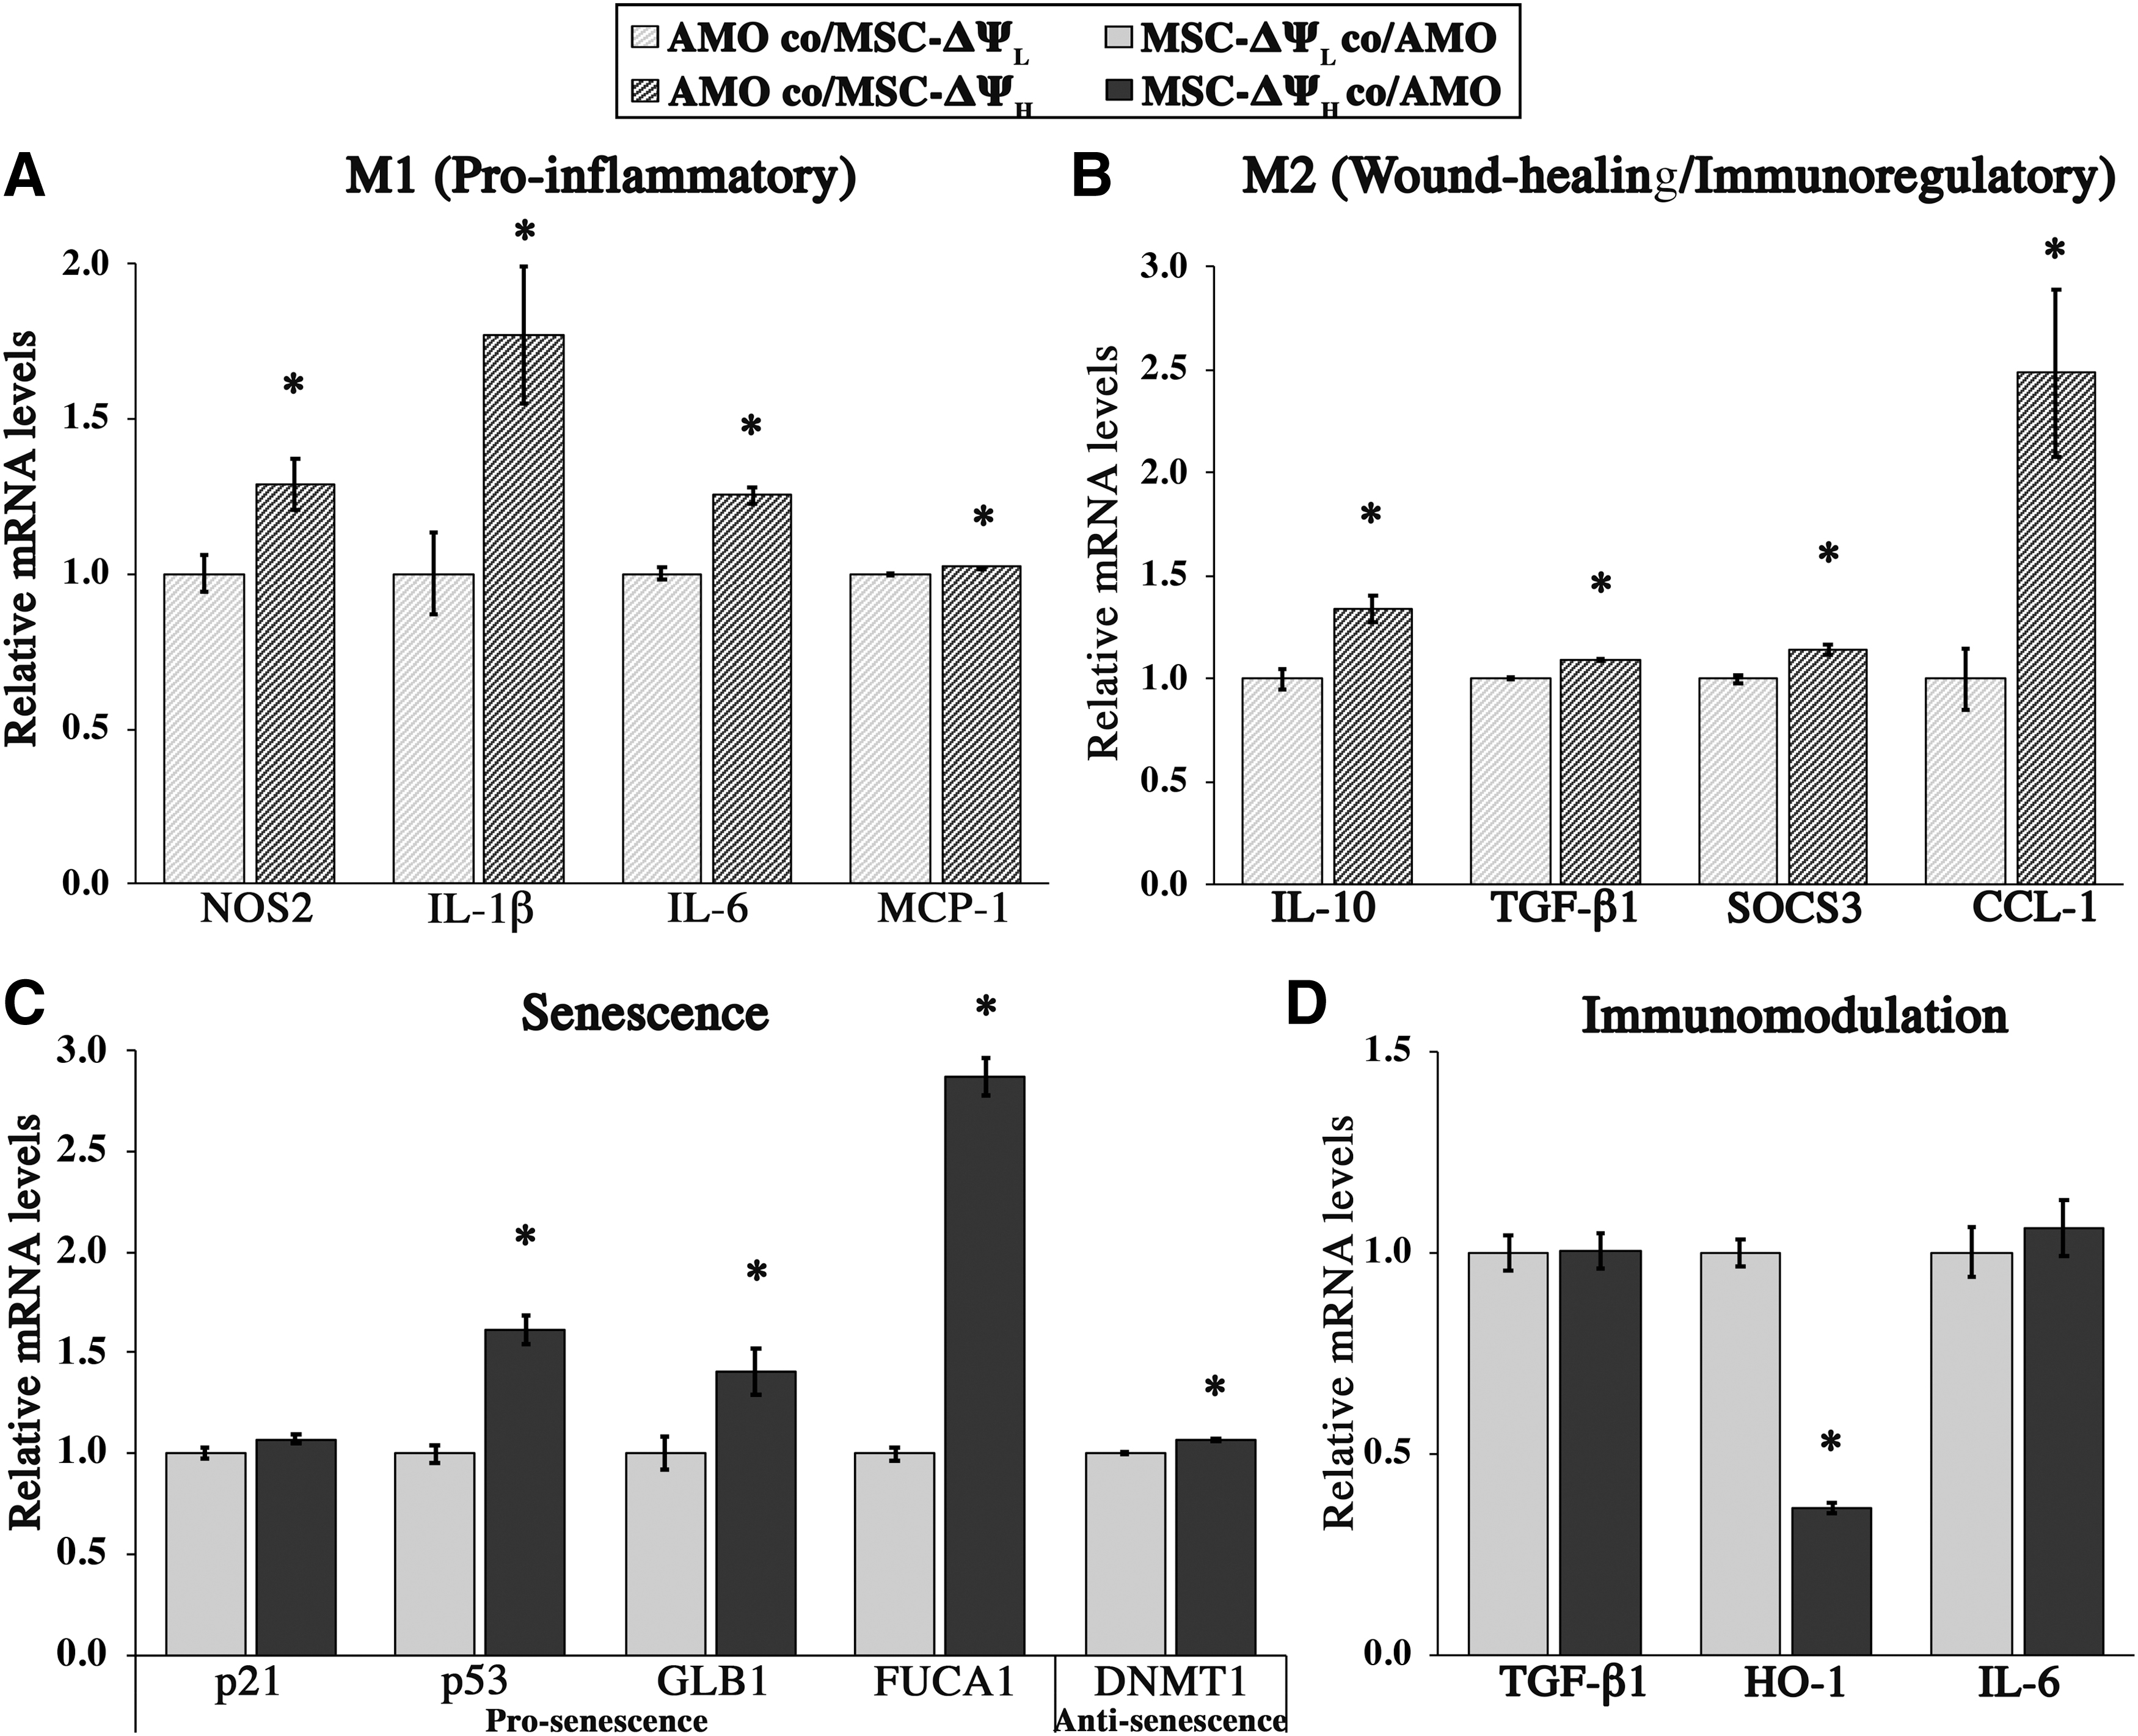
To gain insight into the differences noted in M(LPS+IFNγ), we also profiled the phenotype of EE-hMSCs from the coculture via mRNA expression of senescence and immunomodulatory markers. Consistent with the 24-h monoculture results (Fig. 3), the expressions of senescence-associated markers p53 (1.6-fold, p < 0.001), GLB1 (1.4-fold, p = 0.04), and FUCA1 (2.9-fold, p < 0.001) were all significantly lower in MSC-ΔΨL (Fig. 4C). The lower levels of senescence-associated markers were also associated with differential expression of the immunomodulatory marker HO-1. Specifically, HO-1 mRNA levels were elevated in MSC-ΔΨL population (2.8-fold, p < 0.001) while levels of IL-6 and TGF-β1 were similar between the two groups (Fig. 4D). These EE-hMSC results were also relatively consistent with what was observed in monoculture.
Taken together, these results suggested that MSC-ΔΨL may suppress the expression of genes associated with macrophage activation, and this response may be mediated, in part, by HO-1.
Discussion
Our long-term goal is to develop an enrichment strategy for specific stem cell populations with reduced senescence and enhanced stemness, potentially resulting in greater immunomodulatory and regenerative capacity of hMSCs. We envision that electrical enrichment may be implemented as a novel and complementary technology/concept for hMSC therapy. In this study, we sought to initially develop the idea of exploiting hMSC electrical properties, such as plasma and mitochondrial membrane potentials, which we and others have hypothesized to be associated with distinct cell states and functions.26,27,38,40–46 Specifically, our goals were to begin to (i) develop a protocol to achieve EE-hMSCs with distinct electrical states through FACS TMRE intensity sorting, and (ii) assess the potential relationship with respect to EE-hMSC state and function. Both the idea to sort hMSCs based on electrical properties and the combination of metrics/processes analyzed (autophagy, immunomodulation, multipotency/stemness, and senescence) to describe the stem cells are novel. Therefore, our discussion first focuses on technical considerations and observations followed by those of biological nature.
Cell enrichment based on TMRE yielded two distinct stem cell subpopulations—MSC-ΔΨL and MSC-ΔΨH—characterized by an order of magnitude difference in signal intensity postsorting, suggesting successful acquisition of distinct electrical properties. Interestingly, MSC-ΔΨH also exhibited a significantly larger cell size and granularity. Given the similarities between TMRE and FSC intensities, cell enrichment based on FSC may present an alternative, simpler strategy for stem cell enrichment in future work.
We are unable to compare the associations between TMRE, FSC, and SSC with others who have performed similar sorting experiments in other cell types because FSC and SSC parameters were not reported.28,31,33,36 Despite being commonly omitted, it is appropriate to comment on how these parameters may change the interpretation of fluorescence as they relate to voltage. For example, the greater size of MSC-ΔΨH is likely not a major confounding element based on previous experimental and computational work that measures or simulates fluorescence in response to cell and/or mitochondrial volume manipulations.80,81 In other words, Nernstian dyes can be cell volume insensitive, and thus, size may not be a major contributor to fluorescence intensity, likely because of the binding nature of the dyes to membranes. It remains a possibility that differential SSC signals, a potential indication of mitochondrial content differences, 82 in EE-hMSCs could account for fluorescence differences between our sorted populations. Unfortunately, correcting for mitochondrial volume fraction, a known contributor to tetramethylrhodamine signal intensity, is technically challenging, 80 especially in light of recent results questioning the use of mitochondrial tracker dyes for mitochondrial mass assessment. 83 In addition, we are unable to establish specifically whether differences in TMRE levels between MSC-ΔΨL and MSC-ΔΨH populations are due to the mitochondrial or plasma membrane potentials as both are known contributors to TMRE signal.80,84 These and other limitations of voltage-sensitive dye utilization (including accounting for apparent activity coefficients and apparent charge of TMRE) prevent us from definitively claiming that our populations are indeed distinct electrically based solely on fluorescence intensity comparisons, but we are able to assume so with a degree of confidence, as is done ubiquitously in the literature.28,31,33,36,58,59
One of the main challenges we faced during our experiments was the sorting yield (the percentage of live cells as counted by cell counter or hematocytometer over sorted events registered by FACS). We found that while yield varied between experiments for both populations, it was consistently lower for MSC-ΔΨL (5–30%) compared with MSC-ΔΨH (25–65%) subpopulations. We have no definitive explanation for this result, but possibilities include technical limitations of FACS sorting of lower intensity signals or a differential capacity to handle sorting stresses between EE-MSC populations. The cell recovery and other problems we encountered might be improved through sorting and collecting hMSCs in medium containing some nutrients, 85 and/or by adjusting technical parameters of FACS (i.e., sheath pressure, nozzle size, and sorting speed).
After generating EE-hMSCs with a degree of confidence, we asked whether these populations varied with respect to phenotypic and functional measures with the hypothesis that the MSC-ΔΨL population would exhibit features of reduced senescence with concomitant increases in stemness and immunomodulatory properties. In partial support for these relationships, we observed lower levels of the “prosenescence”86–88 descriptors FSC, SSC, and p21 mRNA, and higher levels of the “antisenescence”89,90 DNMT1 marker in all three donors at time zero (Fig. 2B), and lower levels of “prosenescence”91–93 markers p53, GLB1, and FUCA1 24 h postsorting (Fig. 3A) in the MSC-ΔΨL population. Although distinct from senescence, autophagy pathways have been shown to prevent senescence in aging muscle stem cells in a mouse model by decreasing p16 and H2AX expression, as well as reducing senescence-associated β-galactosidase activity. 94 In line with this idea, we found that MSCs-ΔΨL had greater expression of autophagic marker ULK1 right after sorting (Fig. 2D) and increased expression of p62, ULK1, and LC3B at 24 h (Fig. 3C).
Even though specific senescence and autophagy markers may have switched between time points, at no point did we observe evidence to the contrary. Cumulatively, these data are consistent with the notion that MSC-ΔΨL are in a state characterized by reduced senescence and enhanced autophagy relative to MSC-ΔΨH. The mechanistic links between ΔΨm and hMSC state and function are poorly understood but potentially numerous.26–55 Focusing on the mitochondria as one example: ΔΨm has been suggested not only to directly communicate with the nucleus to regulate gene expression 26 but also ΔΨm is an integration point for many processes of cell metabolism, 95 regulating mitochondrial reactive oxygen species,96,97 mitochondrial respiration, and ATP synthesis. 98 Each metabolic parameter in turn is associated with a range of downstream effects, resulting in complex and incompletely understood systems-level interconnections that render cause/effect relationships difficult to tease out.
As separate but related to senescence and autophagy, it is also useful to assess the expression of stemness (or multipotency) markers. Typically, these MSC markers, such as CD44 (HCAM) and CD105 (endoglin), are known to decline with aging 87 and differentiation.99–101 Both surface marker mRNA levels were elevated in MSC-ΔΨL in all three donors (Fig. 2C), suggesting enhanced stemness in MSC-ΔΨL, consistent with not only our hypothesis but also the general perception that MSCs with reduced senescence have greater stemness. However, once seeded and cultured for 24 h, phenotypic shifts were observed (Supplementary Fig. S4). MSC-ΔΨL exhibited lower levels of CD105 in comparison with MSC-ΔΨH, this switch contrasts that of the senescence markers that cumulatively suggested a consistent senescent state. We have no explanation for this finding, but the data lend credence to the notion that stemness and senescence may be distinct processes with disparate functions.
The relationship between the stemness and immunomodulatory properties still remains controversial with opposing findings present in literature.102,103 The preservation of stemness remains one of the priorities in many in vitro investigations with the assumption that a more stem-like state correlates with better therapeutic immunomodulation. We found that MSC-ΔΨH had elevated mRNA expression of HO-1, a rate-limiting enzyme in heme metabolism, with anti-inflammatory, antioxidative, and antiapoptotic functions,104,105 as well as pleiotropic cytokine IL-6, which is heavily involved in the immunomodulatory function of MSCs. However, after 24 h of culture of EE-hMSCs, we observed a shift toward greater expression of HO-1 and IL-6 in MSC-ΔΨL. This shift in immunomodulatory markers coincided with a shift in opposing direction of CD105, a pattern that compares favorably with findings from Sempere et al. 106 Specifically, they described populations of adipose-derived stem cells with low expression of CD105, yet greater IL-4 expression and a more inhibitory effect on lymphocyte proliferation, while MSCs with highly expressed CD105 secreted more proinflammatory cytokine IL-1β. 106 Together, these data suggest that the relationship between stemness and immunomodulation is not straightforward. Unfortunately, making definitive conclusions about stemness and immunomodulation/therapeutic efficacy is difficult due to the complexity of these processes, and the fact that both studies assessed a limited marker set.
While we observed complex, marker-dependent phenotypic shifts of EE-hMSCs after culturing for 24 h, the two populations were still distinct. To help improve clarity, we tested their immunomodulation capacity by coculture with M(LPS+IFNγ). Since we observed that MSC-ΔΨL was able to downregulate both M1 and M2 markers, we are not able to say that MSC-ΔΨL induced an M2-like transition, a common finding when investigating MSC effects on macrophages. 107 Given that both M1 and M2 markers are associated with pathologies, 108 the overall downregulation of inflammation-related genes may suggest that MSC-ΔΨL may have stronger immunosuppressive effect relative to MSC-ΔΨH. Profiling the EE-hMSCs from the coculture revealed a marked increase of HO-1 in MSC-ΔΨL, suggesting that effects on macrophages may be driven, in part, by higher expression of HO-1. This is supported by several lines of in vitro and in vivo data demonstrating the impact of HO-1 on reduction of the proinflammatory phenotype of stimulated macrophages,109–112 and specifically HO-1 derived from hMSCs. 113 In our study, MSC-ΔΨH had greater expression of senescence-associated markers and reduced immunomodulatory markers HO-1 (and IL-6 in monoculture). These findings are consistent with reports that senescent MSCs display reduced immunomodulatory capacity. 19 The effects of EE-hMSCs on activated macrophages are more closely associated with the phenotype of EE-hMSCs 24 h after coculture, rather than immediately after sorting.
Some limitations of our study must be taken into account when interpreting the results, aside from those relating to dye staining mentioned earlier. Our study was largely proof-of-concept in nature, so we were limited with respect to many of the analyses and types of experimental groups included. For example, the analysis of EE-hMSCs was only performed utilizing mRNA levels. Owing to technical limitations of FACS, the number of available cells is a limiting factor for protein expression analysis, as mentioned earlier. This is particularly a limitation for making claims regarding a metabolic process such as autophagy, where definitive flux information cannot be deduced from mRNA levels. Second, the study could have benefited from a comparison with cells that were expanded but not subjected to any enrichment. Third, within the scope of this work, we decided to restrict the assessment of EE-hMSCs to specific passage numbers (5–6) and time points (0 and 24 h). Finally, while we were relatively extensive in our selection of processes and marker sets, we were by no means exhaustive. As we develop our knowledge of the enrichment process, deeper interrogation of cell state with functional, protein, metabolite, and electrophysiological analyses coupled with gold standard comparisons will be the focus of future work. As a separate focus, we will pursue ionic and electrical manipulations during expansion of hMSCs to induce bioelectrical states associated with enhanced immunomodulatory/regenerative capacity.
Conclusions
We demonstrated that hMSCs can be enriched based on TMRE staining into two distinct populations—MSC-ΔΨL and MSC-ΔΨH, likely reflecting differences in basal electrical states of these populations. Phenotypical differences were observed both immediately and 24 h after enrichment. While many phenotypic markers switched or changed pattern during this period, MSC-ΔΨL tended to express lower levels of senescence-associated markers, and greater expression of autophagy markers. Subsequent culture of EE-hMSCs with M(LPS+IFNγ) suggested that this population exhibits a more overall immunosuppressive potential. Cumulatively, our results deepen our understanding of hMSC state and suggest that future work developing EE-hMSCs is warranted.
Footnotes
Authors' Contributions
J.E.M. conceived the project. J.E.M. and M.S.H. designed the experiments. T.K. performed experiments and data collection. J.E.M., M.S.H., and T.K. analyzed and interpreted data. J.E.M. and T.K. wrote the manuscript. M.S.H., M.L., and D.L.K. revised and edited the manuscript. All authors have reviewed and approved the manuscript before submission.
The authors declare that the manuscript has not been published, in press, or submitted elsewhere.
Author Disclosure Statement
The authors declare the following potential conflict of interest with respect to the research, authorship, and/or publication of this article: T.K., J.E.M., and M.H. have a provisional patent (U.S Provisional Patent, Application No. 62/889,285) for this work.
Funding Information
The authors thank the National Institutes of Health (P41 Resource Center on Tissue Engineering [P41EB002520] to D.L.K., NIA R03AG064550 and NIA R03AG056168 to M.H., NIMH F32MH118678 to J.E.M., and NIGMS 5T32GM067545-13 to T.K.) and the Paul G. Allen Foundation (# 2171), to D.L.K. and M.L., for funding.
References
Supplementary Material
Please find the following supplemental material available below.
For Open Access articles published under a Creative Commons License, all supplemental material carries the same license as the article it is associated with.
For non-Open Access articles published, all supplemental material carries a non-exclusive license, and permission requests for re-use of supplemental material or any part of supplemental material shall be sent directly to the copyright owner as specified in the copyright notice associated with the article.