
Abstract
Background:
Bioelectrical properties are known to impact stem cell fate, state, and function. However, assays that measure bioelectrical properties are generally limited to the plasma membrane potential. In this study, we propose an assay to simultaneously assess cell plasma membrane and mitochondrial membrane potentials.
Materials and Methods:
Mesenchymal stem cell (MSC) plasma and mitochondrial membrane potentials were measured using flow cytometry and a combination of tetramethylrhodamine, methyl ester (TMRM), and bis-(1,3-dibutylbarbituric acid)trimethine oxonol (DiBAC) dyes. We investigated the shifts in the bioelectrical phenotype of MSCs due to extended culture in vitro, activation with interferon-gamma (IFN-γ), and aggregate conditions.
Results:
MSCs subjected to extended culture in vitro acquired plasma and mitochondrial membrane potentials consistent with a hyperpolarized bioelectrical phenotype. Activation with IFN-γ shifted MSCs toward a state associated with increased levels of both DiBAC and TMRM. MSCs in aggregate conditions were associated with a decrease in TMRM levels, indicating mitochondrial depolarization.
Conclusions:
Our proposed assay described distinct MSC bioelectrical transitions due to extended in vitro culture, exposure to an inflammatory cytokine, and culture under aggregate conditions. Overall, our assay enables a more complete characterization of MSC bioelectrical properties within a single experiment, and its relative simplicity enables researchers to apply it in variety of settings.
Introduction
The biophysical parameters associated with endogenous ion flows through plasma and inner mitochondrial membranes play a critical role in a variety of cellular and physiological processes. Embryogenesis,1,2 stem cell fate,3–8 cell–cell communication,9,10 neurogenesis,11–13 wound healing,14,15 and immune response16–18 are among the wide range of processes influenced by bioelectrical signals. Recent findings suggest that tracking and modulation of bioelectrical properties of the cells and tissues may have promising implications for the fields of regenerative medicine and tissue engineering. For instance, changes in voltage gradients across the plasma membrane (ΔΨP) have been observed with stem cell differentiation, 6 activation of inflammatory phenotypes in immune cells, 19 and attenuation of a catabolic phenotype in osteoarthritic chondrocytes. 20 Similarly, mitochondrial membrane potential (ΔΨM) has been associated with regulation of stemness in immune cells21,22 and stem cells.3–5,23,24
A greater understanding of the effect of bioelectrical signals on cellular behavior in different physiological and pathological contexts will, in part, depend on our ability to measure bioelectrical properties and define specific bioelectrical states of the cells. Currently, most studies that measure bioelectrical properties use either ΔΨP or ΔΨM. For instance, we have previously separated human mesenchymal stem cells (MSCs) into subpopulations with low and high levels of mitochondrial potentiometric dye tetramethylrhodamine, ethyl ester (TMRE) and observed that these subpopulations are phenotypically distinct and exert differential immunomodulatory effects. 25
In this study, we propose simultaneous assessment and visualization of both ΔΨM (as described by tetramethylrhodamine, methyl ester [TMRM]) and ΔΨP [as described by bis-(1,3-dibutylbarbituric acid)trimethine oxonol (DiBAC4(3))] may provide more complete information about the bioelectrical properties of the cells. In addition, mapping these two properties on one chart may uncover data patterns that may not be identifiable when assessing only one of the two parameters.
The goals of this study are twofold: (1) to develop a novel flow cytometric assay to assess cell bioelectrical properties associated with ΔΨM and ΔΨP, and (2) to demonstrate that this assay can identify distinct bioelectrical states than either marker alone. We hypothesized that MSCs may experience shifts in their bioelectrical properties when subjected to extended culture in vitro (“aging”), activation with proinflammatory cytokine interferon-gamma (IFN-γ), or culture under aggregate conditions. Our proposed assay revealed significant and distinct shifts in MSC bioelectrical properties in each case.
Materials and Methods
MSC expansion
Cryopreserved human bone marrow-derived MSCs (Texas A&M Institute for Regenerative Medicine, Donor 7071L) were thawed and expanded in growth medium (GM: minimum essential medium-α [Gibco] supplemented with 16.5% MSC-qualified fetal bovine serum [FBS; Gibco], 1% antibiotic solution [10,000 IU/mL penicillin, 10,000 μg/mL streptomycin; Life Technologies], and 1%
Early versus late passage MSCs
For assessment of the bioelectrical profile of early- and late-passage MSCs (passages 4–7 and 14–17, respectively), cells were grown to 70–85% confluence, harvested as previously indicated, and replated at a density of 4000 cells/cm2 in GM in 6-well plates (Falcon). After 24 h, medium was changed to Dulbecco's modified Eagle's medium (DMEM; Corning Cellgro) supplemented with 10% FBS, 100 U/mL penicillin, and 100 μg/mL streptomycin, and cultured for a further 24 h before flow cytometry analysis.
IFN-γ stimulation of MSCs
For assessment of the bioelectrical profile of IFN-γ primed MSCs (passage 4–7), cells were grown to 70–85% confluence, harvested as previously indicated, and replated at the density of 4000 cells/cm2 in GM in 6-well plates (Falcon). After 24 h, medium was changed to DMEM supplemented with 10% FBS, 100 U/mL penicillin, and 100 μg/mL streptomycin, after which half the wells received activation medium (DMEM +10% FBS +100 U/mL penicillin +100 μg/mL streptomycin +20 ng/mL IFN-γ) for 24 h in activation media before flow cytometry analysis.
Aggregate culture of MSCs
MSCs were harvested and resuspended in GM. Cells were seeded at 5000 cells per well of a 96-well round bottom ultralow attachment spheroid microplate (Corning) using 200 μL of medium. Spheroid formation was noticeable after 12 h. To avoid loss of spheroids due to pipetting, only 150 μL of medium was changed every 24 h of culture. After 72 h of culture, spheroids were washed in Dulbecco's phosphate-buffered saline (DPBS), transferred into round bottom polystyrene 5 mL tubes (Falcon), centrifuged for 5 min at 452 g and resuspended in 0.25% trypsin-EDTA for dissociation. Spheroids were then placed into a 37°C, 5% CO2-jacketed incubator for ∼12 min. Every 3–5 min, spheroids were gently pipetted to accelerate dissociation. Trypsin-EDTA was neutralized using an equal volume of culture medium, after which spheroids were centrifuged for 5 min at 452 g and washed twice with DPBS.
Flow cytometry
MSCs were collected, washed with DPBS, and incubated with 20 nM TMRM and 50 nM DiBAC4(3) in DPBS at the density of 1–1.5 × 10⁵ per milliliter for 30 min at 37°C and 5% CO2. TMRM was selected as the mitochondrial dye based on studies showing its fast equilibration time, low mitochondrial binding, and almost negligible electron transport chain inhibition at concentrations <1 μM. 26 The concentration of 20 nM TMRM was chosen to avoid mitochondrial overloading with the dye, which can result in self-quenching due to the formation of dye aggregates. 26 Flow cytometry was performed using a Becton Dickinson's LSRII. At least 10,000 events were collected for each experimental group. Fluorescein isothiocyanate and phycoerythrin channels were used to collect the data points from DiBAC and TMRM staining, respectively.
To correct for the partial overlap in emission spectra of both dyes, the compensation matrix was calculated and applied to each experiment. Compensation values were acquired by incubating MSCs with either 20 nM TMRM or 50 nM DiBAC for 15 min at 37°C and 5% CO2, following by addition of 10 μM oligomycin or 2 μg/mL gramicidin, respectively, and incubating for another 15 min at 37°C. The same compensation matrix was applied to all the experiments with similar photomultiplier voltage settings. Unstained and single-stained controls were included to monitor the contribution of autofluorescence. Single-stained controls were also used to ensure that the resulting values of double-stained samples after applied compensation agreed reasonably well with single-stained controls (Supplementary Fig. S1). Dyes were validated using drugs that are known to induce depolarization of plasma and mitochondrial membranes (Supplementary Fig. S2). Mitochondrial depolarization was induced by transient incubation with mitochondrial uncoupler BAM1527 (10 μM) and confirmed by FCCP 28 (25 μM). Plasma membrane depolarization was induced by transient incubation with ionophore antibiotic gramicidin 29 (2 μg/mL). Data are reported as median fluorescent intensity (MFI). Analysis was performed using the FlowJo software (Treestar). To account for experimental variability, MFIs were normalized between the groups within individual experiments.
Statistical analysis
All results are reported as the mean ± standard error of the mean, unless otherwise indicated. The sample size and number of experiments performed for each figure are reported in their respective legends. To assess relative differences between the groups, the means were compared using an independent-sample Student's t-test or, for experiments involving more than two groups, one-way ANOVA followed by Tukey's post hoc test. For all tests, a p-value <0.05 was considered significant. The normality assumption was verified using the Anderson–Darling test. For correlation analysis between TMRM, DiBAC, area of forward scatter (FSC-A), and area of side scatter (SSC-A), the Pearson's correlation coefficient was computed. The coefficient of variation (CV) of a given distribution was calculated (CV = standard deviation of the distribution/mean of the distribution) to assess variability of TMRM, DiBAC, FSC-A, and SSC-A distributions. SPSS software and Excel's data analysis tool plug-in were utilized to conduct statistical analyses.
Results
Dual bioelectrical assessment population and subpopulation characteristics
Human MSCs were stained with two potentiometric dyes with distinct mechanisms of binding to lipid membranes, thus providing different but complementary information about the bioelectrical properties of MSCs. TMRM, a lipophilic cationic dye, accumulates in the plasma and mitochondrial membranes depending on the magnitude of the voltage across these membranes. Owing to the more negative voltage and increased surface area of the mitochondrial membrane versus the plasma membrane, TMRM primarily accumulates in mitochondrial membrane. DiBAC, in contrast, is a lipophilic anionic dye that accumulates only in the plasma membrane, and the extent of its binding is inversely proportional to the magnitude of the voltage across the membrane.
Figure 1 illustrates the gating strategy to isolate live cells from debris and dead cells using FSC-A light and SSC-A light (Fig. 1A), followed by isolation of single cells from cell clumps using height of forward scatter light and FSC-A (Fig. 1B). The intensities of FSC-A and SSC-A are determined by cell size and granularity (complexity), respectively. Although greater TMRM fluorescent intensity is commonly attributed to greater mitochondrial polarization, a more polarized plasma membrane exhibits a lower DiBAC signal due to the overall negative charge of DiBAC dye and thus its exclusion from an increasingly negatively charged plasma membrane (Fig. 1C). When the dyes are plotted against each other, the more polarized (hyperpolarized) cell subpopulation (in terms of both ΔΨP and ΔΨM) is located at the top left corner of TMRM-DiBAC plot, whereas the subpopulation with overall low ΔΨM and ΔΨP (depolarized) is located in lower right corner of the chart.
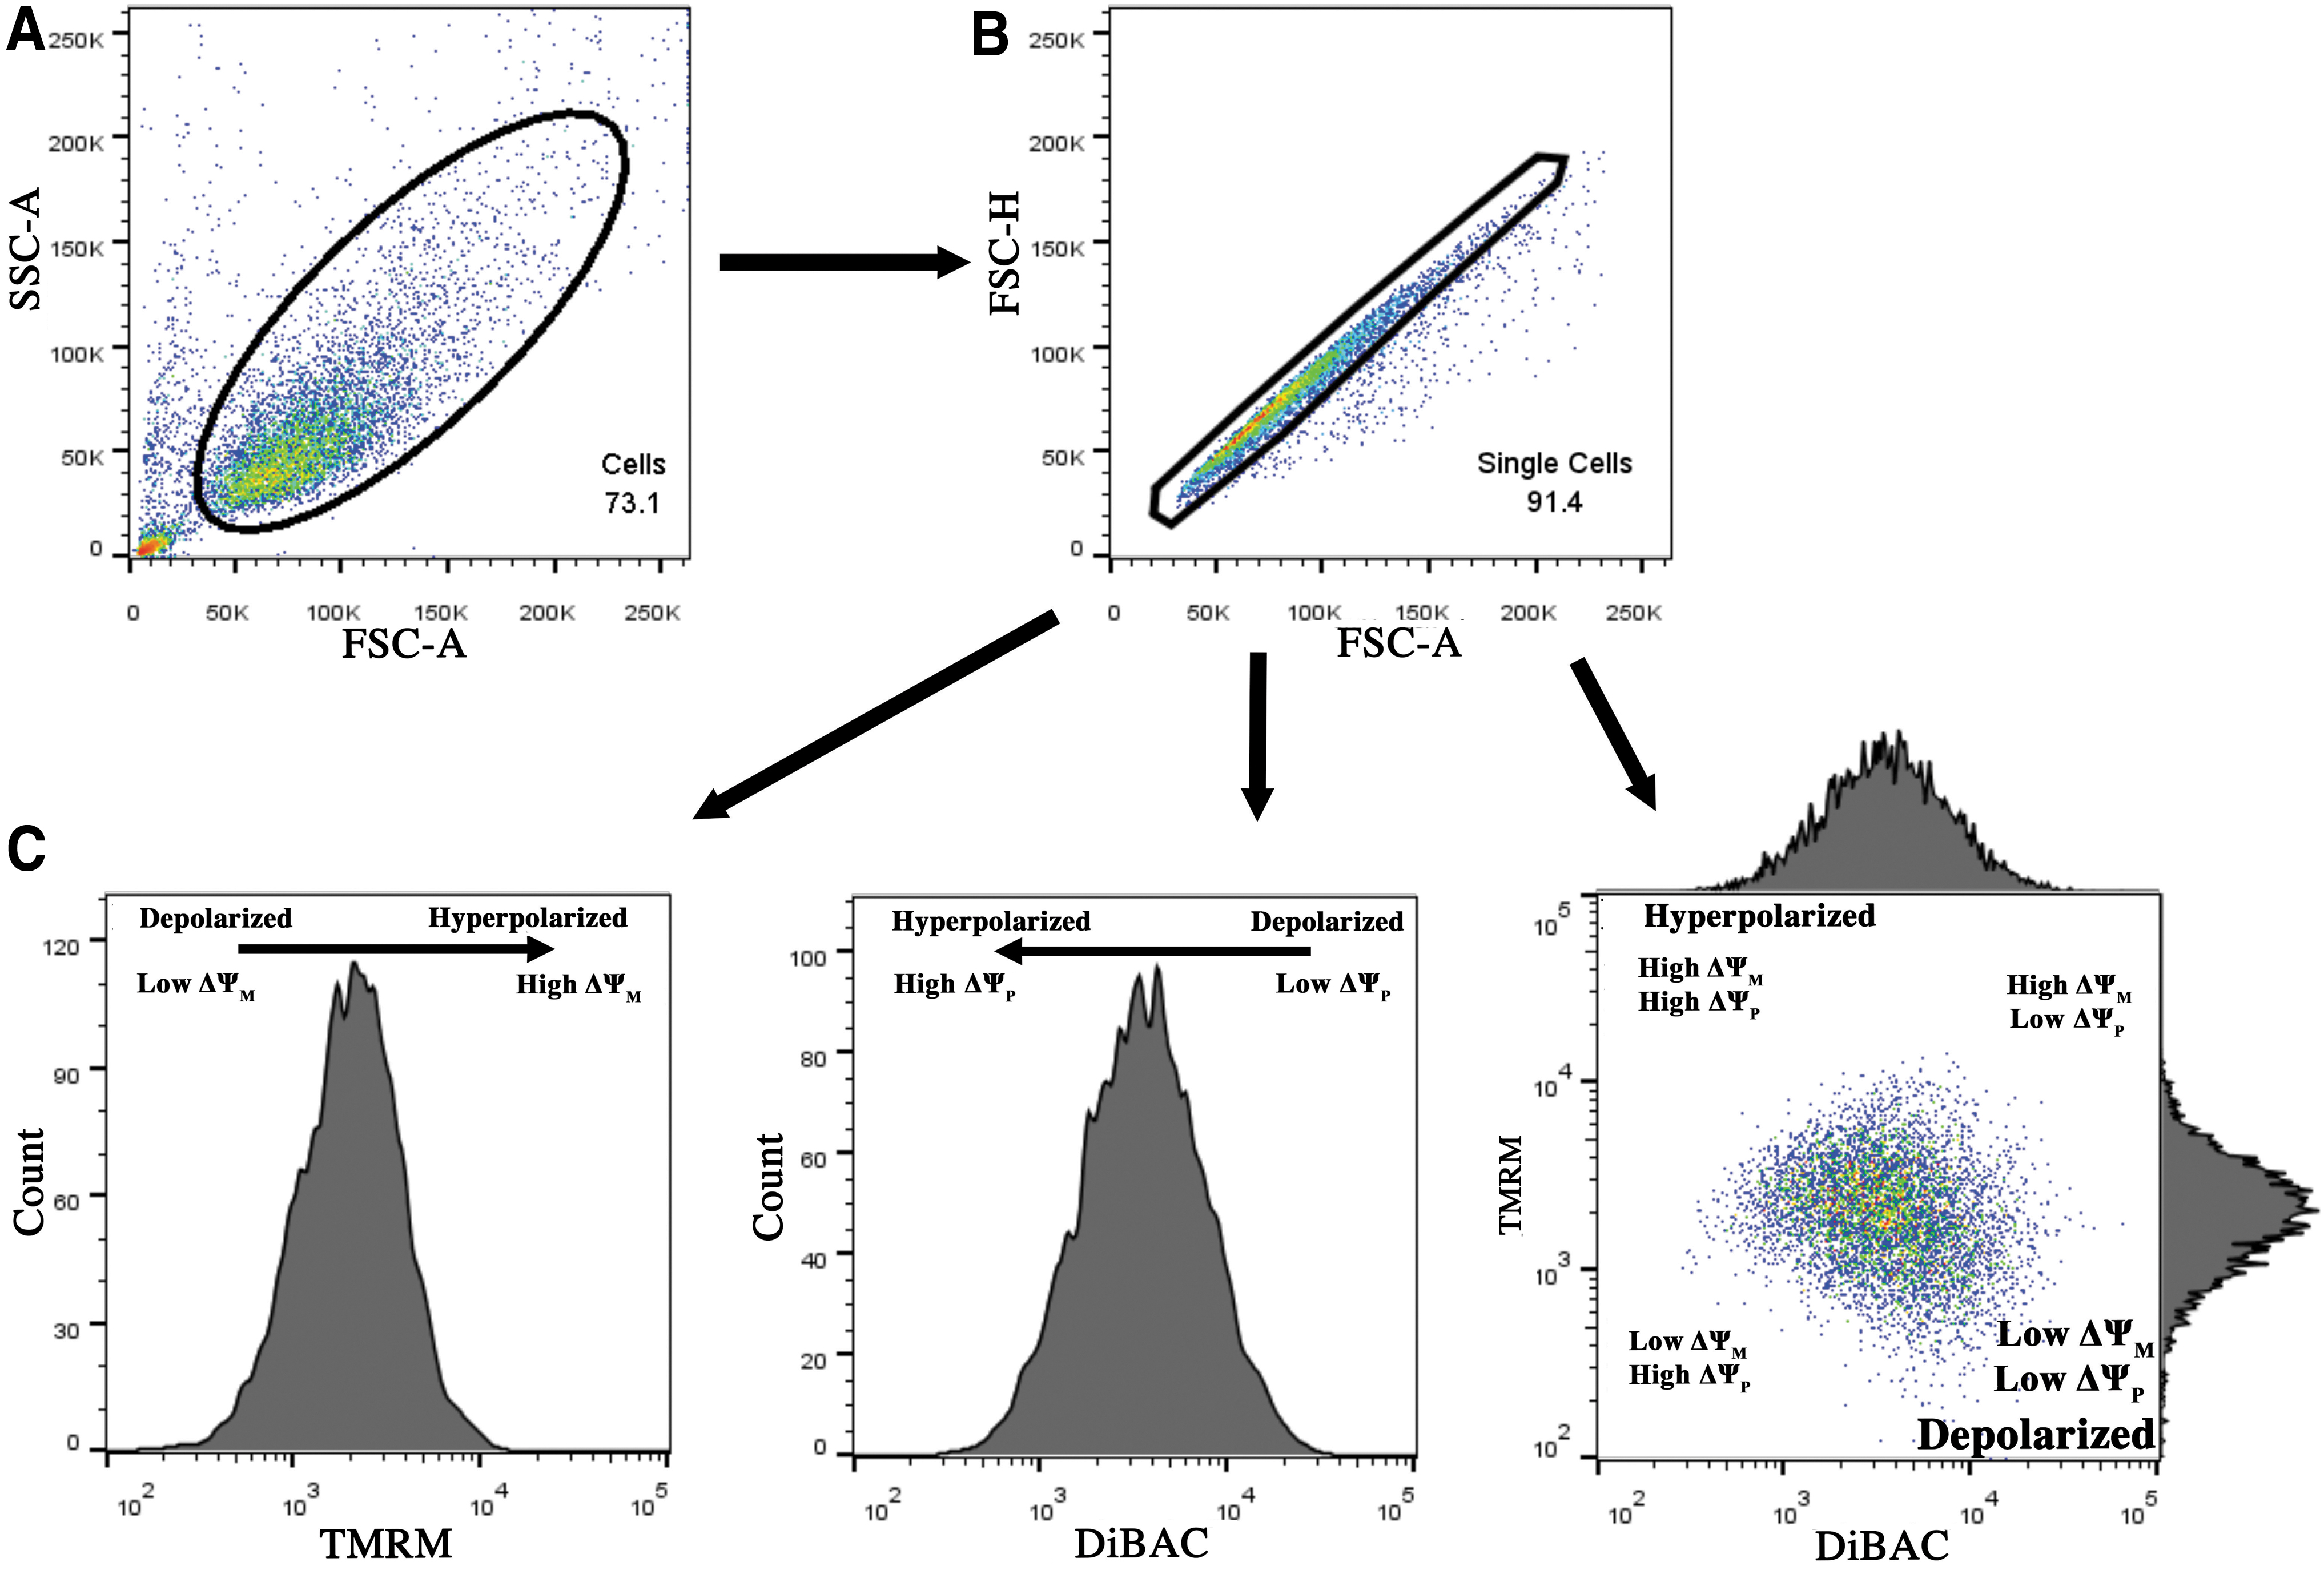
Gating strategy for assessment of bioelectrical state of MSCs.
To assess the extent to which the TMRM measures were reflecting ΔΨP as well as ΔΨM, we analyzed the correlation between TMRM and DiBAC intensities. Interestingly, we observed negligible correlation between the intensity of two dyes (r = −0.13, p < 0.0001, Fig. 2), suggesting that TMRM can be assumed to primarily reflect ΔΨM. TMRM intensity was, however, positively correlated with FSC-A and SSC-A (r = 0.65 and 0.51, respectively, p < 0.0001), suggesting that MSCs of greater size and granularity in general have greater TMRM signals. In addition, the magnitude of DiBAC signal was also moderately correlated with cellular granularity (r = 0.46, p < 0.0001), although the correlation between DiBAC and cell size was limited (r = 0.22, p < 0.0001).
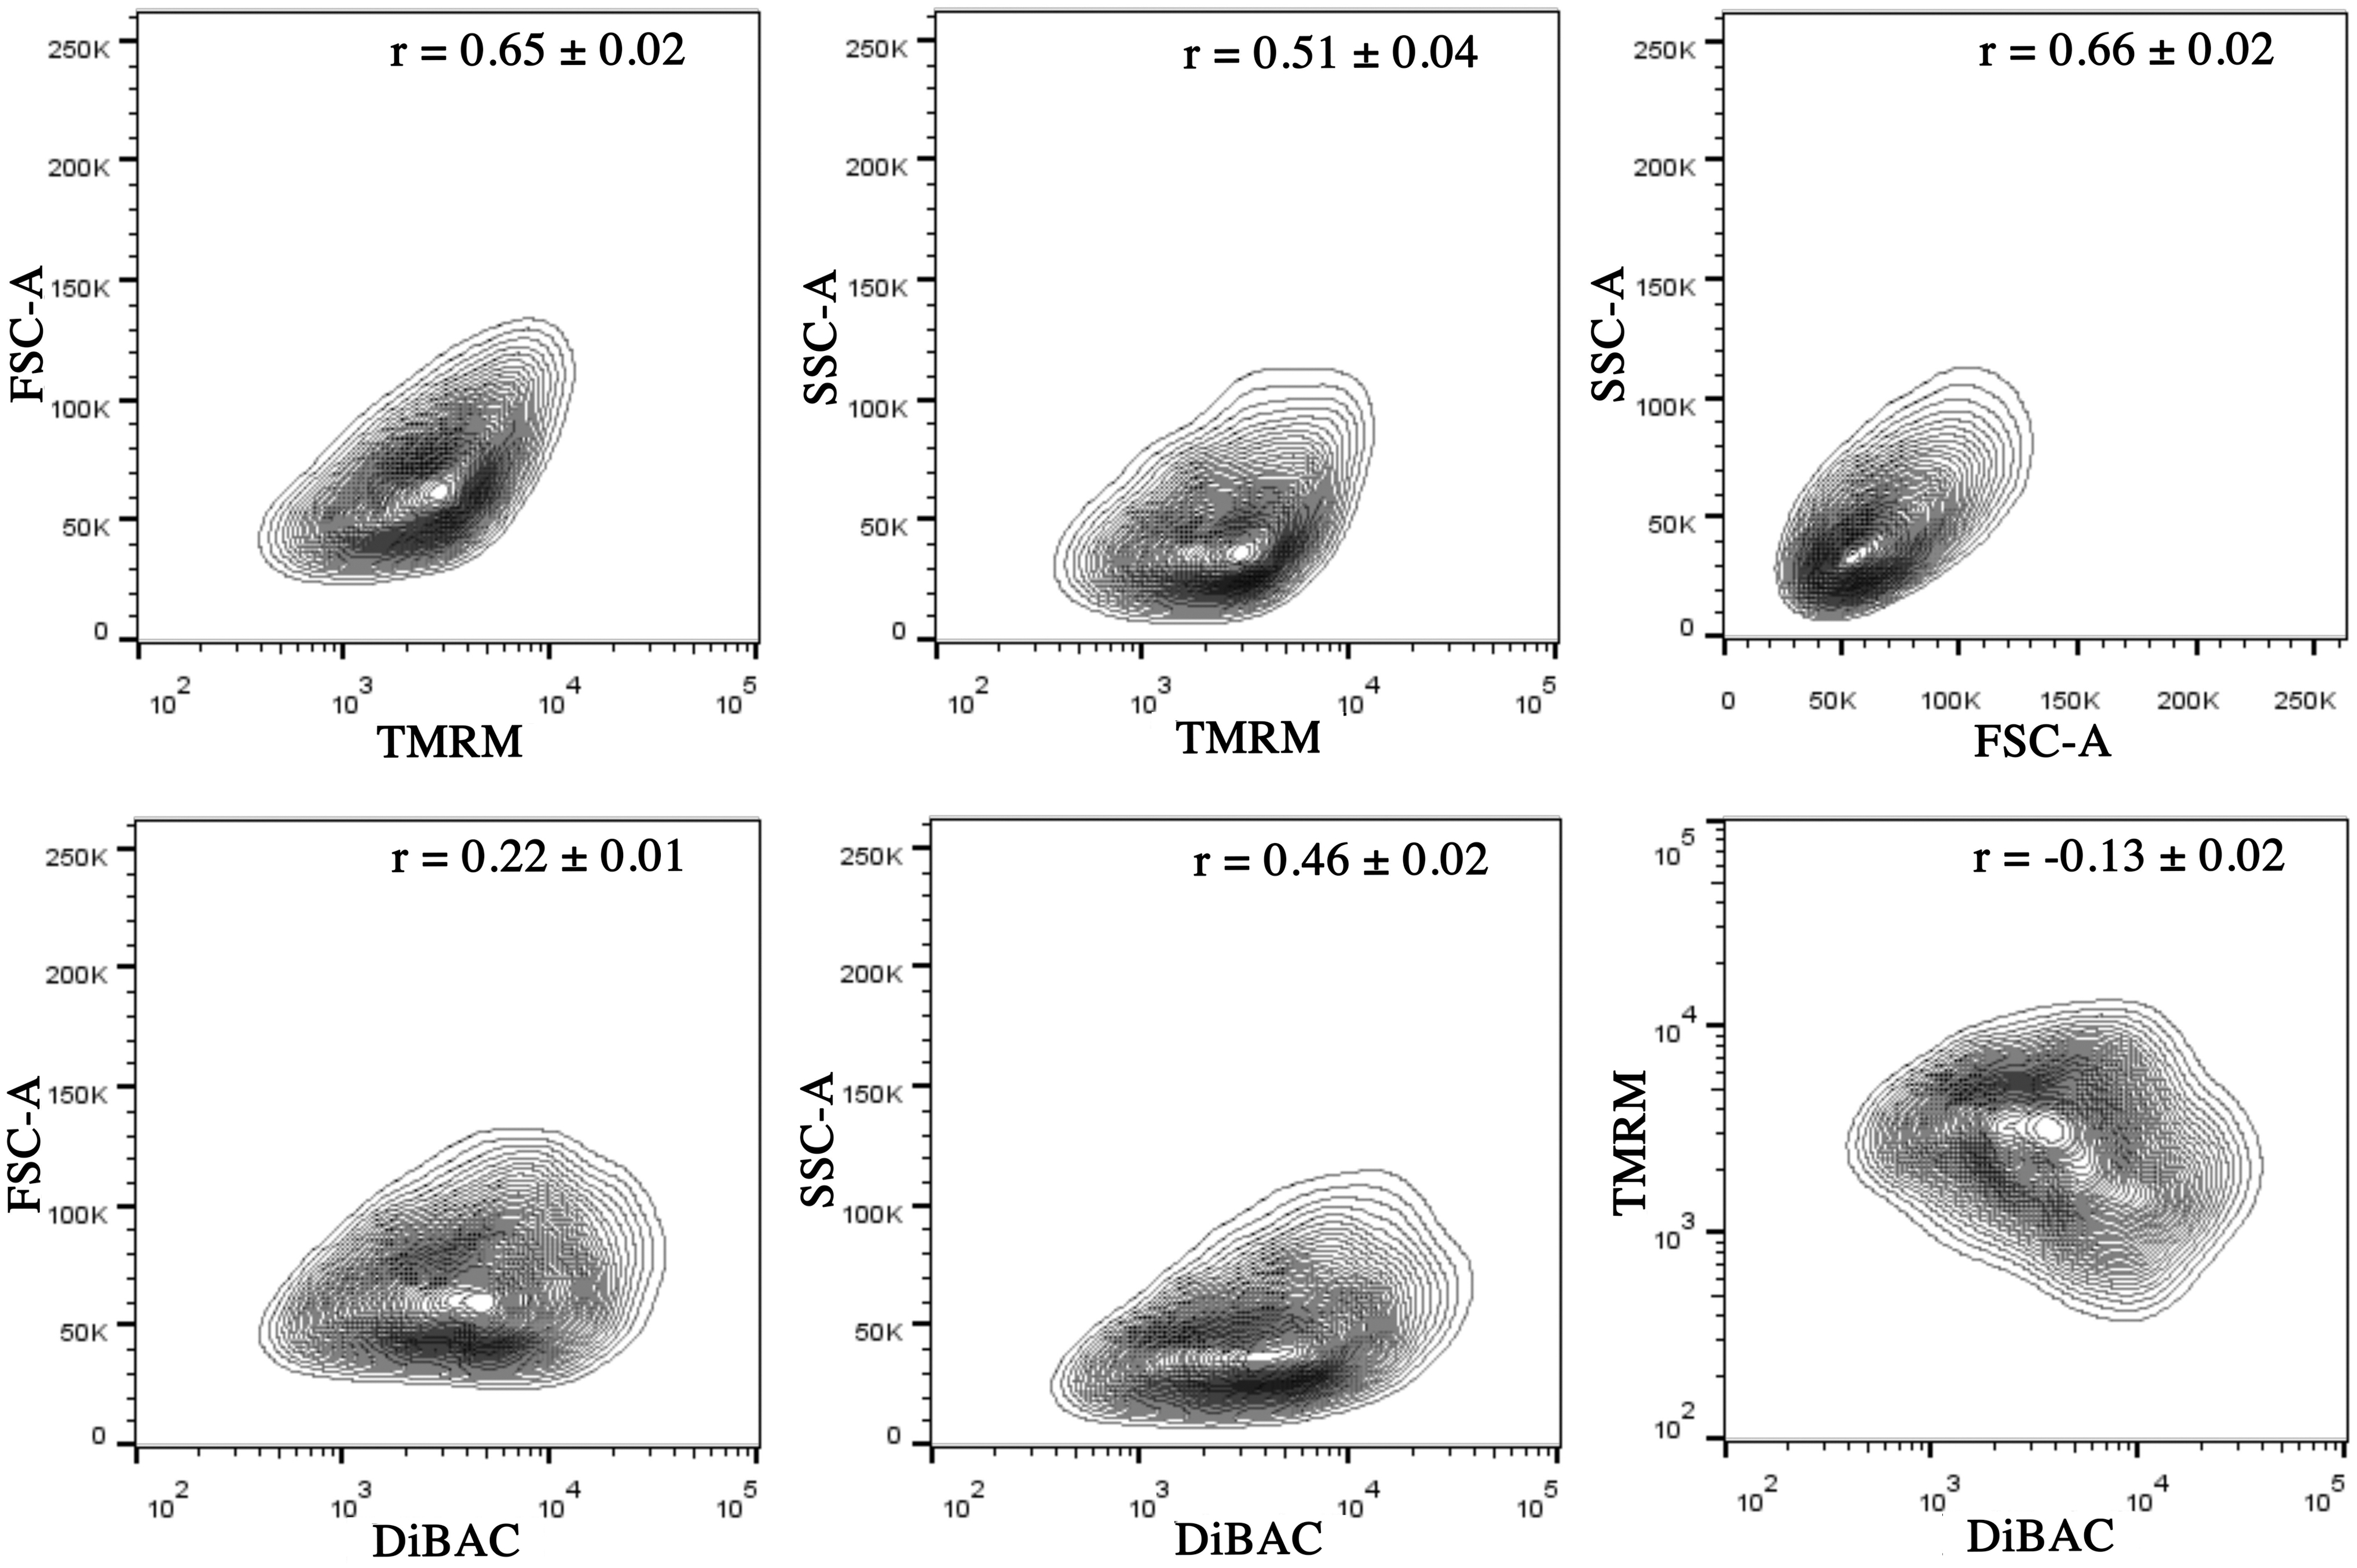
Correlation analysis between FSC-A, SSC-A, TMRM, and DiBAC. r = Pearson correlation coefficient ± standard deviation. Representative data from three experiments (two to three technical replicates each). FSC-A, area of forward scatter; SSC-A, area of side scatter.
To understand the degree of signal heterogeneity within the cell population, we binned and analyzed populations within the high, medium, and low 20% of the DiBAC signal (ΔΨPH, ΔΨPM, and ΔΨPL, respectively, Fig. 3A). The selected binning threshold is consistent with our previous study on electrical enrichment of MSCs. 25 We then compared DiBAC MFI of binned subpopulations and found ΔΨPH had an 8.7-fold greater DiBAC signal than ΔΨPL, whereas ΔΨPM had on average a 3.2-fold greater DiBAC signal than ΔΨPL (p < 0.001, Fig. 3B). When examining TMRM MFI in the various subpopulations, ΔΨPL was associated with a 1.6-fold (p < 0.001, Fig. 3C) and 1.1-fold greater TMRM signal (p = 0.026) than ΔΨPH and ΔΨPM, respectively. For stem cell granularity (SSC-A), ΔΨPH displayed a 1.7-fold difference with respect to ΔΨPL (p < 0.001) and ΔΨPM was 1.2-fold greater than ΔΨPL (p < 0.001, Fig. 3C, SSC-A). In contrast, cell size was relatively evenly distributed between subpopulations (1.1-fold difference between ΔΨPL and ΔΨPM, and 1.2-fold difference between ΔΨPL and ΔΨPH, p < 0.001 for both, Fig. 3C, FSC-A).
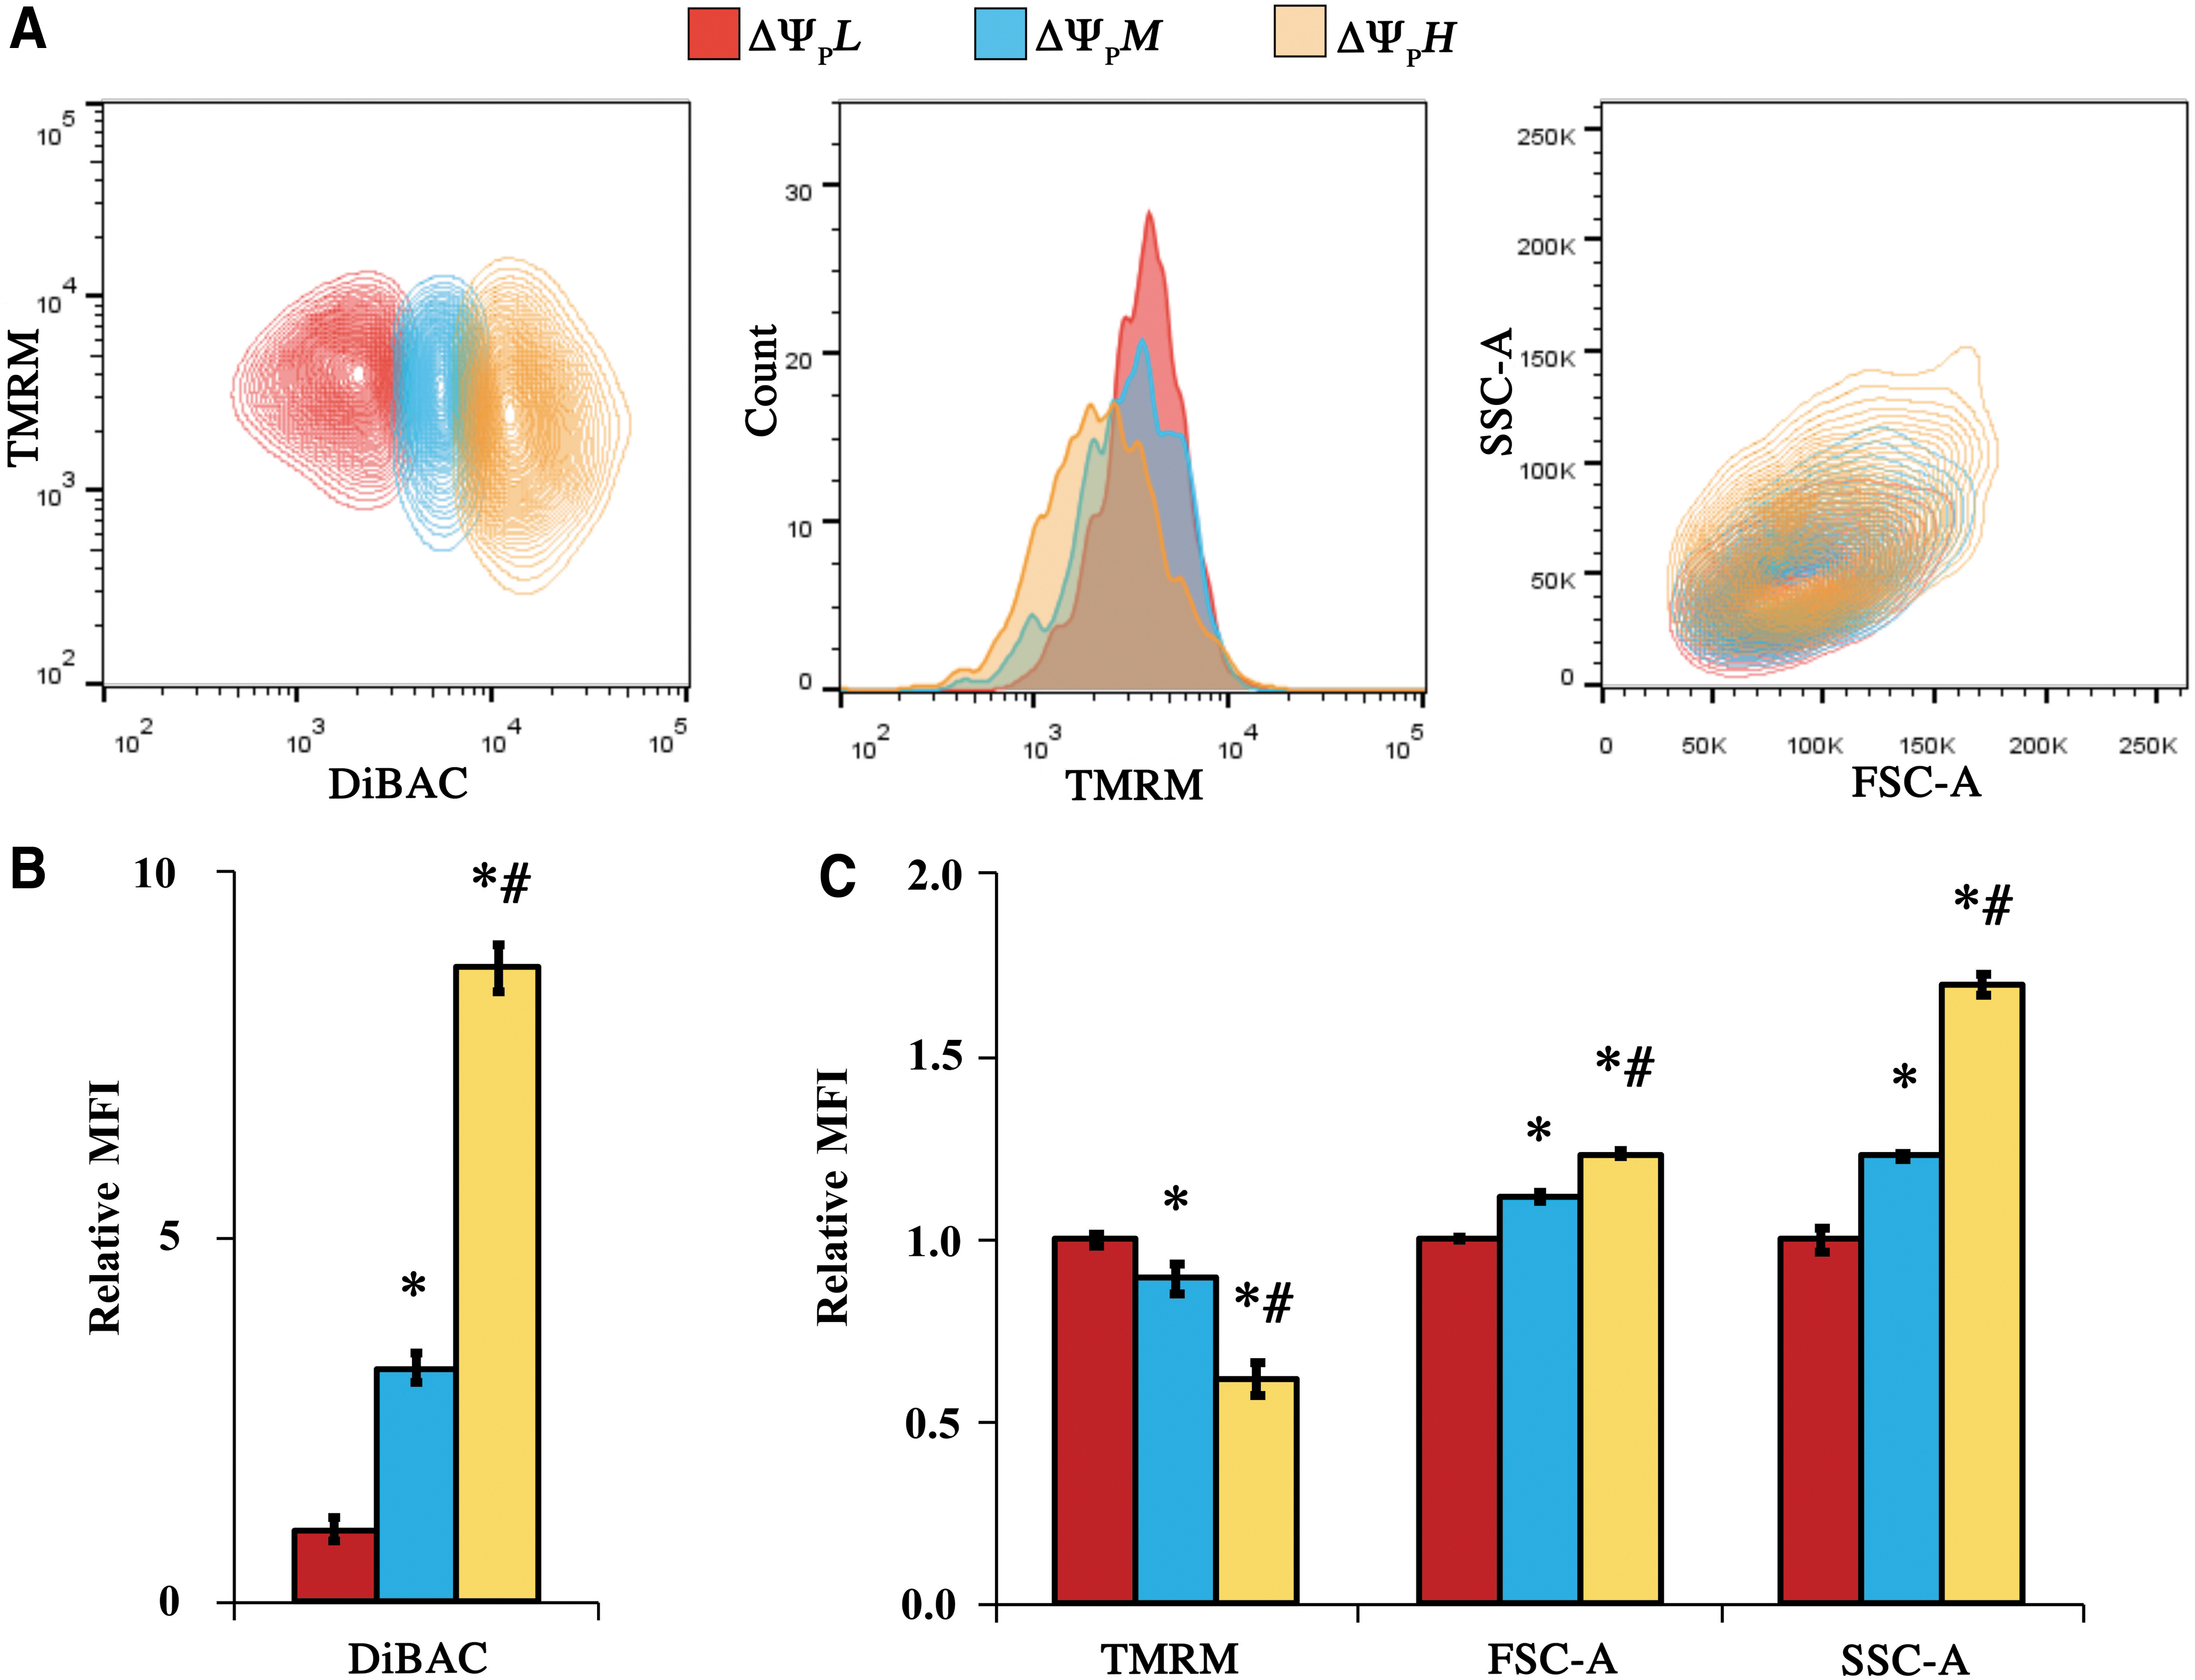
Binning the MSC populations based on top 20% DiBAC signal (ΔΨPH), medium 20% (ΔΨPM), and bottom 20% (ΔΨPL).
More complex relationships were observed when we binned and analyzed populations at the high, middle, and low 20% of the TMRM signal (ΔΨMH, ΔΨMM, and ΔΨML, respectively, Fig. 4A). ΔΨMH and ΔΨMM displayed a 5.3-fold and 2.6-fold greater TMRM MFI, respectively, relative to ΔΨML (p < 0.001, Fig. 4B). There was no statistical difference in terms of DiBAC signal between ΔΨMH and ΔΨMM subpopulations (Fig. 4C), although ΔΨML had a 1.8-fold and a 1.6-fold greater DiBAC MFI than ΔΨMM and ΔΨMH, respectively (p < 0.001, Fig. 4C). In terms of cell size, ΔΨMH displayed a 1.7-fold greater FSC-A than ΔΨML, whereas ΔΨMM had a 1.3-fold increase in FSC-A compared with ΔΨML (p < 0.001, Fig. 4C, FSC-A). Similarly, 1.7-fold greater cellular granularity was observed in ΔΨMH relative to ΔΨML (p < 0.001, Fig. 4C, SSC-A), whereas the SSC-A of ΔΨMM was only 1.1-fold greater than ΔΨML (p = 0.001). These trends persisted when the gating threshold for DiBAC and TMRM binnings was instead set to 33% (Supplementary Figs. S3 and S4, respectively).
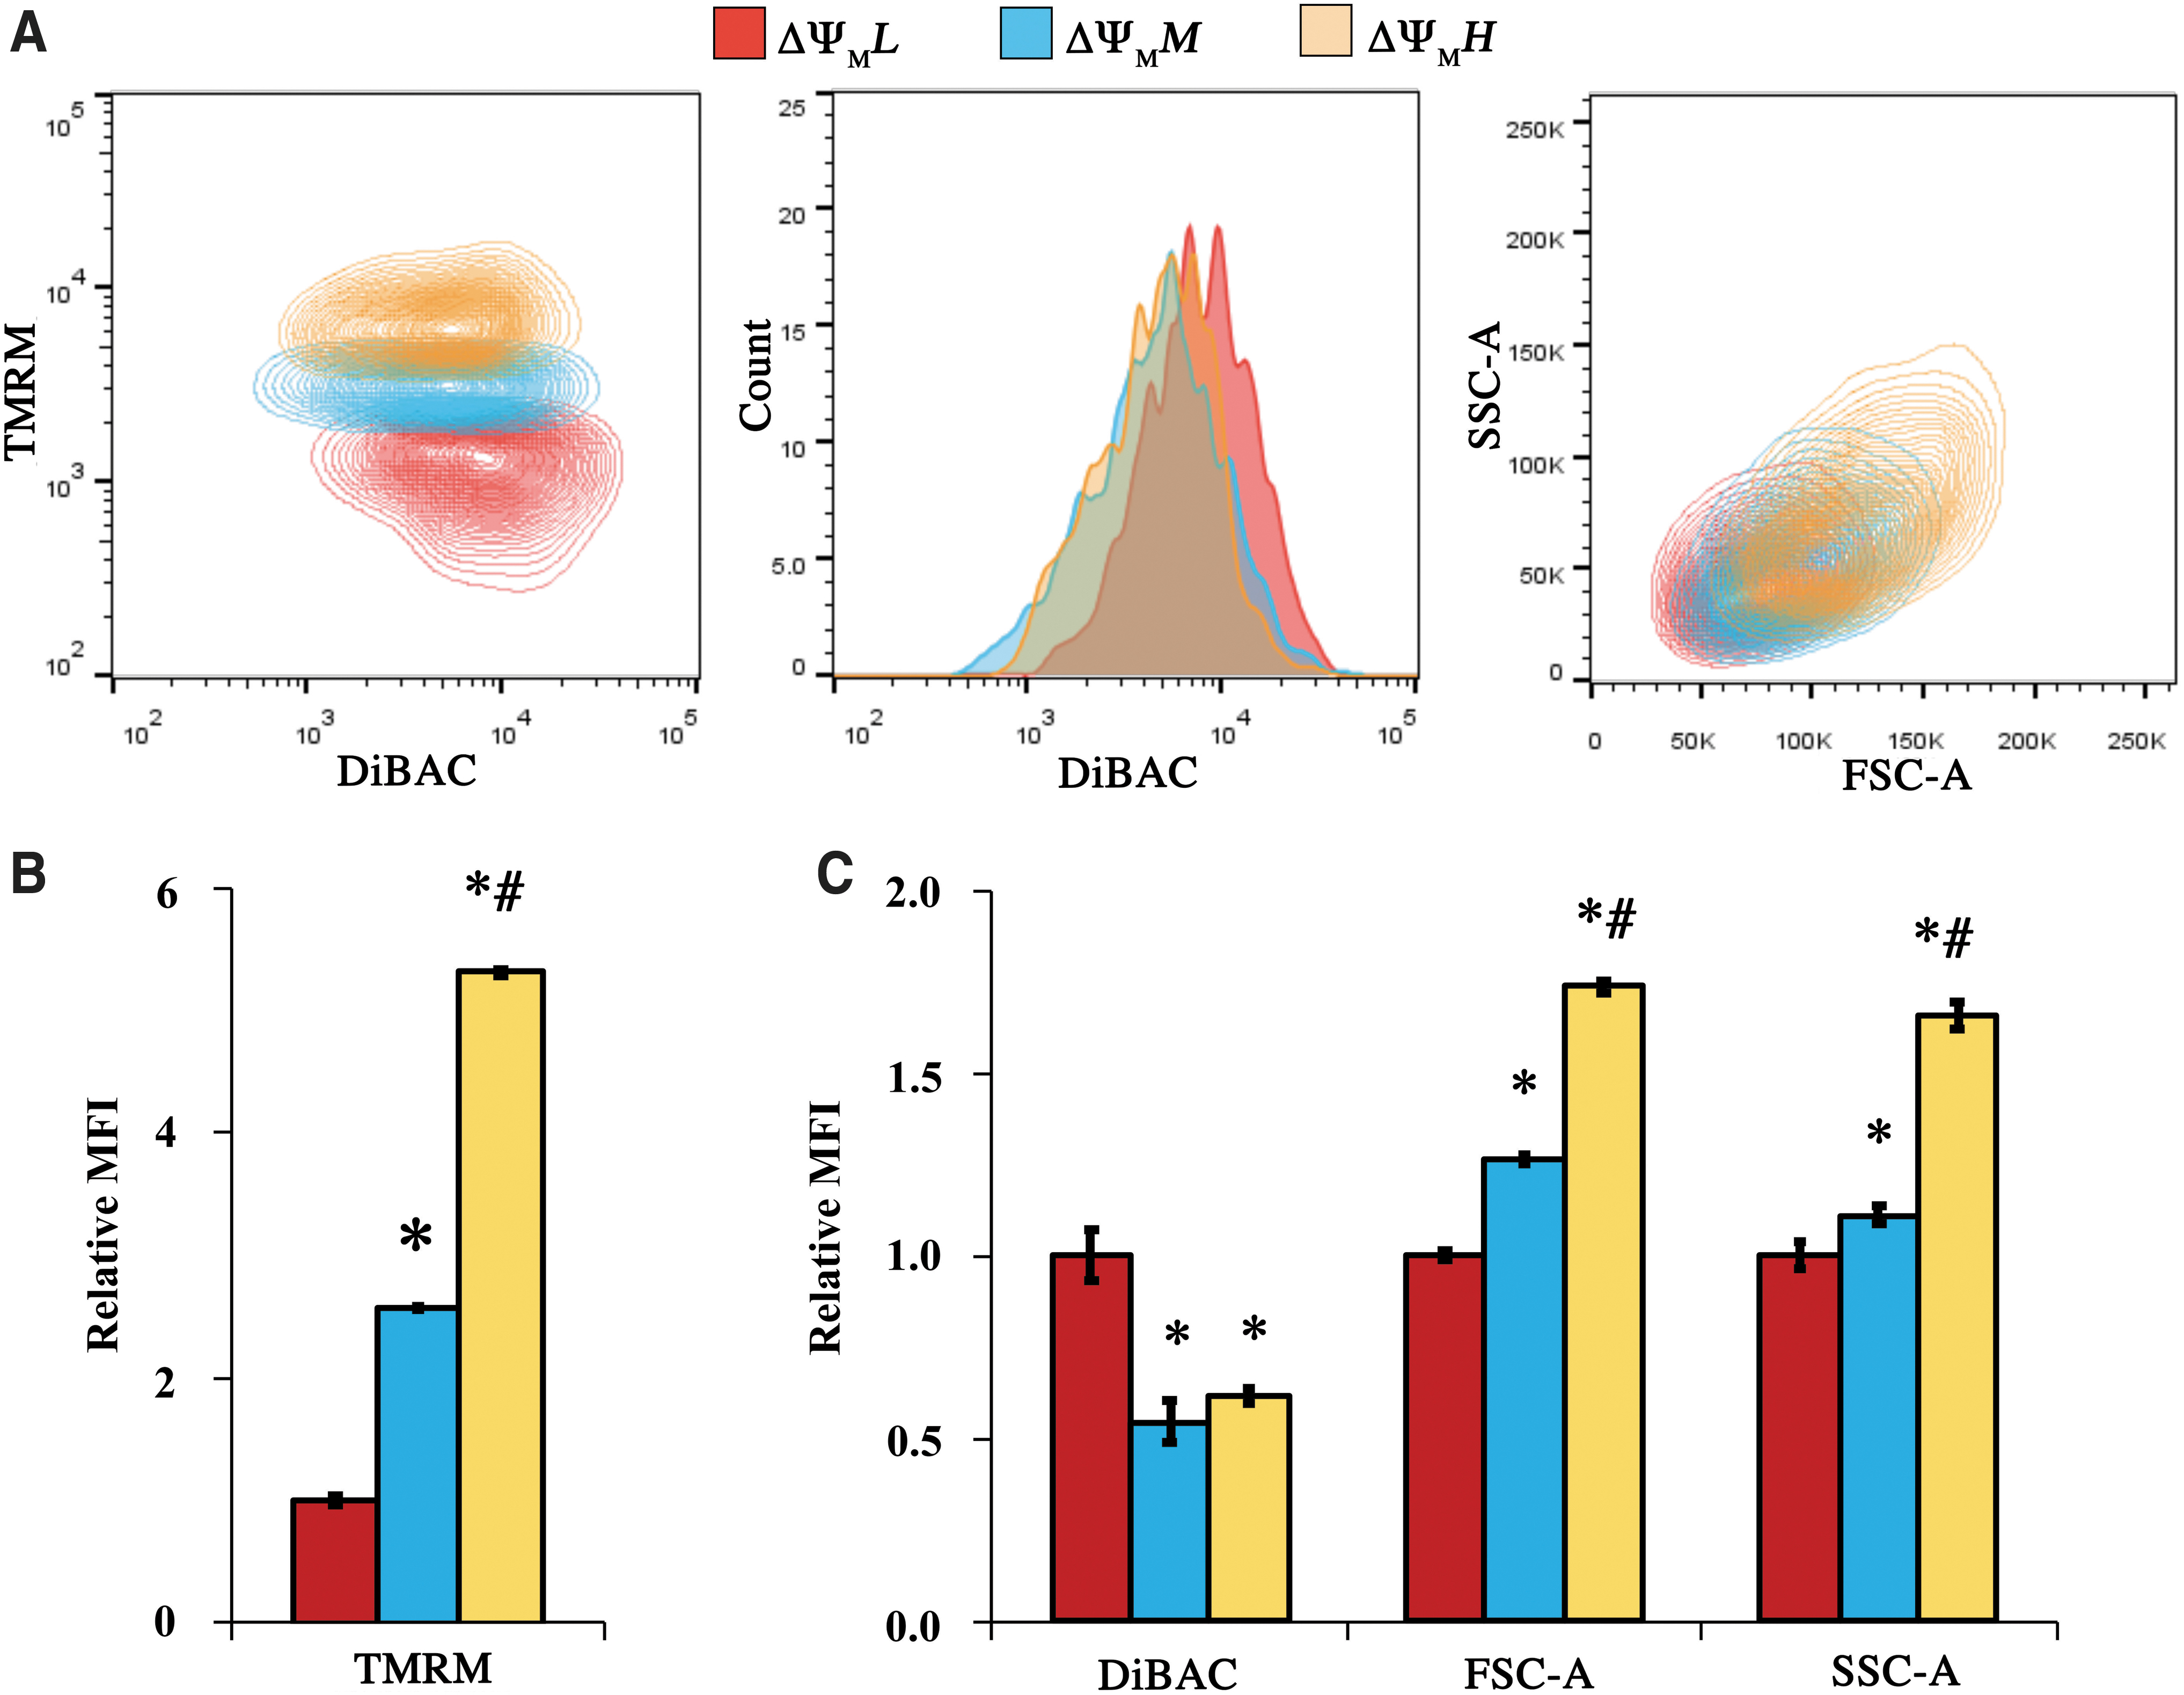
Binning the MSC populations based on top 20% TMRM signal (ΔΨMH), medium 20% (ΔΨMM), and bottom 20% (ΔΨML).
Cumulatively, these results suggest that (1) MSC cultures are made of bioelectrically heterogeneous populations both in terms of TMRM and DiBAC, (2) MSCs with high TMRM or DiBAC intensities tend to exhibit much greater granularity than MSCs with middle or low TMRM or DiBAC intensities, and (3) despite an overall negligible correlation between TMRM and DiBAC at the individual cell level, the subpopulation of MSCs characterized by higher median DiBAC intensity also displayed a lower median intensity of TMRM. This latter observation suggests the presence of a distinctly “depolarized” MSC subpopulation within the larger more diverse population of cells.
Extended in vitro culture shifts MSCs toward a hyperpolarized state
After establishing a strategy for dual DiBAC and TMRM bioelectrical assessment, we hypothesized that extended passaging of MSCs may induce bioelectrical property changes as MSCs acquire a more senescent phenotype. To test this hypothesis, we compared MSCs of passage 14–17 (“aged”) that had doubled 30–40 times since thawing to passage 4–7 “young” counterparts that had undergone <10 doublings (Fig. 5A). Representative TMRM-DiBAC and FSC-SSC-A plots are shown in Figure 5B. Quantitatively, we found that late-passage MSCs had greater TMRM MFI than early-passage MSCs (1.6-fold, p < 0.001, Fig. 5C, TMRM), whereas also having lower DiBAC intensity (1.35-fold, p < 0.001, Fig. 5C, DiBAC). “Aged” MSCs also exhibited greater cell size (1.2-fold, p < 0.001, Fig. 5C, FSC-A) and granularity (1.2-fold, p < 0.001, Fig. 5C, SSC-A) than “young” MSCs. In addition, “aged” MSCs displayed greater CV in terms of DiBAC, FSC-A and SSC-A distributions (1.1-fold, p < 0.002, Fig. 5D) than “young” MSCs, suggesting greater population heterogeneity in these signals in the “aged” population.

“Aged” MSCs (A-MSCs) are in a distinct bioelectrical state than “young” MSCs (Y-MSCs).
Cumulatively, these results suggest that extended culture of MSCs in vitro is associated with shift in bioelectrical properties toward greater TMRM and lower DiBAC intensities. This may imply that processes associated with aging induce MSCs to acquire a more hyperpolarized state.
IFN-γ priming depolarizes plasma membrane but increases TMRM signal
Priming of MSCs with inflammatory cytokines is known to activate their immunosuppressive functions, with IFN-γ being a potent and well-studied stimulant. 30 We hypothesized that the bioelectrical properties of IFN-γ activated MSCs may be shifted from that of nonactivated MSCs. After 24 h exposure to medium supplemented with 20 ng/mL IFN-γ, MSCs were collected for flow cytometry. Representative TMRM-DiBAC and FSC-SSC-A charts are shown on Figure 6A. We observed that activated MSCs had greater TMRM (1.4-fold, p = 0.001, Fig. 6B, TMRM) as well as DiBAC MFI (1.3-fold, p = 0.001, Fig. 6B, DiBAC) relative to nonactivated MSCs. In addition, activated MSCs had greater size (1.3-fold, p < 0.001, Fig. 6B, FSC-A) and granularity (1.2-fold, p < 0.001, Fig. 6B, SSC-A) than nonactivated controls. IFN-γ was also associated with lower CVs for the TMRM, DiBAC, FSC-A (1.15-fold, p < 0.001, Fig. 6C) and SSC-A (1.05-fold, p = 0.02, Fig. 6C) distributions, indicating decreased population heterogeneity in the activated MSCs.
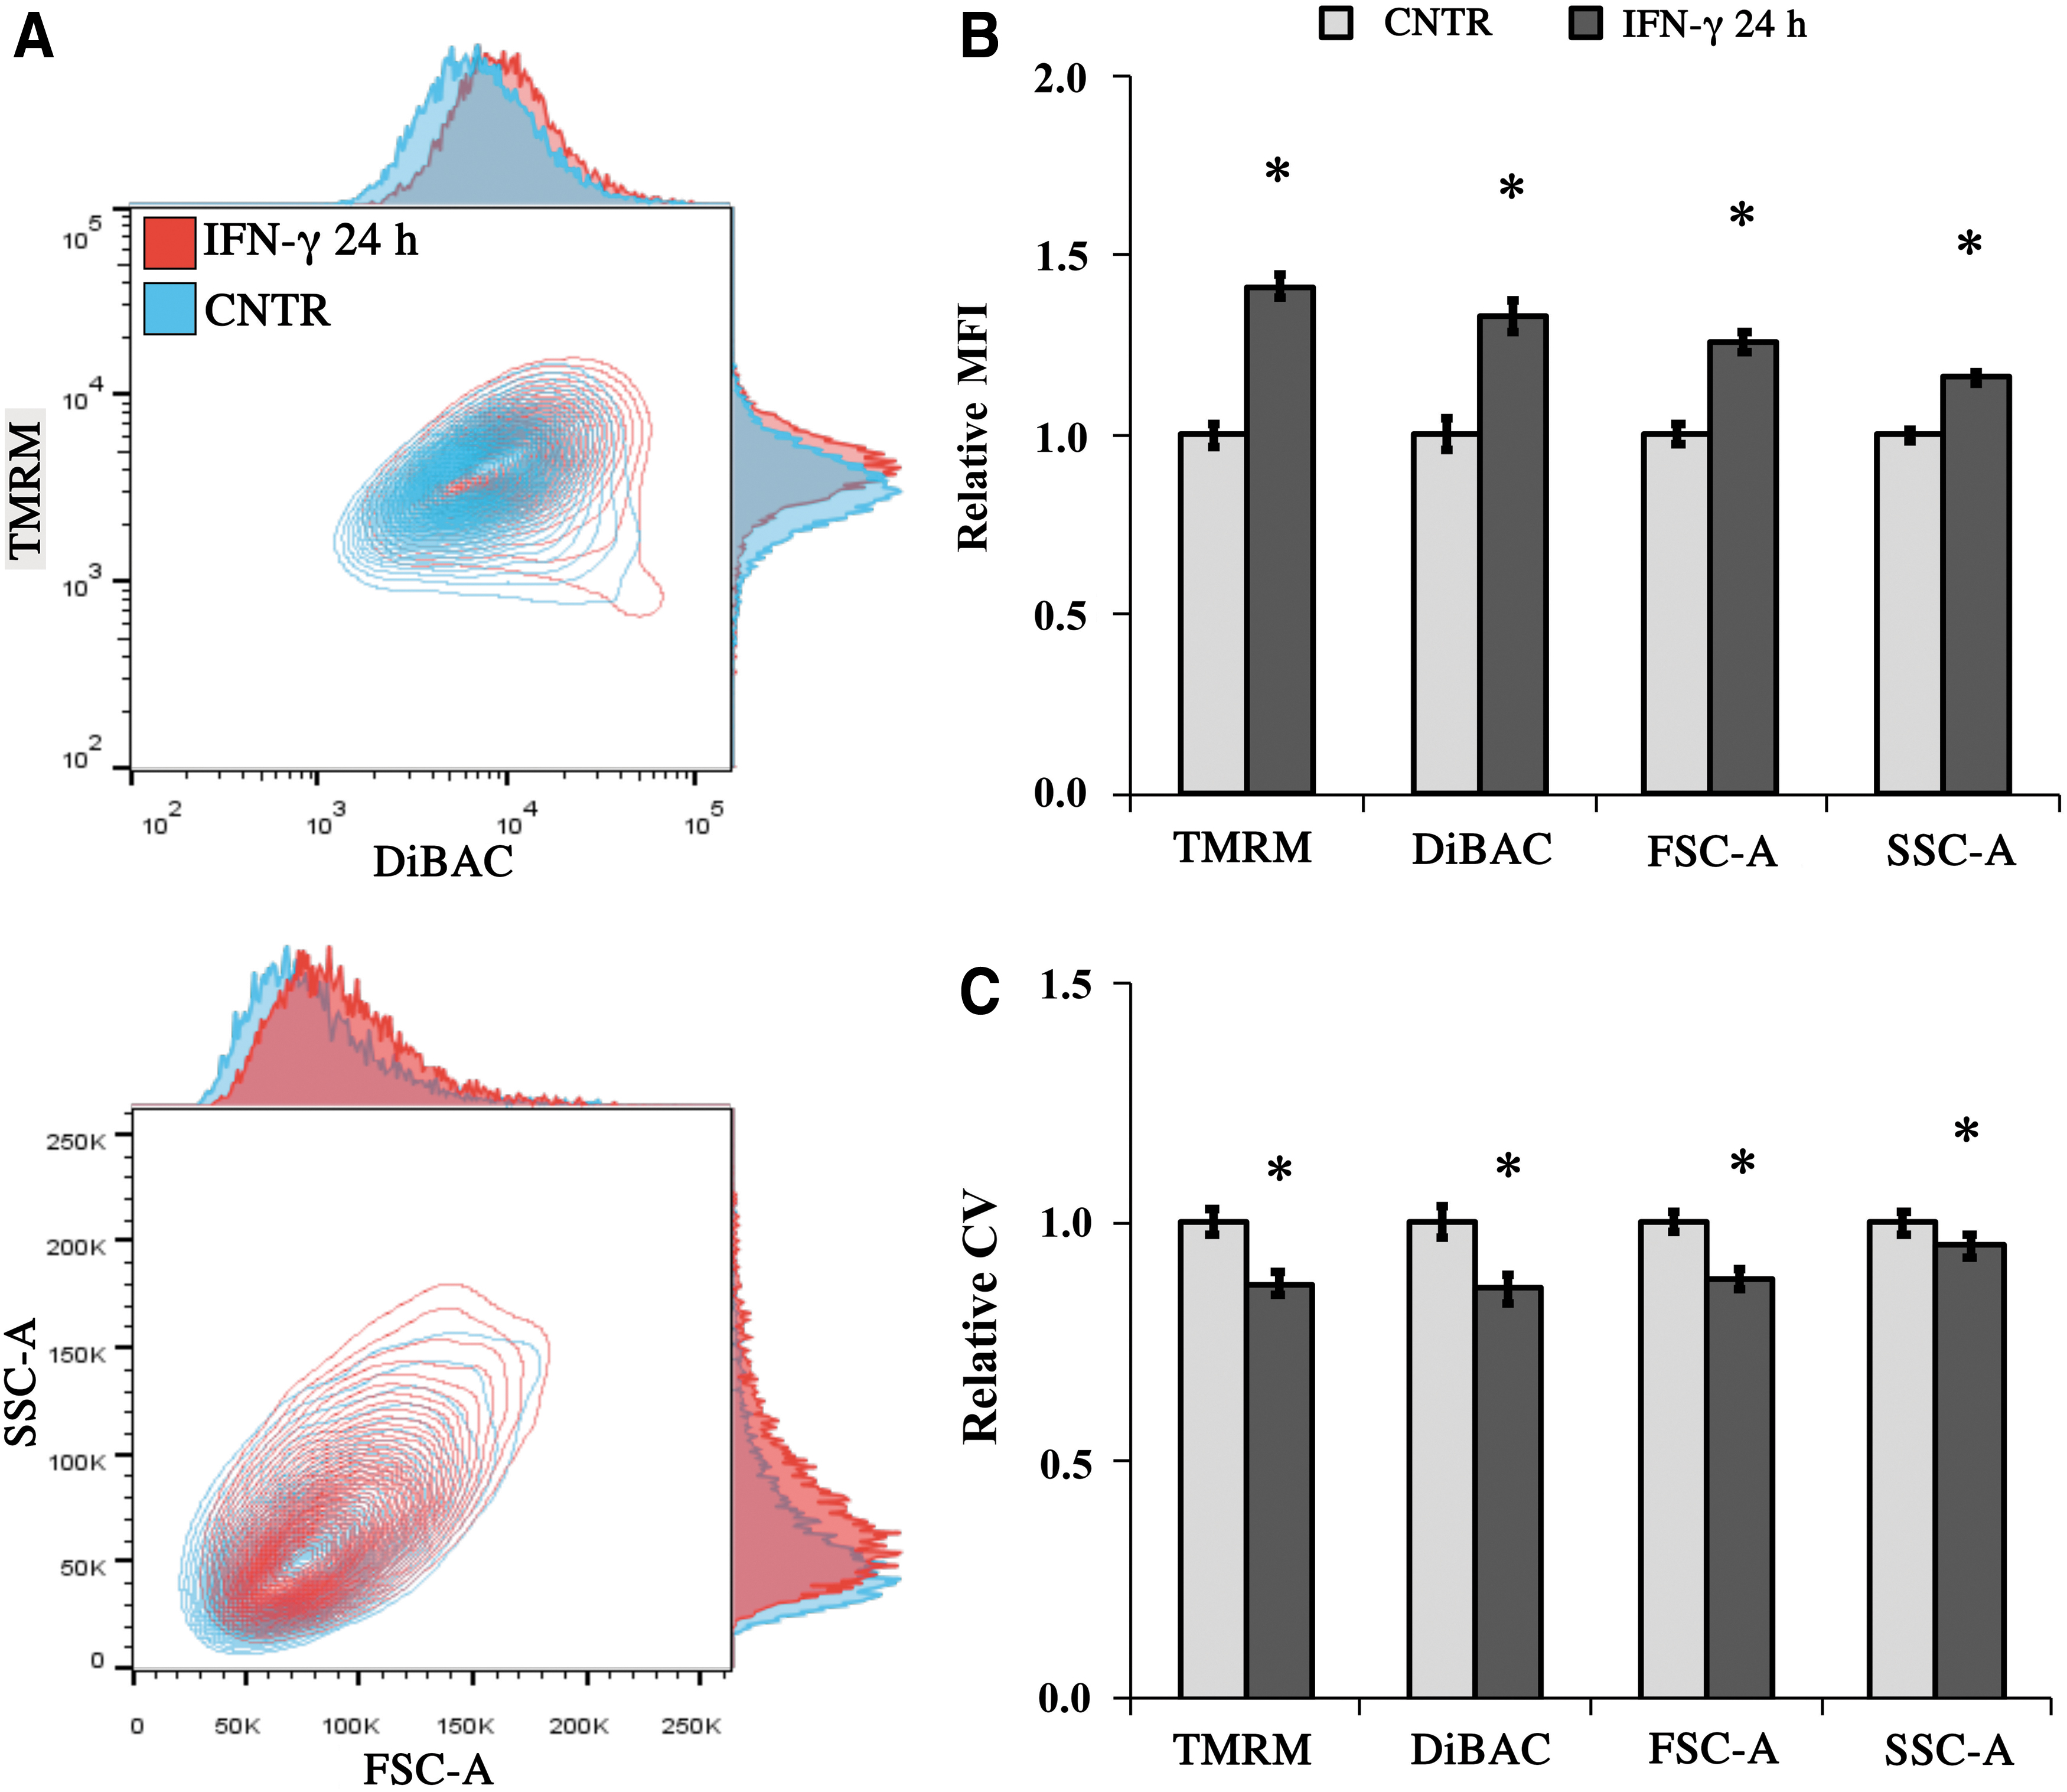
MSCs primed with IFN-γ are in a distinct bioelectrical state than unprimed MSCs.
Cumulatively, these results suggest that priming of MSCs with IFN-γ is associated with a shift in bioelectrical properties toward greater TMRM and DiBAC intensities, indicating that activated MSCs may possess lower ΔΨP and greater ΔΨM than nonactivated MSCs. We also found that MSC activation may reduce population heterogeneity in terms of bioelectrical and cellular properties.
Aggregate conditions shift populations toward partially depolarized state
Next, we hypothesized that culturing MSCs as nonadherent aggregates (also known as spheroids) would result in shifts in bioelectrical properties relative to adherent controls. We seeded 5000 MSCs into ultralow attachment plates and cultured them for 72 h before dissociation and running flow cytometry. Representative charts are shown in Figure 7A. Aggregate conditions reduced MSC TMRM MFI with respect to adherent cells (1.4-fold, p = 0.02, Fig. 7B, TMRM). FSC-A and SSC-A signals were also significantly lower in spheroids compared with adherent cells (1.5- and 1.45-fold, respectively, p < 0.003, Fig. 7B). However, we observed inconsistent relative DiBAC intensities between adherent and aggregate MSCs (Fig. 7B, DiBAC). Despite the lack of a statistical difference between the DiBAC MFI of adherent and aggregate MSCs, we observed lower CV in the DiBAC distribution within aggregates (1.5-fold, p = 0.006, Fig. 7C, DiBAC). In contrast, TMRM, FSC-A, and SSC-A distributions were more variable in spheroids (1.3-, 1.1-, and 1.3-fold, respectively, p < 0.004, Fig. 7C) than adherent cells.

The effect of aggregate conditions on bioelectrical state depends on the age of MSC.
Aggregate conditions have been suggested as a means of priming of extensively cultured MSCs to enhance their efficacy, mostly in terms of secretion of immunoregulatory proteins. 31 Thus, we asked whether culturing “aged” MSCs in aggregate conditions may bioelectrically rejuvenate them by shifting their bioelectrical properties toward a more depolarized state, that is, opposite of aging effect observed in Figure 4. Representative charts are shown in Figure 7D. The shift in TMRE, FSC-A, and SSC-A intensities for “aged” MSCs (passage 12–17) due to aggregate conditions was consistent with the shift of “young” MSCs from “aged” MSCs under 2D conditions. However, we observed that instead of increasing DiBAC MFI, 72 h culture of late-passage MSCs under aggregate conditions decreased the DiBAC signal (2.7-fold, p < 0.001, Fig. 7E) suggesting hyperpolarization of ΔΨP. In addition, unlike “young” MSCs, aggregate culture of “aged” MSCs did not decrease the CV in the DiBAC distribution (Fig. 7F).
Cumulatively, these results suggest that aggregate conditions shift the bioelectrical state of MSCs primarily by reducing mitochondrial polarization. However, aggregate culture of “aged” MSCs resulted in a different bioelectrical shift with respect to “aged” adherent cells than early-passage MSCs.
Discussion
Recent findings in the field of bioelectricity indicate that bioelectrical signals play a critical role in cellular phenotype and tissue organization, in part through a complex feedback mechanism between bioelectrical properties of cells and gene expression patterns.25,32–36 The bioelectrical properties of cells are defined mostly by ΔΨP in current literature. In this study, we propose simultaneous assessment and visualization of both ΔΨM (as described by TMRM) and ΔΨP [as described as DiBAC4(3)] may provide more complete information about cell bioelectrical properties. ΔΨM is another powerful bioelectrical parameter and serving as a torque for ATP synthesis is just one of its many functions. It also has a variety of nonenergy-producing functions that are essential for the maintenance of cellular homeostasis, including mitochondrial quality control, reactive oxygen species generation, and mitochondria-to-nucleus retrograde signaling. 37
Assessment of ΔΨM alongside with ΔΨp also has a technical advantage. Practically all ΔΨM probes are nonspecific lipid-binding agents that accumulate in charged membranes of both the mitochondria and cytosol. DiBAC, on the contrary, binds exclusively to the plasma membrane due to its negative charge, thereby serving as reliable indicator of ΔΨP as well as an indirect measure of the contribution of the ΔΨM probe to the ΔΨP signal. Other limitations of ΔΨM probes are necessary to keep in mind when interpreting results. For instance, ΔΨM probes have common limitations, including nonspecific and ΔΨM-independent binding to intracellular components, the contribution of mitochondria:cell volume fraction (or surface-to-volume ratio) to the intracellular dye concentration, as well as partial electrical transport chain inhibition.26,38
However, the general consensus is that TMRM is a reasonable choice for the relative assessment of ΔΨM levels. Despite that ΔΨP being a known contributor to the TMRM signal, a low correlation coefficient was observed (r = −0.13) between DiBAC and TMRM levels, suggesting that the TMRM signal has limited impact on MSC ΔΨP. In contrast, significant correlation was observed between TMRM and cell size (FSC-A) and cell granularity (SSC-A), suggesting that mitochondria may contribute to MSC cell size and cell complexity measures.
Our proposed assay revealed that MSCs cultured in vitro had a distinct subpopulation of cells characterized by a depolarized phenotype (low TMRM–high DiBAC) (Figs. 5B and 7A). This subpopulation displayed even greater separation at later passages, as cells shifted toward a hyperpolarized state. We have also found that MSCs are a heterogeneous population in terms of DiBAC and TMRM levels, as ΔΨMH had a fivefold difference in TMRM relative to ΔΨML, whereas ΔΨPH had an eightfold difference in DiBAC relative to ΔΨPL.
We envision that our assay can be applied to study the bioelectrical phenotypes of the nonexcitable cells in various contexts. Specifically, here we studied the shifts in MSC bioelectrical properties in well-studied cases that are known to significantly impact MSC state and function. Previous studies of the bioelectrical properties of MSCs have been limited to characterization of either ΔΨP or ΔΨM. To our knowledge, this is the first study to attempt to simultaneously measure changes in both bioelectrical properties due to extended passaging, stimulation with IFN-γ and culture in aggregate conditions.
Extended passaging of MSCs is often necessary to generate a sufficient number of patient-isolated cells for therapeutic applications. This step is associated with onset of senescence, 39 spontaneous differentiation, 40 and a decrease in immunoregulatory capacity. 41 We, therefore, hypothesized that extended passaging would also be associated with a change in MSC bioelectrical properties. We observed that late-passage MSCs transitioned to a hyperpolarized state described by greater levels of TMRM (higher ΔΨM) and lower levels of DiBAC (higher ΔΨP). Previous attempts to compare the levels of ΔΨM of the early- and late-passage MSCs using the ratiometric probe JC-1 have reported conflicting results,42,43 due in part to technical limitations surrounding the JC-1 probe.26,37
Stimulation of MSCs with inflammatory cytokines, such as IFN-γ, induces MSCs to polarize toward a T cell inhibitory and immunoregulatory phenotype, characterized by increased expression of indoleamine-pyrrole 2,3-dioxygenase, 44 C-X-C motif chemokine 9, 10 and 11, 45 prostaglandin E2 (PGE2), transforming growth factor-beta, 46 and other cytokines. We thus hypothesized that IFN-γ-primed MSCs would display different bioelectrical properties than resting MSCs. Indeed, MSCs stimulated with 20 ng/mL IFN-γ had increased TMRM and DiBAC levels, suggesting depolarized ΔΨP but hyperpolarized ΔΨM. Our results are in contrast to previous findings by Liu et al. who reported decreased TMRM levels of MSCs primed with 40 ng/mL IFN-γ. 47 The discrepancy may be due in part to the differences in experimental conditions, such as dosing. Liu et al. also washed out the TMRM dye after incubation, which could have disrupted the Nerstian equilibrium and the total available dye concentration. The complex nature of IFN-γ stimulation is further illustrated by the fact that reports on the metabolic reconfiguration of IFN-γ-primed MSCs differ between separate studies,47,48 thereby warranting greater scope of experimental conditions and sources of MSCs in future studies.
Self-assembly of MSCs into aggregates under nonadherent conditions is well known to alter stem cell state and function. Aggregate-derived MSCs were reported to have increased expression of pluripotency-related genes, 49 decreased expression of senescent markers, 50 and increased glycolytic metabolism. 51 Functionally, the therapeutic capacity of aggregate-derived MSCs appears to be enhanced in part due to increased expression of angiogenic and antiapoptotic factors (e.g., epidermal-, insulin-like, hepatocyte-, and vascular endothelial growth factors),52–54 anti-inflammatory factors (e.g., tumor necrosis factor-inducible gene 6 protein, PGE2),55,56 as well as increased survival of MSCs in vivo. 50 Altogether, these reports prompted us to hypothesize that the bioelectrical properties of MSCs in aggregates may differ from MSCs in monolayer. Indeed, we observed that TMRM levels were lower in aggregates (passage 4–7, 5000 cells per aggregate) than in monolayer, which is consistent with previous reports, 57 suggesting lower ΔΨM. However, unlike ΔΨM probe levels, we did not observe consistent differences in ΔΨP between adherent and aggregate-derived MSCs.
Recently, Bartosh and Ylostalo demonstrated that the effect of priming MSCs with aggregate conditions becomes more prominent when applied to MSCs of later passages. 31 Hence, we asked whether the shift in MSC bioelectrical properties would differ if the aggregates were generated from late-passage MSCs. Based on literature, we hypothesized that aggregate conditions may shift the bioelectrical properties of “aged” MSCs in the opposite direction of the bioelectrical shift associated with extended 2D culture, that is, toward a depolarized state (low TMRM–high DiBAC). Interestingly, although we observed a shift in TMRM toward a depolarized state, aggregate conditions of “aged” MSCs also induced a decrease, rather than increase, in DiBAC levels, suggesting hyperpolarization of ΔΨP. Although our results suggest that 3D priming of extensively passaged MSCs may not rejuvenate MSCs from the bioelectrical perspective, additional studies with varying culture duration, aggregate size, and method of aggregate dissociation would be required to confirm this.
Conclusions
Our study introduces a novel approach to characterize the bioelectrical properties of MSCs by simultaneously evaluating both ΔΨP and ΔΨM parameters. Our simple flow cytometric strategy using tandem potentiometric dyes (DiBAC and TMRM) may enable researchers to map bioelectrical properties of the cell on a single chart to uncover previously unknown patterns. We demonstrated reconfiguration of the bioelectrical properties of MSCs due to distinct and well-characterized processes, such as extended in vitro culture, IFN-γ priming and aggregate culture. Future study will attempt to elucidate the relationship between MSC bioelectrical properties and their functional properties such as immunomodulation, tissue repair, and senescence. The stability of bioelectrical signals will also be assessed in future study. Greater understanding of bioelectrical phenotype of MSCs and other cells in various contexts may prove a useful tool in efforts to design more effective regenerative medicine therapies.
Footnotes
Authors' Contributions
T.K. designed and performed experiments, collected and analyzed data, and wrote the article. M.S.H. revised and edited the article. All authors have reviewed and approved the article before submission.
Declaration
The authors declare that the article has not been published, in press, or submitted elsewhere.
Author Disclosure Statement
No competing financial interests exist.
Funding Information
This study was supported by National Institute of Aging, NIA R03AG064550 and NIA R03AG056168 to Mariah S. Hahn.
References
Supplementary Material
Please find the following supplemental material available below.
For Open Access articles published under a Creative Commons License, all supplemental material carries the same license as the article it is associated with.
For non-Open Access articles published, all supplemental material carries a non-exclusive license, and permission requests for re-use of supplemental material or any part of supplemental material shall be sent directly to the copyright owner as specified in the copyright notice associated with the article.