
Abstract
To study functional connectivity using magnetoencephalographic (MEG) data, the high-quality source-level reconstruction of brain activity constitutes a critical element. MEG resting-state networks (RSNs) have been documented by means of a dedicated processing pipeline: MEG recordings are decomposed by independent component analysis (ICA) into artifact and brain components (ICs); next, the channel maps associated with the latter ones are projected into the source space and the resulting voxel-wise weights are used to linearly combine the IC time courses. An extensive description of the proposed pipeline is provided here, along with an assessment of its performances with respect to alternative approaches. The following investigations were carried out: (1) ICA decomposition algorithm. Synthetic data are used to assess the sensitivity of the ICA results to the decomposition algorithm, by testing FastICA, INFOMAX, and SOBI. FastICA with deflation approach, a standard solution, provides the best decomposition. (2) Recombination of brain ICs versus subtraction of artifactual ICs (at the channel level). Both the recombination of the brain ICs in the sensor space and the classical procedure of subtracting the artifactual ICs from the recordings provide a suitable reconstruction, with a lower distortion using the latter approach. (3) Recombination of brain ICs after localization versus localization of artifact-corrected recordings. The brain IC recombination after source localization, as implemented in the proposed pipeline, provides a lower source-level signal distortion. (4) Detection of RSNs. The accuracy in source-level reconstruction by the proposed pipeline is confirmed by an improved specificity in the retrieval of RSNs from experimental data.
Introduction
F
A general property of ICA-based reconstruction pipelines is the sensitivity of the results to the ICA decomposition algorithm (Hyvärinen and Oja, 2000; James and Hesse, 2005). In this regard, different algorithms are currently in use, and there is no general consensus on the optimal solution for MEG data (Mantini et al., 2008; Rong and Contreras-Vidal, 2006; Tang et al., 2002). After the decomposition, another important step is the classification of the resulting independent components (ICs) into brain signals and artifacts. Artifactual ICs are typically subtracted from the MEG recordings to increase the signal-to-noise ratio (Barbati et al., 2004; Mantini et al., 2008; Rong and Contreras-Vidal, 2006). However, the recombination of brain ICs can be alternatively used. As the ICs are typically characterized by relatively simple source configurations, the localization of their associated sensor maps ICs within the cortex can potentially provide large accuracy in the detection of source generators (Tsai et al., 2006). Accordingly, the recombination of the brain ICs after source localization has been adopted and optimized (de Pasquale et al., 2010; Hironaga and Ioannides, 2007) as an alternative to the direct localization of artifact-corrected recordings.
The present study provides an extensive description of the analysis pipeline used here to investigate the neurophysiological correlates of the RSNs found in the fMRI literature. The present study assesses multiple ICA algorithms and analyzes different strategies to use them on MEG resting-state data. In the present study, a comparative performance analysis of possible ICA-based processing pipelines is conducted for the definition of MEG RSNs. The aims of the present study were to verify on synthetic data the reliability of the pipeline in the reconstruction of MEG activity over the whole brain and to evaluate on experimental data its suitability for the RSN detection, compared with alternative solutions.
Materials and Methods
Data analysis pipeline
The proposed pipeline can be used for the source-level reconstruction of MEG resting-state activity and the subsequent detection of RSNs, under the assumptions of (1) spatial stationarity of the brain sources and (2) statistical independence between the signals produced by brain sources and the biological and nonbiological artifacts mixed in the recordings.
A brief overview of the pipeline is provided in the following text (Supplementary Fig. S1; Supplementary Methods are available online at

Fundamental steps in the proposed MEG signal-processing pipeline.
In its present form, the pipeline is implemented for use with commercial software, and it is therefore not publicly available. It is, however, possible to perform all the analysis steps in the proposed pipeline by means of the FieldTrip toolbox (Oostenveld et al., 2011), freely available at
Data preprocessing
Recordings are band-pass filtered by means of a Chebychev II-type filter. Forward and backward filtering is applied to obtain zero-phase distortion. Signals are also decimated, in compliance with the Nyquist–Shannon sampling theorem, to reduce the computational requirements for data processing.
ICA decomposition
ICA is a signal-processing method used to decompose independent patterns of brain or artifactual activity, namely ICs, which are linearly mixed into the functional data. Let the matrix of [n×D] MEG recordings be defined, wherein n is the number of MEG channels and D is the number of sampling points, as
where
IC classification
Artifact features in each IC are identified using multiple indicators in time and frequency domains (Barbati et al., 2004; Delorme et al., 2007). Each generic indicator α is compared with a threshold value α TH, selected based on a “training” set of 161 MEG ICs separated and classified in a previous ICA study (Mantini et al., 2008). Starting from an initial set of cutoff values chosen manually, a receiver–operator characteristic curve analysis was used to ensure an optimal combination of sensitivity and specificity (Mantini et al., 2008). A detailed description of the classification procedure is provided in the Supplementary Methods (see also Supplementary Table S1 and Supplementary Fig. S2).
A mixing matrix
In analogy, a mixing matrix
Importantly,
Localization of IC sensor maps
The IC sensor maps are projected onto the brain via a localization procedure carried out by means of a linear inverse method. The structural image of the subject's head is used for the creation of a realistic Boundary Element Method model based on the segmentation of the head tissues. This allows for the definition of the source space, that is, a regular 3D grid within the innermost compartment of the head model, sampled into k voxels with spatial resolution v. A geometrical registration of the MEG sensor array to a coordinate system referred to the subject's head is performed by using functional landmarks (i.e., nasion and preauricular points). The mc
brain IC sensor maps contained in the matrix
where i runs over the subset of the mc
brain ICs,
After the localization step, mc source maps in subject's space are obtained. Optionally, an affine transformation can be applied to the source maps for a coordinate transformation to an MNI stereotaxic space. This may allow for spatial comparison across subjects.
Source-level reconstruction analysis
The current source distribution at each voxel,
where αi is the amplitude restoring factor following IC sensors map normalization.
Once the current distribution is obtained, neuronal power time course pj
(τ) is estimated by integrating the squared amplitude of the voxel signal along the three directions x, y, z:
The integration over time potentially allows detecting functionally connected areas showing a phase lag in their respective instant power signals. Functional connectivity measures using slow modulations of MEG sources can therefore be used to detect areas belonging to the RSNs (de Pasquale et al., 2010).
Testing on synthetic data
A testing on synthetic data was set up to separately evaluate, and under controlled conditions, specific features related to the pipeline: (1) the separation performances (depending on the ICA algorithm used); (2) the classification of brain and artifactual ICs; (3) the accuracy in the reconstruction of the brain signals; and (4) the effectiveness of the source-space signal reconstruction through the localization of ICs.
Preparation of synthetic datasets
The synthetic datasets were obtained by linearly mixing ICs and adding Gaussian noise, in line with Equation 1. For the testing, 50,000 data samples were used, varying the number of mixed ICs (from 5 to 150) and the level of Gaussian noise (−60, −40, −30, −20, and 0 dB).
A set of 150 IC time courses was extracted from MEG recordings collected during event-related experiments (Del Gratta et al., 2002; Della Penna et al., 2007; Perfetti et al., 2007; Stavrinou et al., 2007). Specifically, 4 ICs related to biological artifacts (heart, blink, saccade, muscle) and 146 ICs related to independent brain sources were included (see Supplementary Fig. S3). Although the MEG datasets belong to task-related activation studies, intrinsic activity was not averaged out in the current analyses, thus making the IC temporal structure similar to that of MEG datasets from resting-state paradigms. The spatial distribution over the sensors of each brain IC was calculated by mapping the magnetic field produced by a single equivalent current dipole with random position within the MNI space and with random orientation (nonzero tangential component). Finally, Gaussian noise with variable intensity level was added to them.
ICA algorithms
ICA processing was performed on a principal component (PC) with an Intel® Core™ Duo processor at 1.83 GHz and 4 GB of RAM. Three ICA algorithms, that is, INFOMAX, SOBI, and FastICA, were tested. An important distinction from the viewpoint of the algorithm implementation is the possibility to use a symmetric or a deflation decomposition approach. All three algorithms can perform a joint estimation of the ICs, according to the symmetric approach. In this case, the prior knowledge of the optimal number of ICs is required. A deflation approach, based in the iterative IC estimation, can be used with the FastICA algorithm (Hyvärinen and Oja, 2000), thus allowing a data-driven estimate of the number of ICs (Mantini et al., 2008). All the algorithms were required to estimate as many ICs as the number of recordings (full ICA decomposition). Importantly, results from FastICA with symmetric approach were not reported here, as this algorithm did not converge and provided no reliable output on the testing platform.
To improve reliability, the ICA algorithm performances were measured 10 times on datasets generated with different equivalent current dipole configurations (and therefore different IC mixing weights). Then, the corresponding results were averaged.
Performance measures
The separation performance of each ICA algorithm was assessed by comparing the estimated ICs
where larger values correspond to improved separation performance (Mantini et al., 2006; Vincent et al., 2006). Additionally, the computational speed of each ICA algorithm was measured in terms of the time required to produce its output.
Next, the IC detection rate and the signal-to-distortion ratio (SDR) of the MEG recordings after artifact correction were computed (Vincent et al., 2006). The IC detection rate was defined as the ratio between the ICs correctly classified and the total number of ICs. The SDR, which is a global measure of the similarity between the original and reconstructed signals, was defined for the ith simulated recording (SDR
i
) as
where X
ci
(t) and
The SDR measure was used in a similar way on the signals in the source space. In this case, the time courses reconstructed in the same position of the simulated brain sources were focused. Specifically, the source-level reconstruction by the proposed pipeline and that of more typical ICA-based approaches consisting of ICA decomposition, sensor-level artifact subtraction (see Equation 3) and source localization for each time-sample were assessed. In the latter case, the source localizations were performed in Curry 6.0 using either WMNLS (Hamalainen and Ilmoniemi, 1994; Wang et al., 1992) or Vector Beamformer (Hillebrand et al., 2005; Sekihara et al., 2001). To specifically assess the importance of the decomposition basis for the reconstructed source-space signals, in the comparison on synthetic data, a pipeline equivalent to the proposed one was included, the only difference being the use of PCs instead of ICs as input for localization. Accordingly, this fourth pipeline was composed of the following main steps: FastICA for artifact subtraction at the sensor level, principal component analysis (PCA) decomposition (Yang and Wang, 1999) of the artifact-free recordings, WMNLS localization of PC sensor maps, and PC time-course recombination in the source space.
Validation on experimental data
Resting-state MEG and blood oxygen level-dependent (BOLD) data in a right-handed healthy female subject were used for the validation of the pipeline. Before undergoing the acquisitions, she gave a written informed consent to the experimental procedures, which were approved by the Institutional Ethics Committee of Chieti University. The subject was asked to not think about anything in particular, to be as still as possible, and to fixate to a point in the center of a black screen in front of her.
MEG data collection
Five minutes of MEG data were acquired in a magnetic shielded room by means of a multichannel MEG system (ATB, Pescara, Italy) with 153 dc-SQUID integrated magnetometers placed over a whole-head helmet surface (Della Penna et al., 2000). Nonmagnetic leads were positioned over the subject's chest and close to the eyes, thus allowing simultaneous electrocardiographic and electrooculographic recordings. A piezoelectric sensor, placed over the subject's thorax by means of an elastic band, allowed recording subject's respiratory activity. Hardware recording parameters were 1025 Hz sampling rate and 0.16–250 Hz band-pass filtering.
fMRI data collection
After MEG data collection, 5 min of BOLD functional images and a high-resolution structural image of the subject's head by means of an 1.5T Magnetom Vision scanner (Siemens, Munchen, Germany) were acquired. Functional images were collected with an echo planar sequence (repetition time=2.163 s; echo time=50 ms; α=90°, matrix=64×64, 3.75×3.75 mm in-plane resolution, slice thickness=8 mm, 16 slices). Anatomical images were collected using a sagittal magnetization-prepared rapid acquisition gradient echo T1-weighted sequence (repetition time=9.7 s; echo time=4 ms; α=12°; inversion time=1,200 ms; voxel size=1×1×1.25 mm).
MEG data analysis
The MEG recordings were filtered in the band 0.16–150 Hz, to reduce environmental noise but to preserve brain signals. The decimation factor was accordingly set to 3, thus reducing the sampling frequency from 1025 to 341.7 Hz. Next, the FastICA with deflation approach was used on the MEG data, and the resulting ICs were classified as brain or artifactual ICs (Supplementary Table 1). Based on the same set of classified ICs, three different pipelines for the source-level reconstruction of brain activity were derived: the proposed pipeline and the two pipelines based on localization of the artifact-corrected recordings by either WMNLS or Vector Beamformer; the pipeline including PCA before WMNLS localization, being equivalent to the proposed pipeline except for the decomposition basis, was not included in the comparison on experimental data. The full-band power was calculated from reconstructed brain signals in windows of 400 ms, shifted by 20 ms, over a data segment of 8 sec.
fMRI data analysis
Initial data preprocessing was performed using the SPM5 software package (Wellcome Department of Cognitive Neurology, London, United Kingdom). The preprocessing steps involved the following: (1) correction for slice-timing differences; (2) correction of head-motion across functional images; (3) coregistration of the anatomical image and the mean functional image; (4) spatial normalization of all images to an MNI stereotaxic space with a voxel size of 4 mm isotropic. In preparation for functional connectivity analysis, data were passed through several additional preprocessing steps by in-house software (Fox et al., 2005): (1) temporal filtering retaining frequencies in the 0.009–0.08 Hz band; (2) removal by linear regression of three-dimensional motion parameters, white matter signal and ventricle signal; (3) spatial smoothing with 8 mm full width at half-maximum Gaussian blur.
MEG and fMRI functional connectivity
Functional connectivity maps were calculated in MEG and fMRI data by extracting the time course in a selected seed area and correlating it with the time courses in the rest of the brain. For the comparative analysis, the BOLD-fMRI signals and the slow power modulations of MEG signals, respectively, were used. The dorsal attention network, which has been previously reported in resting-state fMRI and MEG studies (Fox et al., 2005; de Pasquale et al., 2010), was investigated. Accordingly, the left posterior intraparietal sulcus (pIPS; MNI coordinates [−25, −67, 48]) was selected as network seed. By temporal correlation, the strength of functional connectivity with three other areas of the same network, that is, right pIPS ([23, −69, 49]), left and right frontal eye field (FEF; [−33, −5, 66] and [31, −5, 56], respectively), and two areas in the motor network, that is, the left and right primary motor area (M1; [−40, −29, 51] and [38, −29, 51], respectively), was measured. The motor areas served as control, as functional connectivity has been shown to be stronger within nodes of the same RSNs than between nodes of different RSNs (Fox and Raichle, 2007). As the detected correlation values may change between fMRI and MEG data and also across different MEG methods, the functional connectivity maps were evaluated by showing the same number of voxels. Accordingly, a threshold equal to the 90th percentile of the distribution of correlation values in the brain was selected. The software Caret 5.61 (
Results
ICA algorithm performances
FastICA showed the ability to estimate the number of mixed ICs with satisfactory precision, whereas Informax and SOBI always performed a full decomposition independently of the number of underlying simulated sources (Fig. 2A). The presence of additional noise in the data unselectively affected the performance of all the algorithms (Fig. 2B). In addition, for each algorithm, an increased number of mixed ICs resulted in a lower SIR, as confirmed by the comparison between the results obtained at −20 dB noise level with 20 and 150 ICs. Nonetheless, FastICA showed an SIR for brain ICs larger than 14 dB when at most 75 ICs were mixed; the same measure for INFOMAX and SOBI was above the same threshold only with at most 10 and 20 ICs, respectively (Fig. 2C). Conversely, the SIR for artifact ICs, although slightly decreasing with the number of mixed ICs, was above 16 dB for all algorithms. Speed differences among the ICA algorithms were observed: with an increasing number of ICs, the computation time for INFOMAX, SOBI, and FastICA was constant, decreased, and increased, respectively (Fig. 2D).

Performance comparison of different ICA algorithms on the synthetic dataset (see Materials and Methods section). The SIR and the computation times of the ICA decomposition, the detection rate of the IC classification, and the SDR of the ICA-based artifact-corrected recordings are measured.
Activity reconstruction in the sensor space
The characteristics of the ICs, as retrieved by the different ICA algorithms, substantially influenced the effectiveness of the IC classification: an average IC detection rate of 95% was obtained for the FastICA algorithm, whereas much lower values were scored by INFOMAX and SOBI (Fig. 2E), with maximum IC detection rates of 57% and 29%, respectively.
The analysis of SDR at the sensor level allowed appreciating the artifact-corrected MEG signal reconstruction performances according to either a brain IC recombination or an artifact IC subtraction approach. In general, both seemed to be effective only when using FastICA, but much larger SDR values, always above 45 dB, were obtained with artifact IC subtraction (Fig. 2F). The implementation with brain IC recombination provided with FastICA an average SDR value of 21 dB across different numbers of mixed ICs.
Activity reconstruction in the source space
The FastICA algorithm was only selected, and the effect of source localization when using the brain IC recombination and the artifactual IC subtraction was further investigated. The results of the comparative analysis on the SDR in the source space are illustrated in Figure 3. A common decrease of the reconstruction performances was generally evident when more ICs were mixed. Nonetheless, interesting differences were found among the tested approaches. WMNLS and Vector Beamformer applied to the artifact-corrected MEG recordings did not provide accurate reconstruction in the source space, with a significant reduction of more than 35 dB with respect to the SDR obtained with FastICA at the sensor level. Further, the PCA decomposition showed to improve the performances of the WMNLS localization, outperforming the proposed pipeline with 5 mixed ICs (therefore with one brain IC only) and with more than 20 mixed ICs. Despite the lower SDR measured at the sensor level, the brain IC recombination approach proved to be superior to other solutions based on artifact IC subtraction with a number of ICs in the typical range for experimental data (Mantini et al., 2008).
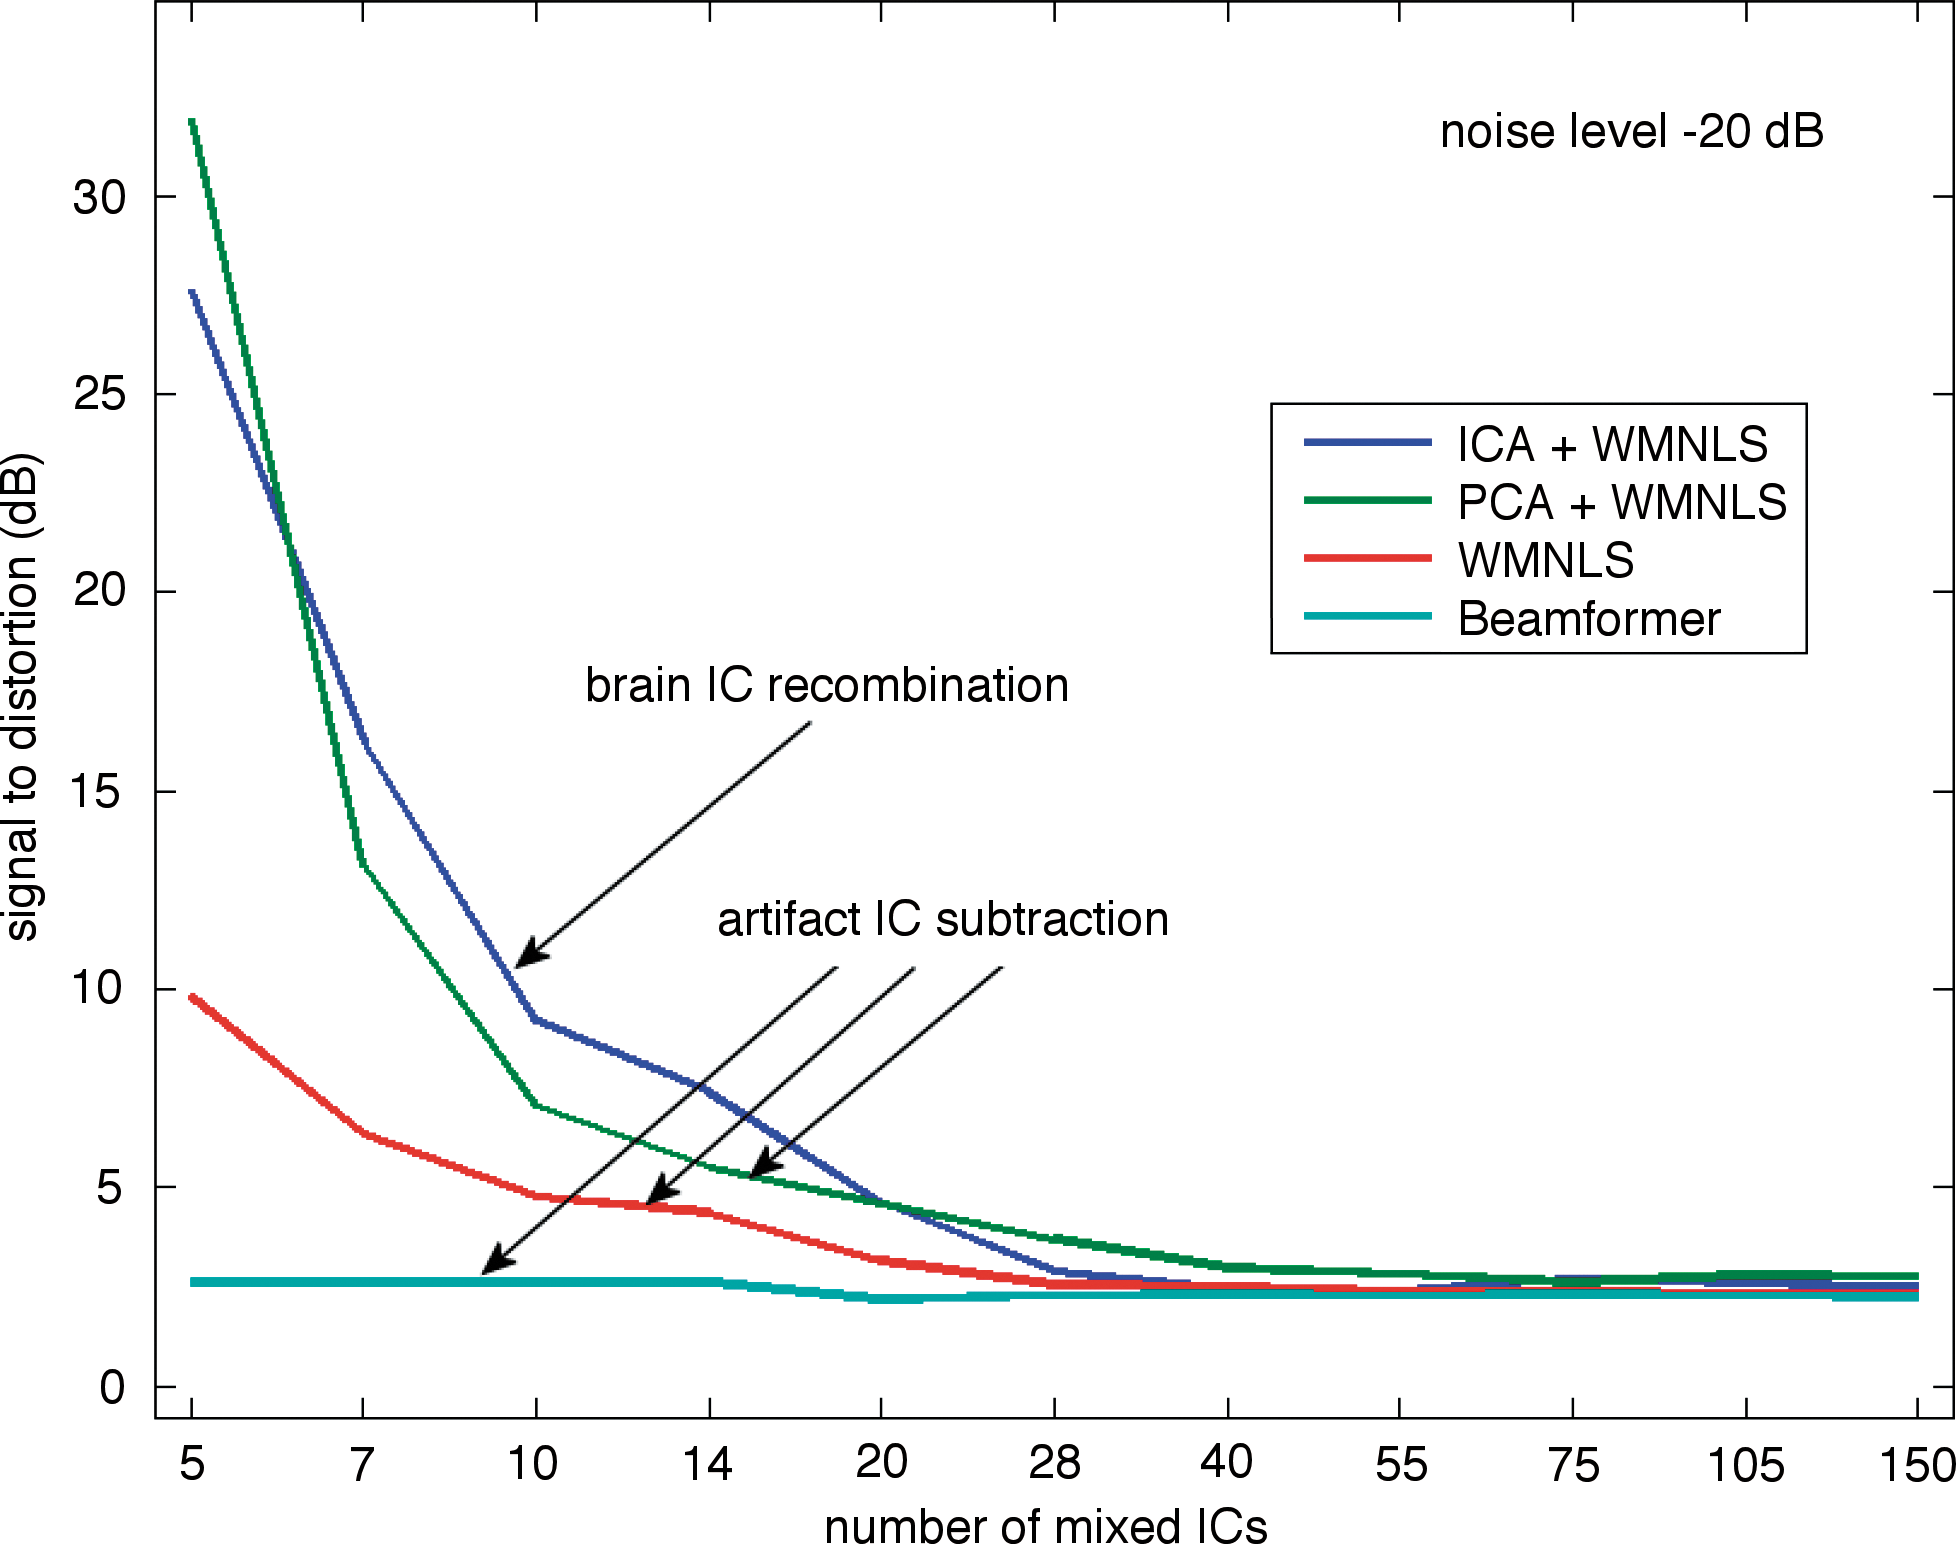
Relationship between SDR in the source space and number of ICs for the synthetic dataset at noise level=−20 dB. The brain IC recombination with WMNLS is compared with artifact IC subtraction with PCA and WMNLS, WMNLS only, and Vector Beamformer. PCA, principal component analysis.
Detection of RSNs
To evaluate the effect of different reconstruction approaches on the detection of RSNs, functional connectivity analysis was applied, based on temporal correlation on experimental resting-state MEG and fMRI data from a single-subject (de Pasquale et al., 2010; Fox et al., 2005). The dorsal attention network was analyzed using the motor network as control (Fig. 4A). By seeding in left pIPS, substantial differences in the functional connectivity maps were observed using the three MEG pipelines under investigation (Fig. 4B–D). Three of the four main nodes in the dorsal attention network were detected with the proposed pipeline, specifically the left and right pIPS and the left FEF (Fig. 4B). A widespread and nonspecific spatial pattern was obtained with the signals localized in the source space by WMNLS (Fig. 4C). Conversely, the connectivity map calculated from the signals localized by Beamformer was substantially sharp and mainly showed the selected seed (Fig. 4D). The whole-brain spatial pattern and the distribution of correlations across the dorsal attention and the motor network nodes obtained by using the proposed pipeline on MEG data were partially similar to those detected from fMRI data (Fig. 4A,B). Conversely, a substantial difference was observed for the other two pipelines.

Whole-brain functional connectivity maps and correlation distribution across the dorsal attention and motor networks, obtained in a single subject by seeding in the left pIPS. Functional connectivity maps are shown over a template cortex in lateral, dorsal, and medial views. They are thresholded on the basis of the 90th percentile of the correlation values in the brain for spatial comparison across different methods. Correlation distribution is assessed in the left and right pIPS and the left and right FEF for the dorsal attention network, and the left and right M1 for the motor network.
Discussion
The results of this study confirm the effectiveness of the proposed pipeline for the source-space reconstruction of MEG resting-state activity. It concurrently permits the attenuation of artifacts contained in the recordings and the source space estimation of ongoing brain activity. This is a fundamental requirement for the analysis of resting-state data, for which no data averaging for signal-to-noise ratio enhancement is possible.
ICA decomposition
ICA has proved to be a valuable tool for MEG/EEG analysis, either for the attenuation of artifacts and noise (Barbati et al., 2004; Mantini et al., 2008) or for the investigation of brain source activity (Barbati et al., 2006; Hironaga and Ioannides, 2007; Tsai et al., 2006). The first important point for an effective use of ICA is to ensure a successful decomposition of the source signals. Previous ICA studies typically adopted a full ICA decomposition, assuming the number of ICs equal to that of the recording channels (Hironaga and Ioannides, 2007; Jung et al., 2000). However, if such an assumption is not valid, the full decomposition may provide an unsatisfactory IC separation (Hyvärinen and Oja, 2000). In this regard, the deflation approach for estimating the number of ICs, retaining as much data variance, can be effectively used in MEG data analysis (Mantini et al., 2008). The results on synthetic data further confirm this finding. The simulations in the present study show that FastICA with deflation approach, the standard ICA algorithm in the proposed pipeline, outperforms the other algorithms using the symmetric approach in terms of both SIR and SDR, particularly when the number of mixed ICs is lower than that of recordings.
Artifact IC subtraction versus brain IC recombination
Besides an effective ICA decomposition, a reliable IC classification is fundamental for the analysis of MEG data. The results on synthetic data suggested the proposed pipeline to be characterized by an IC classification rate larger than other strategies proposed in the literature (Barbati et al., 2004; Mantini et al., 2008; Rong and Contreras-Vidal, 2006). The IC classification into artifact and brain components allows for the use of two different strategies for the reconstruction of artifact-corrected signals: the brain IC recombination and the artifact IC subtraction. The lower SDR values of the brain IC recombination with respect to the artifact IC subtraction in the sensor space may be partially explained in terms of a major reduction in the dimensionality of the data and in the rejection of low-power signals undetected by ICA. Conversely, the SDR analysis in the source space suggests the brain IC recombination approach to be more effective when applied after source localization. As the regularization in the minimum-norm solution inherently suppresses noisy brain components usually associated with spatially complex signal (and source) patterns, the benefit of working with simple sensors maps associated with a limited number of dipolar sources for each brain ICs instead of all data samples should be considered. Indeed, the source estimates obtained for multiple simultaneously active regions have been documented to be less reliable (Darvas et al., 2004; Wagner et al., 2004; Wipf et al., 2010). It is also likely that Vector Beamformer was unable to properly reconstruct the brain signals because of the singularity of the covariance matrix induced by the subtraction of the artifactual ICs. This is a study limitation that may be addressed in future investigations, for example by using appropriate regularization parameters for the Beamformer (Hillebrand et al., 2005). Additionally, it was observed that the data decomposition followed by source-level linear combination can result in a general SDR improvement with respect to the direct localization by WMNLS and Vector Beamformer on artifact-corrected recordings. This improvement is largely independent of the decomposition basis (ICs versus PCs). The difference between PCA and ICA may depend on the complexity in the topography of the maps to be localized: unlike PCA, ICA produces a large number of components with dipolar patterns, associated with simple source configurations (Makeig et al., 2002; Hironaga and Ioannides, 2007; Tsai et al., 2006).
Reconstruction of brain activity in the source space
In a large number of MEG/EEG studies, the brains ICs were directly used as descriptors of regional activation. Therefore, the IC maps were localized in the source space, first with dipole models (Makeig et al., 2002) and more recently with distributed source models (Tsai et al., 2006). As first observed by Hironaga and Ioannides, individual ICs can show interesting behavior, but most ICs unlikely describe single generator activity because of the interactions between neuronal assemblies within different brain regions (Hironaga and Ioannides, 2007). As shown in the simulations in the present study, the recombination of the brain ICs, either in the sensor or in the source space, can be considered a step suitable not only for artifact correction but also for reliably reconstructing brain activity. In alternative to the proposed pipeline, a frequency-based ICA method has been proposed to decompose resting-state activity, capturing brain regions with the same frequency profile but possible phase shifts within the same IC (Hyvärinen et al., 2010). In particular, this method provides a large number of physiologically plausible generators characterized by a distinct spectral profile. However, it is unclear whether it permits to investigate the temporal dynamics of intrinsic activity across distant brain regions. This analysis would instead be possible using the method for the localization of individual area neuronal activity by Hironaga and Ioannides (2007), but just for manually selected region of interests. In this regard, the proposed pipeline allows instead an automated reconstruction of activity within the whole brain, a stage strictly required for RSN mapping.
Source space analysis of MEG RSNs
To apply functional connectivity methods to MEG data, source-space signals with low artifactual contamination are necessary. Additionally, the localization procedure should preserve as much as possible the spatial distribution of the real sources to avoid potential distortions in the retrieved connectivity pattern. To assess the capability of the proposed pipeline for addressing these two important issues, the functional connectivity from the left pIPS, a main area in the dorsal attention network (Fox et al., 2005), was evaluated. The topographic distribution of the network as retrieved by the proposed pipeline is in agreement with the corresponding fMRI network. Critically, the correlation map included local maxima in the seed itself (left pIPS), the left FEF and the right pIPS, and local minima between them. This indicates the specificity of functional connections involving widely separated RSN nodes. This was not the case when using WMNLS and Vector Beamformer on artifact-corrected MEG recordings. With the former solution, a widespread pattern including all the dorsal attention network nodes, but also a large number of brain areas outside the network, was obtained; with the latter one, the seed area for connectivity analysis was selectively found, but not the other dorsal attention network nodes. Based on the simulations on synthetic MEG data, it can be argued that the connectivity results obtained with the proposed pipeline on experimental data could be explained by an improved quality in the reconstruction of the source-space signals. The present study's findings need to be further validated in future studies. For example, the different MEG pipelines may be compared on simulated data with realistic RSN topology and dynamics and/or on experimental data from a large group of subjects with test–retest observations (Zuo et al., 2010).
Conclusion
The high-quality reconstruction of neuronal activity over the whole brain has been shown to be a critical element in resting-state MEG studies. Importantly, the proposed pipeline may be valuable to investigate the RSNs, particularly their temporal dynamics (Bassett et al., 2006; Douw et al., 2010; Liu et al., 2010; Stam and Reijneveld, 2007). The analysis of MEG RSNs is expected to increase the knowledge on the neuronal processes underlying functional connectivity from noninvasive electrophysiological measurements, contributing to the understanding of the basic mechanisms of long-range neuronal communication in the human brain.
Footnotes
Acknowledgments
The authors thank Luca Ciancetta, Paolo Belardinelli, and Christopher Lewis for data acquisition and technical assistance and Abraham Z. Snyder for scientific discussion. Dante Mantini has been supported by the Research Foundation Flanders (FWO, post-doc mandate A4/5-SDS15387 and grant G083111N). This study has been funded by the Seventh Framework Program of the European Community (BRAINSYNC project, grant FWP-200728).
Author Disclosure statement
No competing financial interests exist.
References
Supplementary Material
Please find the following supplemental material available below.
For Open Access articles published under a Creative Commons License, all supplemental material carries the same license as the article it is associated with.
For non-Open Access articles published, all supplemental material carries a non-exclusive license, and permission requests for re-use of supplemental material or any part of supplemental material shall be sent directly to the copyright owner as specified in the copyright notice associated with the article.